Smart Pet Supply Optimization Landing Page Template
Forecast is an AI-powered inventory forecasting landing page template built for the pet retail industry. It combines a mission-control visual aesthetic with scroll-triggered animations, a live dashboard preview, an interactive comparison module, and a personalized ROI calculator. Pet retailers, chain operators, and procurement directors can see exactly how demand forecasting replaces guesswork with six-week advance stockout predictions.
by Rocket studio
Quick summary
Forecast is a scroll reveal landing page template designed for an AI-powered pet retail inventory forecasting platform. The page opens with an animated dashboard, unrolls like a proprietary industry report, and guides visitors through escalating proof before landing them at a personalized savings calculator. Every section is built to move supply chain operators from skepticism to action.
Who this template is for
This template is built for B2B software teams selling demand forecasting tools into the pet industry. It speaks directly to operators who manage complexity at scale every day and need more than a brochure to trust a platform.
- Regional pet store chain operators running fifteen to forty locations who need accurate forecasts across multiple locations.
- E-commerce fulfillment managers handling thousands of pet products with serious SKU sprawl and volatile sales velocity.
- Procurement directors at veterinary distribution companies burned by seasonal heartworm medication shortages and unpredictable market conditions.
What problem this template solves
A major pain point in inventory management is the difficulty of predicting seasonal demand for pet products. Pet stores lose revenue to both stockouts and excess inventory every year. Basic statistical models cannot process the volume of signals that modern pet retail business operations generate. The Forecast template frames this problem with hard data and visual urgency before presenting the solution.
- Pet retailers struggle with seasonal fluctuations, supplier delays, and demand patterns that shift faster than manual reorder systems can adapt.
- Pet store owners using traditional reorder points cannot analyze data across weather patterns, social media trends, consumer behavior, and economic indicators simultaneously.
- Mid sized retailers face budget constraints that make enterprise forecasting software inaccessible, while their daily operations still demand accurate demand forecasts at scale.
What you get with this template
The Forecast template is a complete, production-ready landing page built around the Scroll Reveal (Progressive) style and Dynamic Motion theme. Every section is purposefully sequenced to build trust before asking for commitment. The interactive modules are designed to do the convincing so your sales team does not have to start from zero.
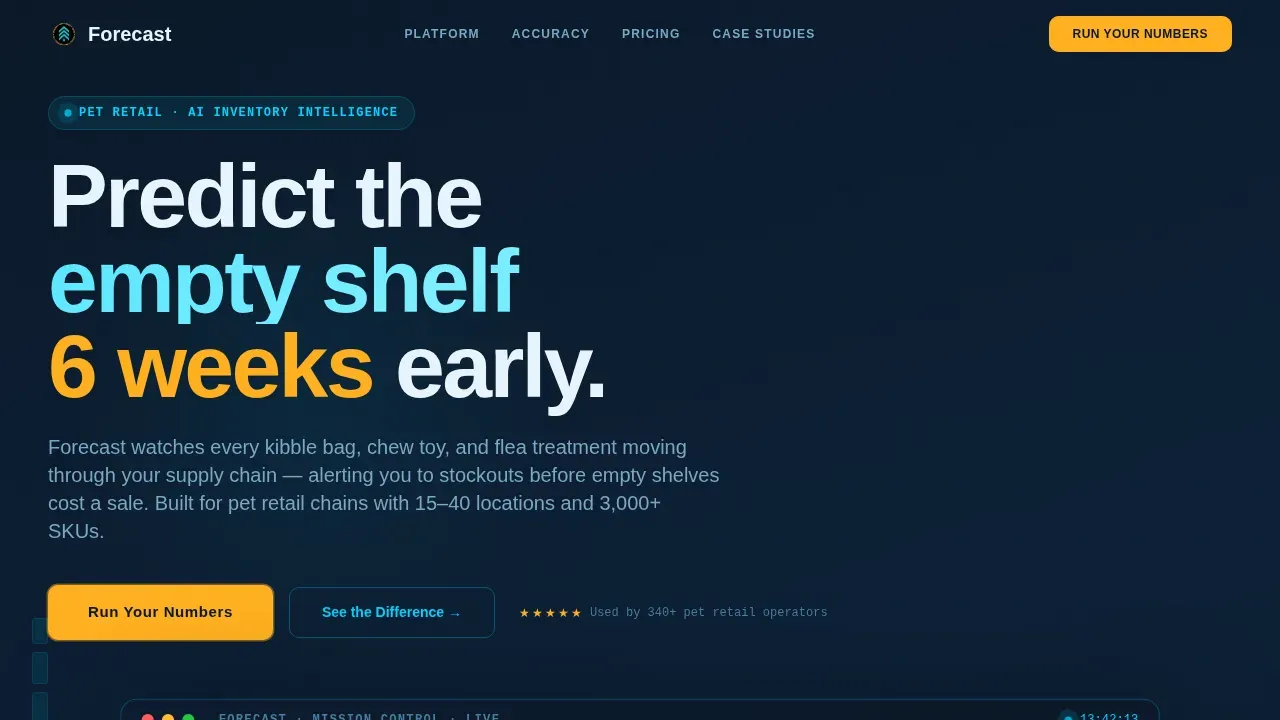
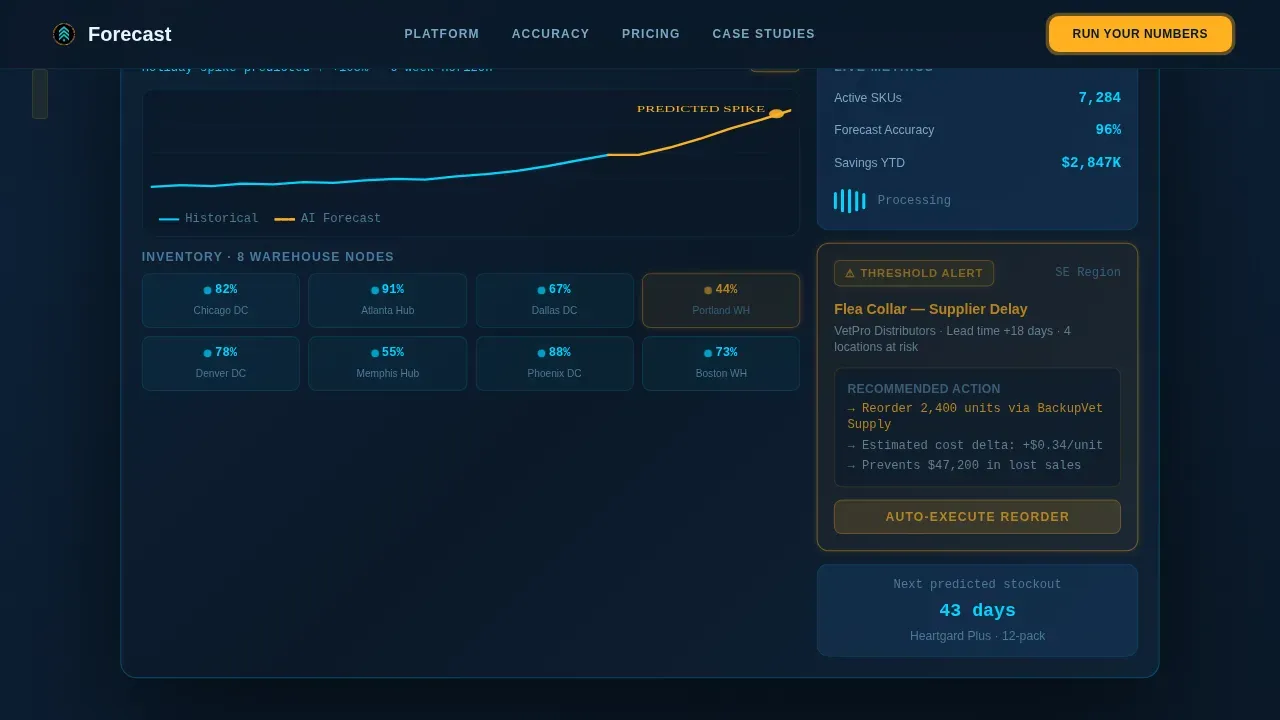
- An animated hero section with a live dashboard simulation showing ticking numbers, warehouse inventory levels pulsing in cyan, and an amber alert zooming into a supplier delay in real time.
- A full comparison module letting visitors toggle between traditional reorder points and AI-powered forecasting across five performance metrics.
- A personalized ROI calculator where visitors input their SKU count, location count, and current stockout percentage to receive a tailored savings projection.
Feature list
This template is built around six key features that work together to communicate capability, build credibility, and drive conversions for AI-powered inventory management platforms targeting pet stores and enterprise pet retailers.
Animated Mission-Control Hero
The hero section passes the five-second test immediately. Visitors see a living forecasting dashboard displaying real pet retail data: a demand curve for grain-free dog food climbing toward a holiday spike, eight warehouse nodes pulsing in cyan, and an amber alert flagging a supplier delay. Numbers tick upward in real time, communicating the platform's ai powered intelligence before a single word is read.
Scroll-Triggered Industry Report Narrative
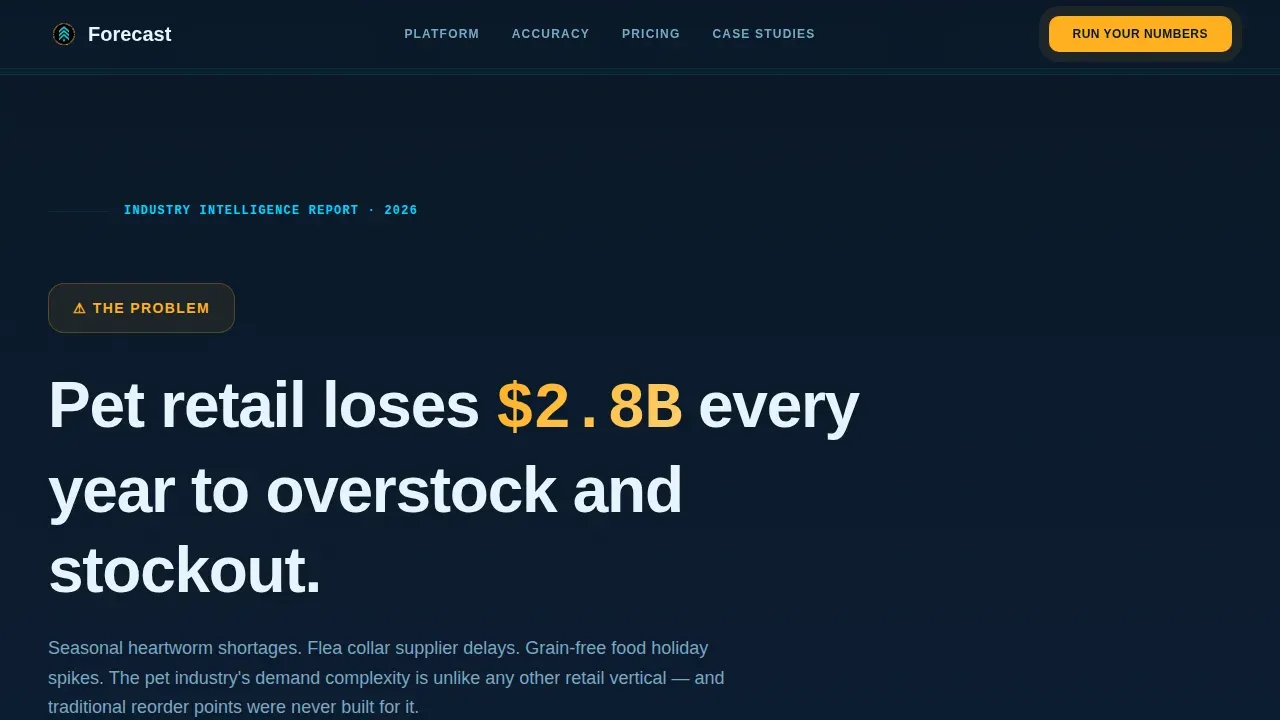
The page unrolls like a confidential research document. Each scroll trigger animates a new chart or data layer sliding into frame with kinetic momentum. The narrative opens with a staggering industry loss figure, then progressively discloses methodology, machine learning model accuracy benchmarks, and anonymized case data. Every section answers the skepticism the previous one created, building an evidence wall where each proof point escalates the last.
Interactive Comparison Module
A persistent toggle module lets visitors switch between traditional reorder logic and AI-driven forecasting across five metrics: stockout frequency, carrying cost, spoilage rate, supplier lead time accuracy, and demand prediction window. The comparison does not lecture; it shows. Visitors can directly see how machine learning algorithms outperform spreadsheet-based inventory control across every dimension that affects a pet retail business bottom line.
Personalized ROI Calculator
The primary call-to-action, "Run Your Numbers," opens a lightweight calculator. Visitors enter their SKU count, location count, and current stockout percentage. The tool returns a personalized savings projection grounded in their own operational data. Interactive tools such as ROI calculators help pet store owners see potential savings from AI-driven inventory management before they ever speak to a salesperson, which reduces customer acquisition costs and shortens sales cycles.
Escalating Evidence Wall
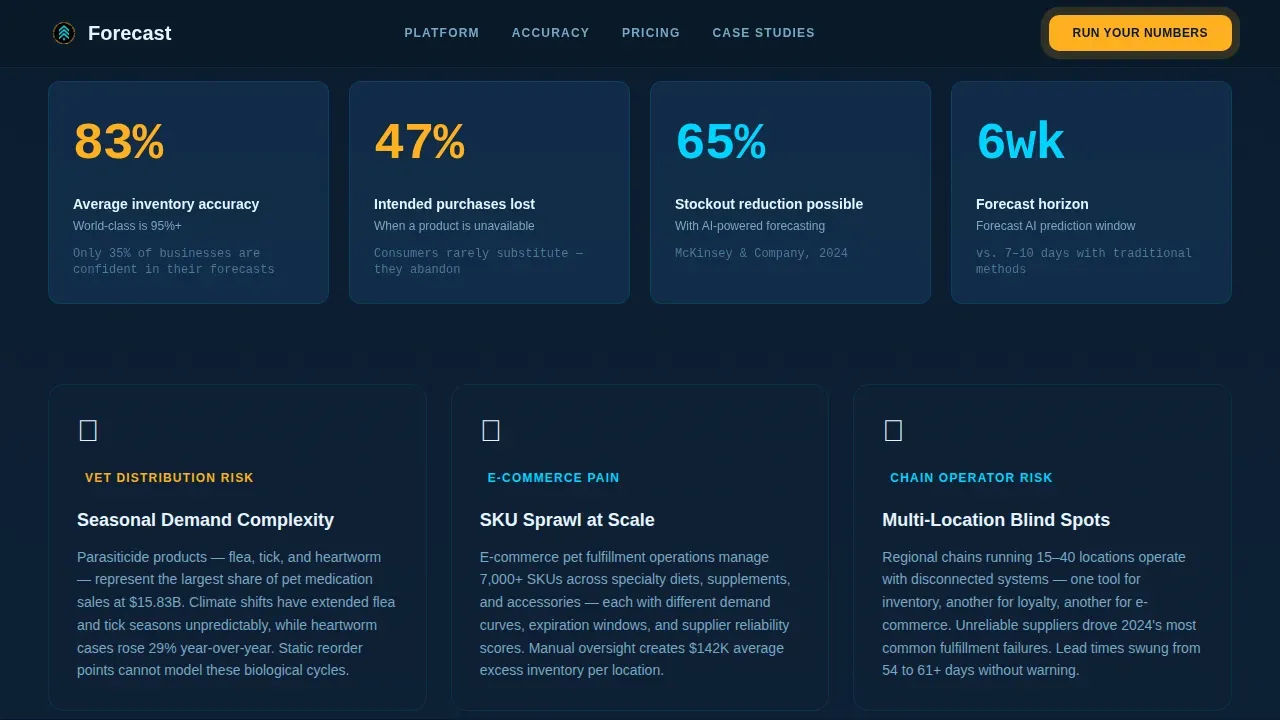
The evidence wall section presents accuracy benchmarks, anonymized case results, and sourced industry statistics with kinetic chart animations. Each data point is sequenced to answer the doubt generated by the previous one. This approach supports the B2B buying process, where decision-makers need quantifiable case studies and social proof to justify investment to procurement committees.
Email-Gated Industry Report Offer
A secondary conversion path offers the full industry report as a downloadable PDF behind an email gate. This captures leads who are not yet ready to run a calculation but are actively researching the pet industry problem. It turns content into a measurable conversion event without requiring a sales conversation.
Page sections overview
| Section | Purpose |
|---|---|
| Hero Dashboard Preview | Opens with animated forecasting interface; communicates core value instantly |
| Industry Problem Reveal | Scrolling stat display introduces $2.8B annual pet retail loss figure |
| Comparison Toggle Module | Side-by-side metric toggle: traditional reorder points versus AI forecasting |
| Evidence Wall | Kinetic charts present accuracy benchmarks and anonymized case data |
| ROI Calculator | Personalized savings projection based on visitor's own operational inputs |
| Footer (Linear Single-Row) | Clean single-row footer with minimal navigation and secondary links |
Design & branding system
The Forecast template uses a Midnight Blue color system that feels like a mission control room at 2 a.m. Dark surfaces glow with moving data. Every bright pixel earns its place by signaling something meaningful. The typography pairing separates human-readable content from data-driven readouts for instant visual hierarchy.
- Color palette: deep terminal navy (#0B1929) as the base, satellite-map ocean (#163A5F) for layering, live-data cyan (#00D4FF) for active data points and inventory level indicators, and alert amber (#FFB020) reserved exclusively for threshold warnings and call-to-action pulses.
- Typography: DM Sans for headings and body copy, JetBrains Mono for data figures, counters, and machine-readable number displays.
- Visual style: Dynamic Motion theme with scroll-triggered reveals, animated counters, live dashboard simulations, and a comparison toggle built to hold attention and communicate ai capabilities visually.
Mobile & speed optimization
The Forecast template is desktop-first by design, reflecting how supply chain operators and procurement directors work. Most daily operations decisions happen on large screens where data-dense dashboards are easiest to read. The layout is also responsive, ensuring pet store managers checking stock levels on the go can still navigate and engage.
- Desktop-first layout prioritizes wide dashboard visualizations, side-by-side comparison tables, and data-rich chart animations that benefit from screen real estate.
- Responsive mobile layout ensures product availability information, call to action buttons, and the ROI calculator remain fully functional on smaller screens.
- Server Components handle static content delivery while Client Components manage interactive modules, keeping the animated experience smooth across devices.
How this template helps you convert
The Forecast template is engineered around one goal: turning a skeptical supply chain operator into someone who clicks "Run Your Numbers." The conversion architecture is layered so that each section removes a new objection and advances commitment.
- The animated hero section creates immediate relevance by showing actual pet retail scenarios, grain-free dog food demand curves, and live warehouse inventory levels pulsing in cyan, so visitors self-identify as the right audience within seconds.
- The comparison module makes the competitive advantage concrete by quantifying the gap between traditional forecasting and AI-powered demand forecasting across five real operational metrics, removing the need for visitors to imagine the difference.
- The ROI calculator personalizes the value proposition using the visitor's own numbers, transforming a platform claim into a specific projected savings figure tied to their pet stores, SKU count, and current stockout percentage.
Other information about this template
The Forecast template is built specifically for the pet industry, where demand forecasting challenges are uniquely layered. Pet age progressions, breed-specific needs, and lifecycle transitions (such as when puppies move from puppy food to adult pet food) create demand patterns that basic statistical models miss entirely. AI agents embedded in the platform monitor every signal continuously, from weather data affecting flea treatment sales to social media sentiment around new joint supplements launches.
- The platform's ai models process massive datasets to surface hidden patterns that human agents and spreadsheet tools cannot detect, covering product categories from grain free dog food to joint supplements to specialty pet food lines.
- Sales patterns, purchase patterns, and purchase frequency data feed machine learning models that grow more accurate over time through deep learning, improving forecast accuracy with every new cycle.
- The system can generate six-month purchase orders in seconds, excluding holiday items or custom categories as needed, saving hours that procurement teams previously spent on manual reorder calculations.
- AI tools embedded in the platform can analyze customer feedback and social media sentiment to inform demand forecasting, giving pet supply retailers an edge on emerging consumer preferences and social media trends.
- Predictive analytics within the platform account for weather patterns, promotional campaigns, economic indicators, and sales velocity shifts across multiple locations simultaneously.
- The platform supports voice search optimization features for operational queries, enabling natural language inputs so team members can query stock levels and reorder status without navigating complex dashboards.
- Smart brands and growing pet retailers can use the platform's customer engagement insights to personalize promotions, optimize shelf layouts, and reduce customer acquisition costs by targeting the right product categories at the right time.
- Safety stock calculations are automated, ensuring pet stores maintain correct buffer inventory even during seasonal fluctuations or supplier delays, reducing excess inventory while protecting product availability.
- Independent pet shops can reduce stockout rates by 80 percent and reclaim hours previously lost to weekly manual orders, giving mid sized retailers the kind of inventory control that was once only available to enterprise chains.
- The system supports real time adjustments to replenishment recommendations as market conditions shift, with ai agents continuously monitoring sales trends and customer data to keep stock levels aligned with actual demand.
- This is the forecast ai powered pet retail inventory forecasting landing page template, built for teams who need to communicate the full value of predictive analytics to a skeptical B2B audience.
Theme
Dynamic Motion
Creative direction
Industry Report
Color system
Midnight Blue
Style
Scroll Reveal (Progressive)
Direction
Comparison/Versus
Page Sections
Animated Mission-control Hero Dashboard
Scroll-triggered Escalating Proof Wall
Interactive Comparison Toggle Module
Personalized ROI Calculator
Email-gated Industry Report Conversion Path
Dynamic Motion Visual System
Related questions
Who is the Forecast template designed for?
What sections are included in the Forecast landing page?
Can the ROI calculator be customized for different scenarios?
How does the comparison module work?
Is this template suitable for desktop-heavy B2B audiences?



