Expert Advanced Tech & AI Platforms Comparison Website Template
Attributix is a dark-mode marketing mix modeling landing page template built for SaaS analytics tools. It opens with an interactive Python code block, moves into a side-by-side comparison table, and closes with a free-trial call to action. The design uses void black, phosphor green, and electric violet to make every data point feel urgent and precise.
by Rocket studio
Quick summary
Attributix is a single-page landing page template designed for a marketing mix modeling (MMM) SaaS tool. It leads with a syntax-highlighted code block, proves its case through a comparison table, and converts visitors with a low-friction free-trial form. The Acid Digital color system and Stats-First layout make the page feel like a live terminal running a model.
Who this template is for
This template is built for teams who live in data and need a landing page that speaks their language before a single marketing sentence appears. It is the right fit for product and growth teams who have tried to explain mix modeling to a board and been met with silence.
- Growth leads at direct-to-consumer brands spending $200,000 or more per month across multiple marketing channels
- Media analysts at agencies who defend budget allocations in quarterly reviews and need channel-level evidence fast
- Chief Marketing Officers who need a board-ready answer to the question of what is actually driving sales
What problem this template solves
Many businesses run marketing campaigns across eight or more channels simultaneously. Yet most measurement tools still rely on last click attribution, which focuses solely on the final customer touchpoint before a conversion and ignores everything that built the intent. That narrow focus leads to misguided marketing strategies and badly misallocated spend.
- Last-click models give more credit to the last touchpoint and zero credit to brand TV, podcast sponsorships, or any upper-funnel channel that shaped the customer journey
- Multi touch attribution (MTA) examines more of the customer journey but depends on user level data that is shrinking fast in a privacy-first environment
- Traditional marketing mix modeling has historically required a six-month consulting cycle and a considerable cost in both time and analyst hours, making it feel inaccessible to most marketing teams
What you get with this template
You get a complete, ready-to-customize landing page that positions a modern mix modeling tool against legacy approaches with confidence and technical clarity. Every section is structured to move a skeptical analyst toward a free trial without requiring them to read a wall of marketing prose.
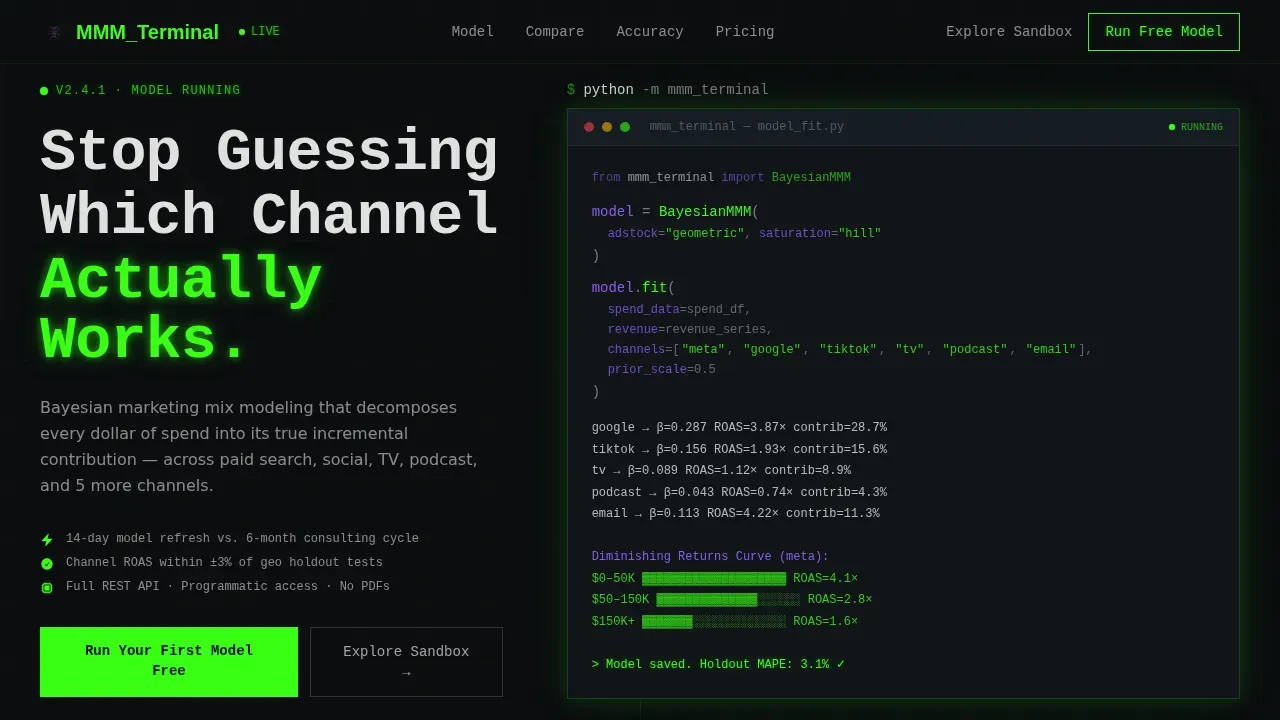
- A hero section featuring an interactive, syntax-highlighted Python code block with a blinking cursor and live channel-coefficient output, proving the tool speaks the analyst's language immediately
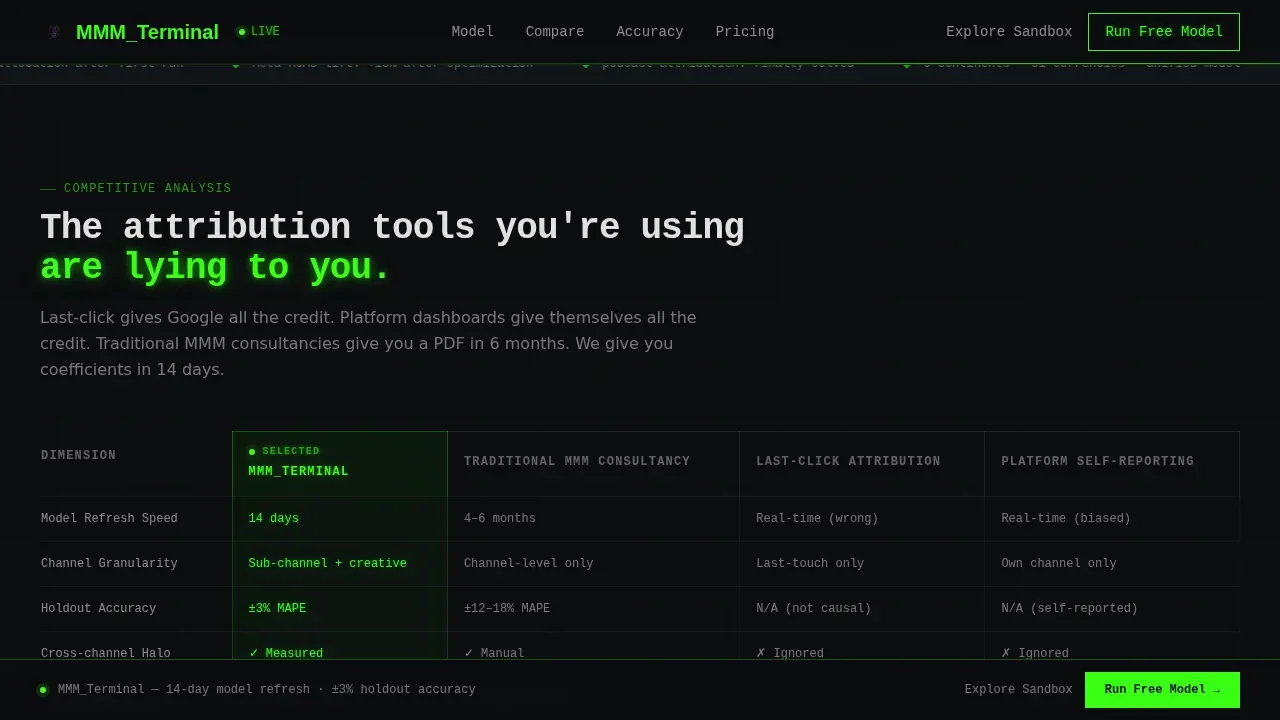
- A mid-page comparison table that pits the tool against traditional MMM consultancies, last-click attribution, and self-reported platform metrics across rows covering refresh speed, channel coverage, granularity, and cost
- A freemium call-to-action section with a single email field, a monthly spend range selector, and a channel count dropdown, plus a secondary path to a no-signup sandbox demo environment
Feature list
This section describes the core built-in components and design features that ship with the template.
Interactive Terminal Hero Block
The hero opens with a realistic, syntax-highlighted code block written in Python. It shows an actual model call using model.fit() with channel arguments for paid search, television, and podcast spend. Visitors can hover individual channel names to see contribution values shift in real time. The blinking cursor and typewriter output animation make the data feel live and credible, establishing technical trust before any marketing copy appears.
Side-by-Side Comparison Table
The comparison table is the structural centerpiece of the page. It evaluates the tool against three legacy approaches: traditional MMM consultancies, last-click attribution, and self-reported platform data. Rows cover model refresh speed, channel coverage, granularity, cost, and privacy compliance. Checkmarks mark available features and neutral indicators mark known weaknesses, so the table accurately reflects real trade-offs rather than hiding them.
Stats-First Accuracy Sections
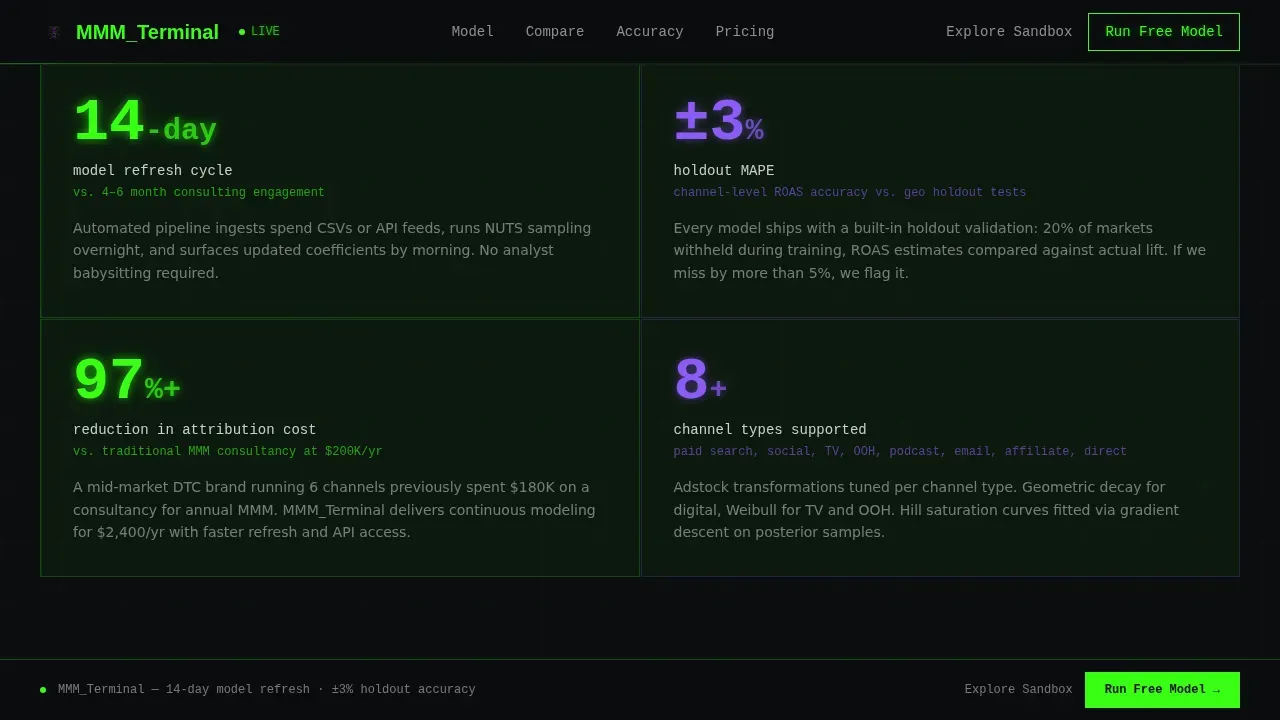
Below the table, each section opens with a single oversized statistic before unpacking the methodology. Examples include a 14-day model refresh versus a six-month consulting cycle, or channel-level return on ad spend within plus or minus three percent of holdout tests. This Stats-First Impact creative direction front-loads credibility and keeps analysts reading through the technical prose that follows.
Freemium Trial Conversion Form
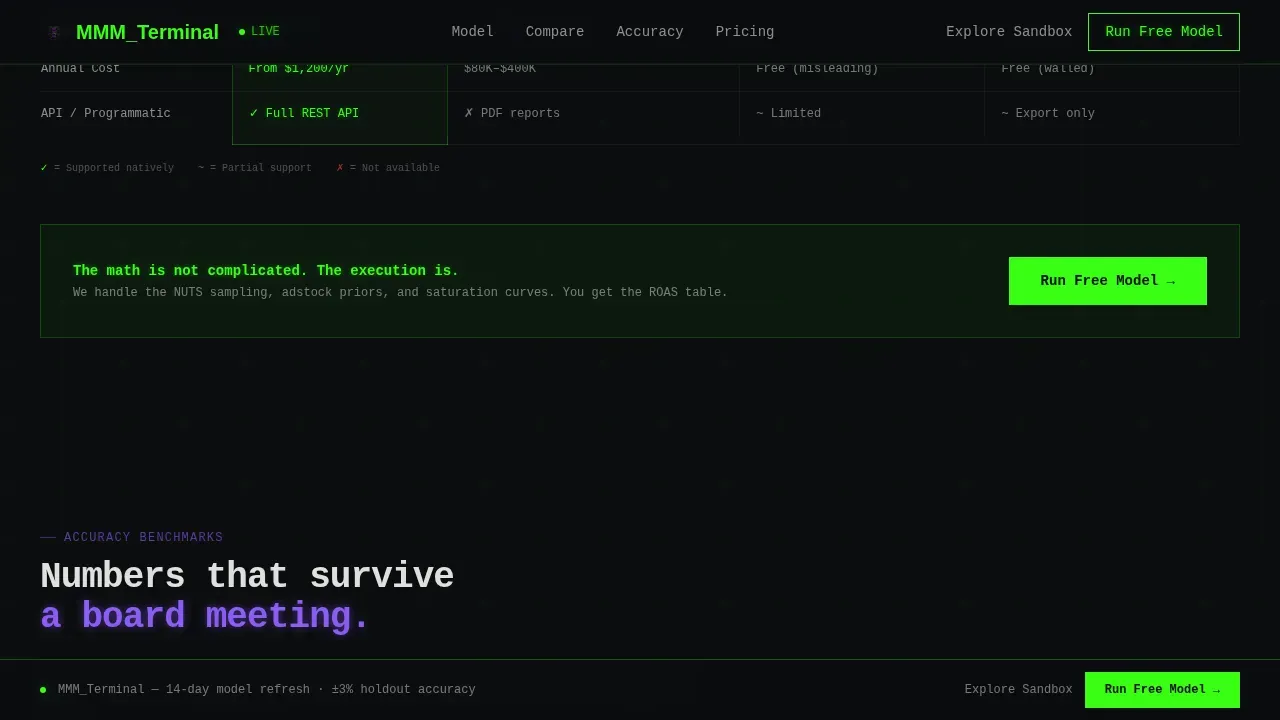
The primary call to action reads "Run Your First Model Free" in phosphor green on void black. The form captures an email address, a monthly spend range (under $50,000, $50,000 to $250,000, $250,000 to $1,000,000, or $1,000,000 and above), and a channel count selection. A persistent bottom bar repeats this call to action on scroll so it is always reachable without requiring the visitor to scroll back to the top.
Sandbox Demo Entry Point
A secondary conversion path labeled "Explore the Sandbox" links to a pre-loaded demo environment filled with synthetic data. No signup is required. This path is designed for skeptical analysts who need to run a model themselves before they trust the platform. It removes the main friction point by letting users touch the terminal before they commit to an account.
Acid Digital Color and Typography System
The template ships with a fully defined visual identity. Void black (#0B0D0F) covers all large surfaces. Phosphor green (#39FF14) marks live numbers, active toggles, and the primary call to action. Electric violet (#8B5CF6) highlights comparison differentiators and chart overlay elements. JetBrains Mono handles all code and data displays, while DM Sans is used for body copy, creating a clear visual separation between signal and explanation.
Page sections overview
| Section | Purpose |
|---|---|
| Hero Terminal Block | Opens with interactive Python code snippet and live channel output animation |
| Comparison Table | Benchmarks tool against last-click, consultancies, and platform self-reporting |
| Stats and Accuracy | Leads each row with an oversized number before unpacking methodology |
| Methodology Breakdown | Explains how the model works and details channel and variable coverage |
| Trial Conversion Form | Captures email, spend range, and channel count for free trial signup |
| Sandbox Demo Link | Provides a no-signup path to a synthetic-data demo environment |
| Persistent call to action Bar | Repeats the free-trial call to action as a fixed bottom bar on scroll |
| Footer Pattern | Delivers the Vercel Horizontal Flow footer layout for navigation and links |
Design & branding system
The visual identity follows the Acid Digital color system, designed to feel like a monitor glowing in a dark room. Large surfaces stay void black so that data and numbers appear to float forward like readings on an instrument panel.
- Void black (#0B0D0F) as the primary background, phosphor green (#39FF14) for active data states and the primary call to action, electric violet (#8B5CF6) for secondary highlights and chart overlay elements, and terminal white (#E0E0E0) for body text
- JetBrains Mono is used for all code blocks, channel labels, and data outputs to reinforce technical credibility; DM Sans handles all body and heading copy for clean readability
- Animations include beam border reveals on scroll, typewriter-style code output in the hero, and a blinking cursor that signals the model is live and ready
Mobile & speed optimization
The template is built desktop-first to match the working environment of analysts and growth leads who review data on large screens. Mobile support is included so the page remains usable for CMOs reviewing on a phone before a board meeting.
- Server components handle all static content for faster initial load, while client components manage the interactive animations, hover states, and persistent call-to-action bar
- The comparison table is structured to scroll horizontally on smaller screens without losing column context, keeping the competitive data readable on any device
- Scroll reveals and animation triggers are scoped to visible viewports, so the page does not run heavy animation work on content that is not yet on screen
How this template helps you convert
The page is structured as a Problem-Agitation-Solution flow that matches how B2B buyers evaluate marketing analytics software. It moves from technical proof to comparative evidence to direct trial signup without requiring a sales conversation.
- The hero code block establishes immediate technical credibility by showing real model syntax and live channel output, so the right audience self-qualifies within seconds of landing on the page
- The comparison table creates clear contrast between the tool and legacy approaches, making the decision to try the free tier feel like the obvious data-driven decision rather than a leap of faith
- The persistent call-to-action bar and the no-signup sandbox path together address both conversion modes: the ready-to-sign-up visitor and the skeptical analyst who needs to run an actual model before they trust the platform
Other information about this template
This template is built specifically for the intersection of advanced analytics tooling and performance marketing, where data-driven decisions happen at the campaign level every day. The sections below cover additional context about how the template fits into the broader marketing mix modeling landscape.
- The Attributix Data Command marketing mix modeling comparison table landing page template is categorized under Technology and Advanced Tech and AI Platforms, making it suitable for teams building modern MarTech analytics products
- Marketing mix modeling is a form of statistical modeling that uses historical data to quantify the incremental sales impact of each channel across the entire marketing mix, including paid search, social, television, email campaign activity, and organic variables
- Unlike last touch attribution or basic last-click models, mix modeling accounts for macroeconomic factors, seasonality, and media variables that influence sales outside the direct customer journey, giving a more complete picture of actual data
- The mmm feed powering the model ingests data from multiple data sources simultaneously, including media data from paid platforms and organic variables from tools such as Google Analytics, making data collection a structured and repeatable process
- MMM models are highly scalable and can handle granular data from various channels, making them a viable approach for many businesses from growth-stage direct-to-consumer brands to large enterprise clients running complex multi-channel marketing campaigns
- A good rule of thumb for teams evaluating mix modeling is to treat historical data depth as a prerequisite: the more time periods and campaign level data points available in the mmm feed, the more accurately the model reflects actual impact
- Statistical modeling at this level requires careful data collection and fine tuning of model variables before the output accurately reflects the actual impact of each marketing channel on revenue
- Google Search and paid media variables play a central role in most models because they generate directly attributable conversions, but the real value of mix modeling is in surfacing the contribution of other channels that last-click models consistently undervalue
- Google Analytics is commonly used alongside mix modeling to supply organic variables and website engagement data points that inform the model's baseline assumptions
- The template is designed for companies of varying sizes: small businesses running focused campaigns across three or four marketing channels can use the sandbox demo to understand the tool's approach, while larger clients managing complex media channels and high spend volumes are the primary focus
- Multi touch attribution (MTA) and marketing mix modeling serve different measurement needs: MTA examines individual touchpoints in the customer journey using user level data, while MMM provides a holistic view of marketing performance using aggregate historical data that is not affected by cookie deprecation or privacy changes
- Data driven attribution sits between these two approaches, offering more credit to contributing touchpoints than last-click models while still relying on observable conversion paths rather than the statistical modeling used in MMM
- Understanding marketing effectiveness across various channels is a crucial role for any marketing team that wants to make data driven decisions about where to allocate the marketing budget next quarter
- The page design supports a best practice for MMM comparison landing pages: transparency first, with actual data and holdout test benchmarks surfaced early so customers understand the methodology before they are asked to sign up
- MMM offers a holistic view that accounts for multiple factors simultaneously, including macroeconomic factors, competitive activity, and media variables that are automatically generated from aggregated spend and revenue inputs, giving the marketing team a complete view of the entire marketing mix
Theme
Data Command
Creative direction
Stats-First Impact
Color system
Acid Digital
Style
Comparison Table
Direction
Freemium/Trial
Page Sections
Interactive Python Hero Code Block
Head-to-head Comparison Table
Stats-first Accuracy Sections
Freemium Trial Conversion Form
No-signup Sandbox Demo Path
Acid Digital Visual Identity System
Related questions
What is marketing mix modeling and how does it differ from last-click attribution?
Who is this landing page template designed for?
What legacy approaches does the comparison table cover?
Can small businesses use a marketing mix modeling tool positioned this way?
What does the free trial form collect and why?



