Cloud Architecture Landing Page Template
Provision is a cloud architecture landing page template built for engineering-led platforms. It combines a live cost estimator header, a modular card grid packed with data-driven insights, and a freemium conversion flow. Dark Dashboard Pro styling and teal signal accents make every metric pop. Built for DevOps leads, platform engineers, and CTOs who need clarity fast.
by Rocket studio
Quick summary
Provision is a single-page, card grid landing page template designed for cloud architecture platforms. It opens with an interactive cost and latency estimator, then walks visitors through a data-card grid that mirrors an industry report. The Midnight Blue color system feels like a network operations center at midnight, and every call to action drives toward a freemium or trial signup.
Who this template is for
This template is built for teams that sell cloud infrastructure tools to technical buyers. It speaks directly to the engineers and leaders who make platform decisions.
- DevOps leads inheriting complex Terraform configurations at fast-growing startups
- Platform engineers managing enterprise migrations away from monolithic architectures
- CTOs who need to communicate cloud spending clearly to boards and stakeholders
What problem this template solves
Engineering-focused platforms often struggle to convert technical visitors. Generic hero images and vague benefit copy do not resonate with someone staring at a broken deployment at 2 a.m. This template replaces abstraction with immediate, personal relevance.
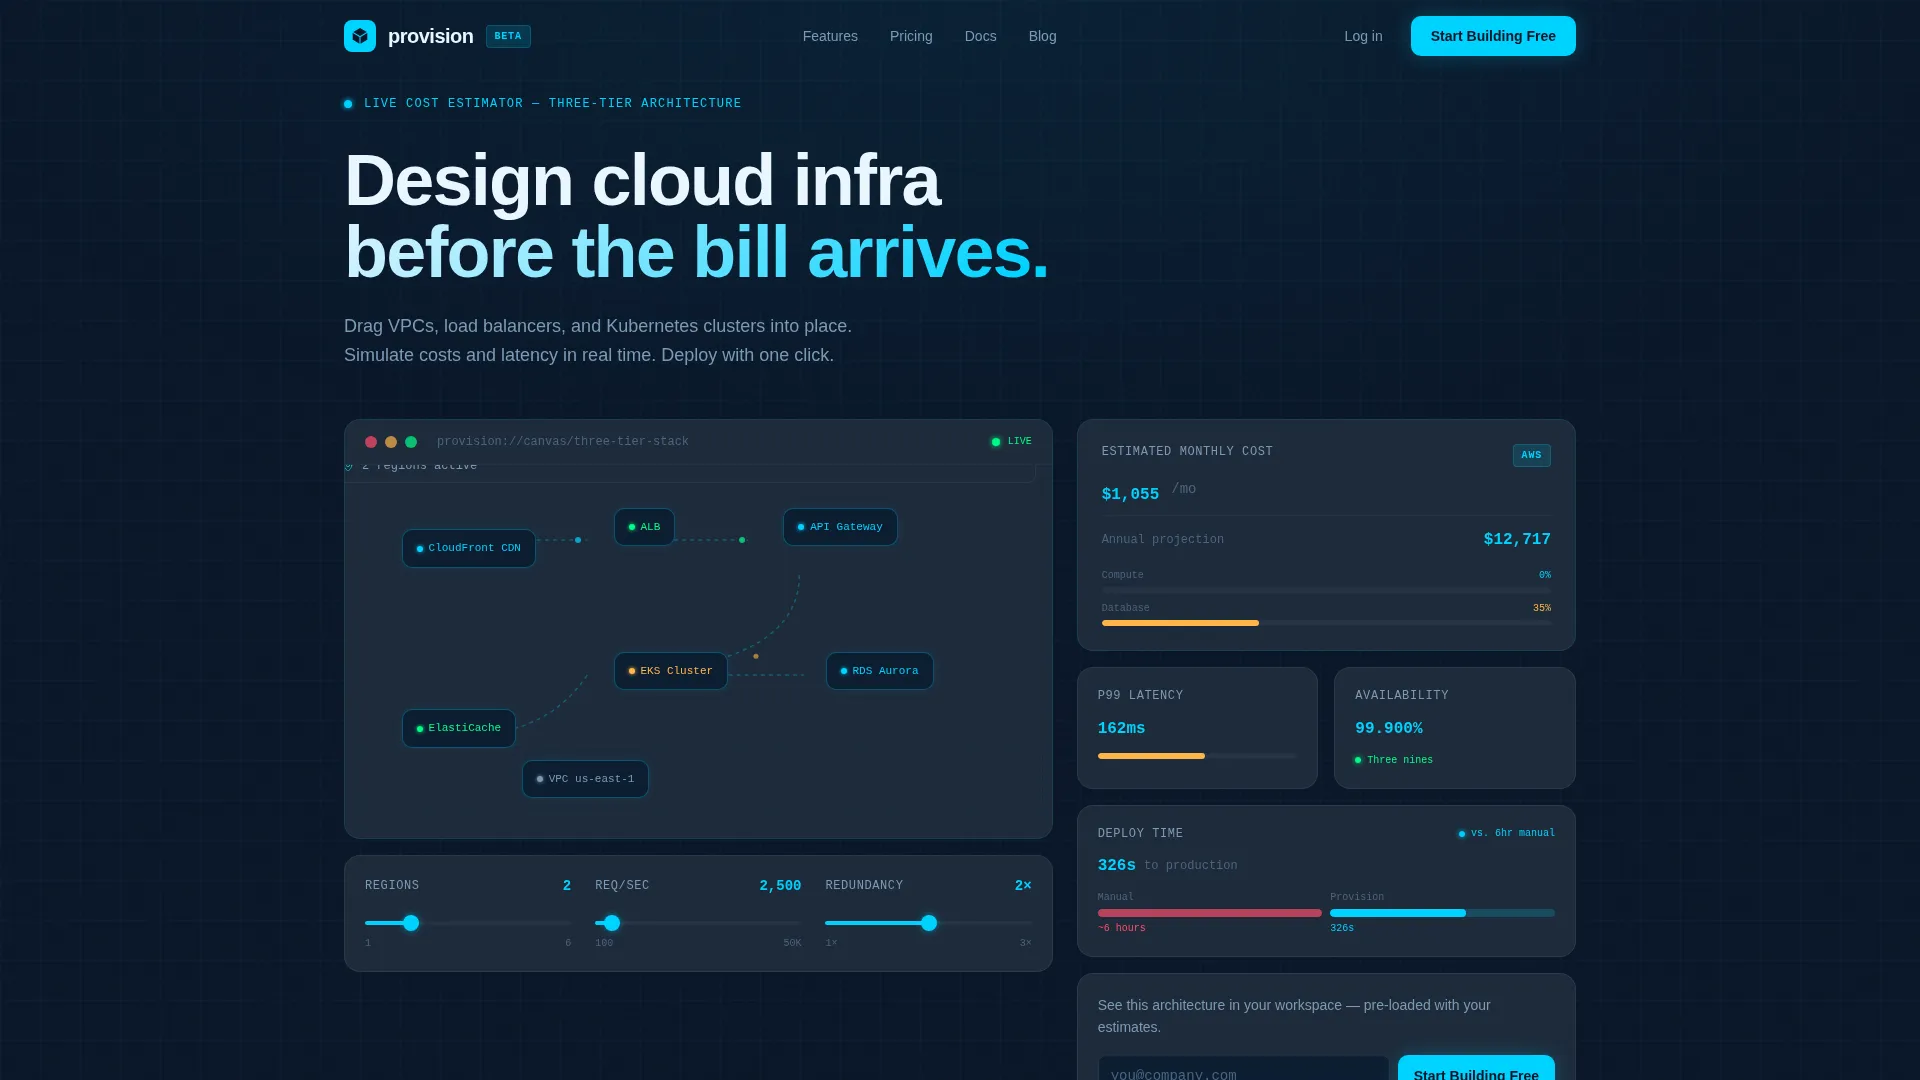
- Visitors get live cost and latency numbers before they even read a headline
- Data cards frame every claim with a specific stat, removing doubt and building trust
- The conversion path is frictionless, asking only for a work email to enter a sandbox
What you get with this template
The template is a fully structured landing page with distinct, self-contained sections that build cumulative urgency. Every block serves a defined role in the buyer journey.
- A live calculator header with sliders for region count, requests per second, and redundancy level
- A responsive card grid that presents discrete findings, each pairing a stat with a micro-visualization
- Two conversion paths: a primary freemium trial and a secondary gated content download
Feature list
This template is built around a handful of high-impact components that do the selling before the visitor reaches the bottom of the page.
Live Architecture Cost Estimator
The header contains a pre-loaded three-tier stack showing a content delivery network leading to an API gateway and then a managed database. Sliders let visitors adjust region count, requests per second, and redundancy level. A cost estimate and latency projection update in real time, making the numbers feel alive like a trading terminal.
Data-Driven Insight Card Grid
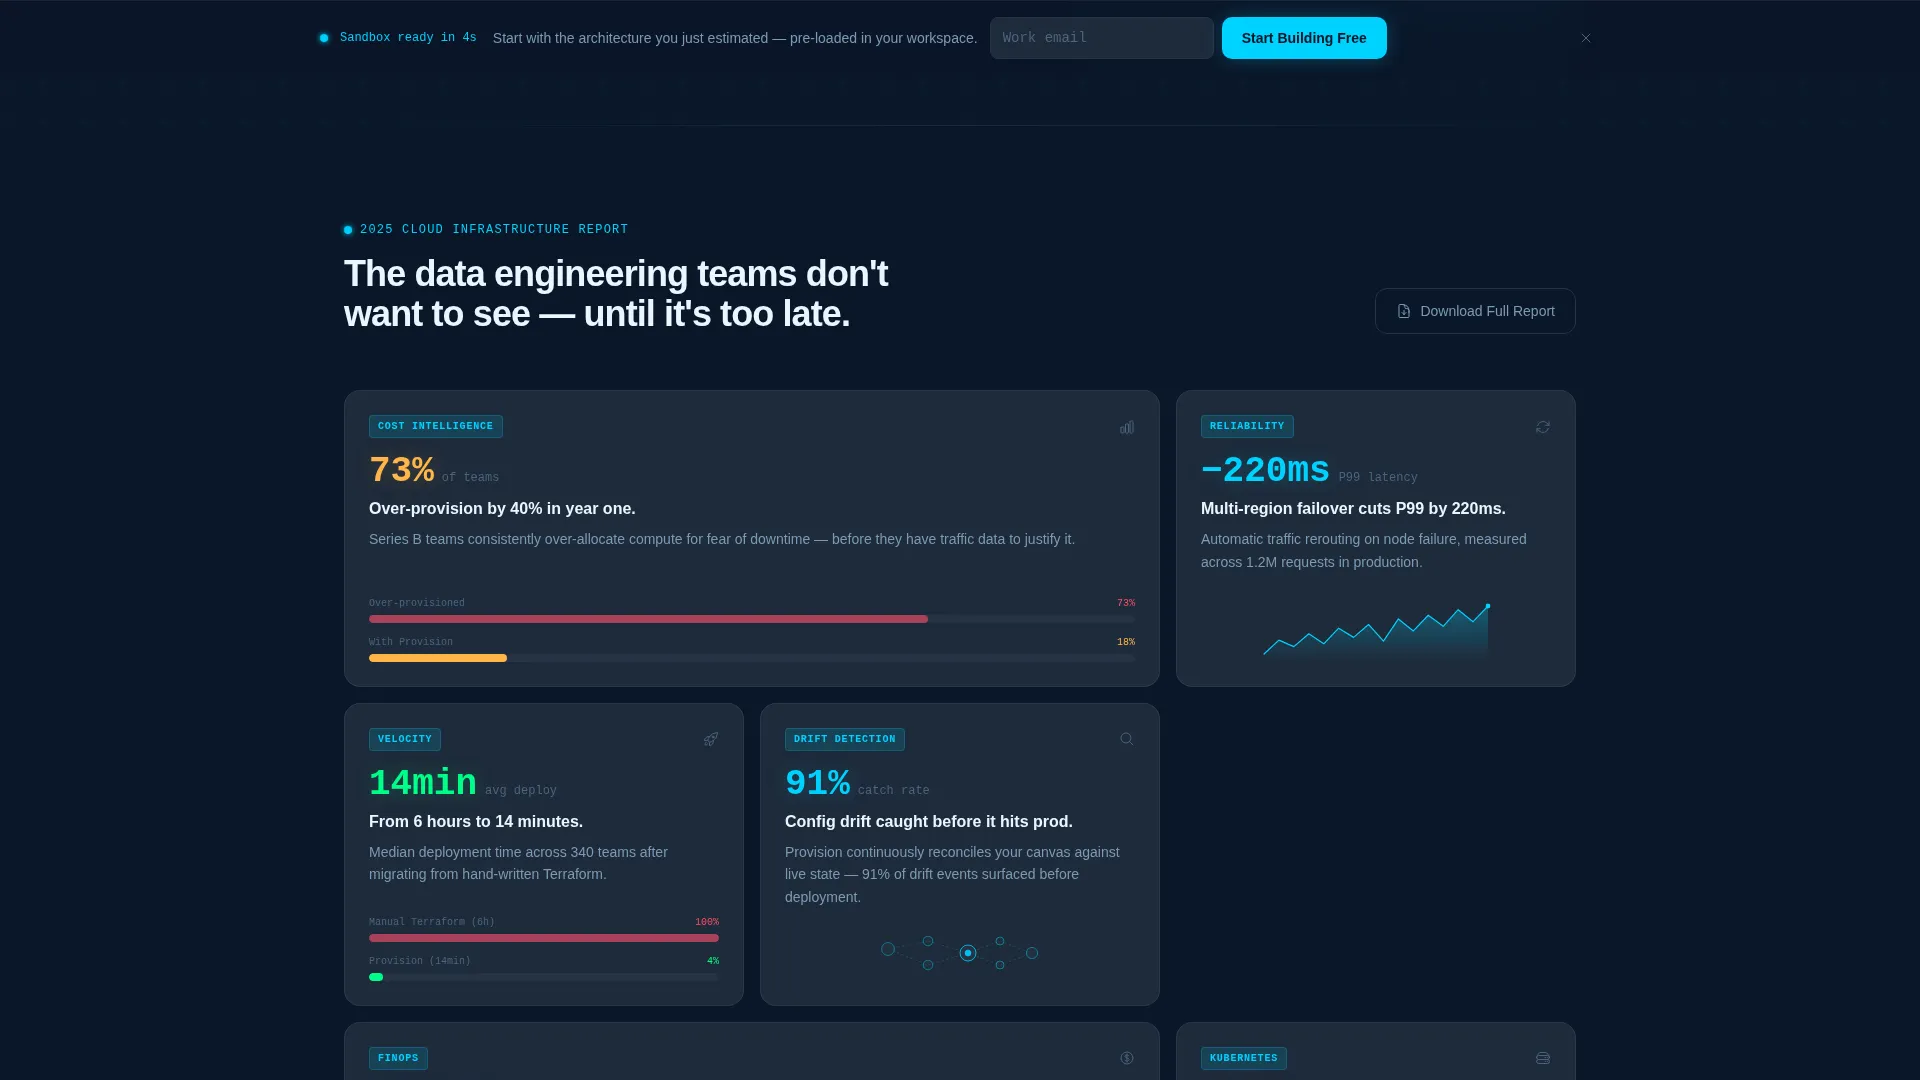
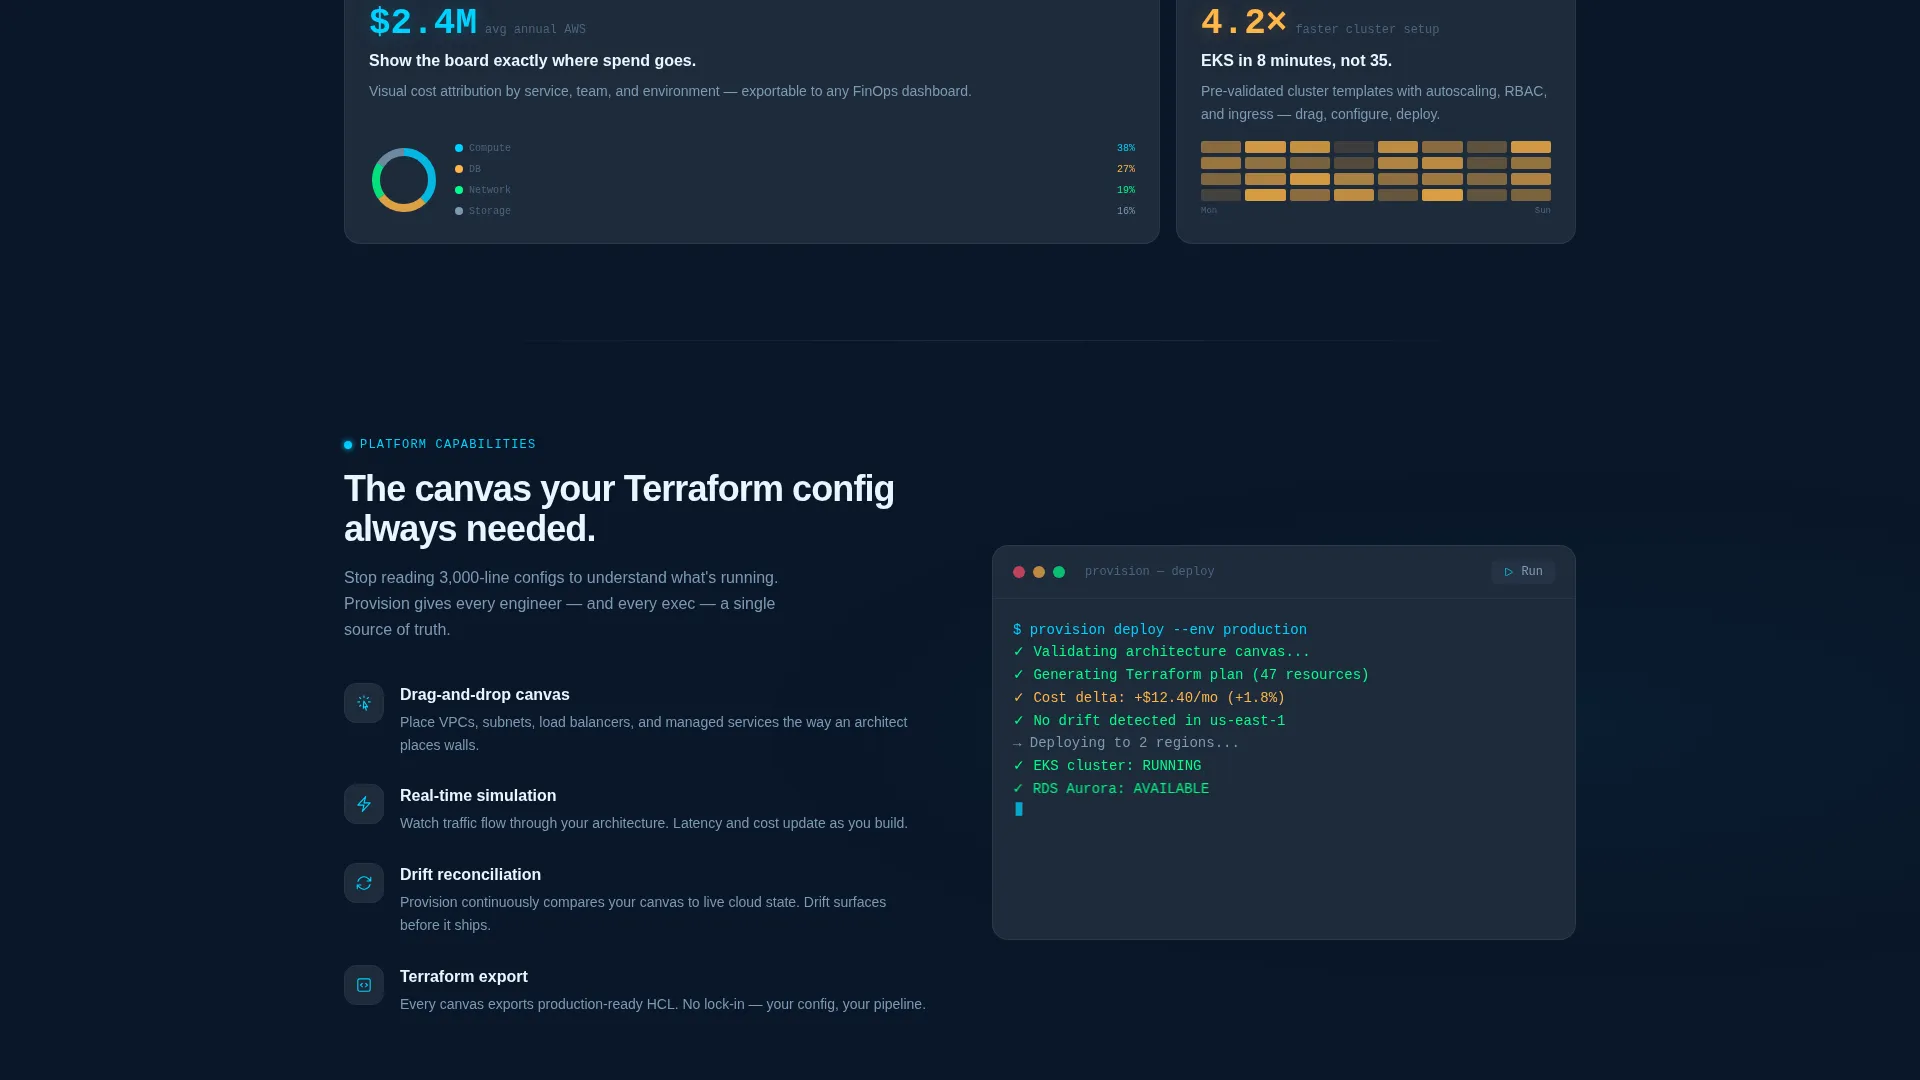
Cards are arranged three across on desktop and stack vertically on mobile. Each card presents one discrete finding paired with a micro-visualization such as a spark chart, a before/after bar, or a dependency graph thumbnail. The cadence mirrors an industry report, building specificity and urgency with every scroll.
Dual Conversion Path Layout
The primary call to action, "Start Building Free," appears inside the estimator header and again as a sticky bottom bar after the third card row. A secondary path, "Download the 2025 Cloud Cost Report," captures leads who are not yet ready to build, gating the report behind work email and company size.
Sandbox Onboarding Flow
After signup, the user lands in a pre-built sandbox environment that mirrors the architecture they configured in the estimator. This instant continuity reduces friction and ties the signup moment to a concrete, personal starting point.
Midnight Blue Dashboard Styling
The visual identity uses a deep command-line navy base with active-node teal accents, muted satellite gray card surfaces, and alert white typography. Teal accents pulse on hover states and live data points, keeping the interface readable during extended sessions.
Page sections overview
| Section | Purpose |
|---|---|
| Estimator Header | Live cost and latency calculator preloaded with a three-tier stack |
| Primary call to action Block | "Start Building Free" trigger inside the estimator |
| Data Card Row 1 | First set of insight cards with stat and micro-visualization pairs |
| Data Card Row 2 | Second card row continuing the industry report cadence |
| Data Card Row 3 | Third card row completing the data narrative arc |
| Sticky call to action Bar | Persistent "Start Building Free" bar appearing after card row three |
| Secondary Lead Gate | "Download the 2025 Cloud Cost Report" email capture form |
Design & branding system
The template follows a Dashboard Pro theme with a Midnight Blue color system. The palette is built for long reading sessions in low-light environments, where signal clarity matters more than decorative detail.
- Core colors: deep navy (#0A1628) for the base, teal (#00D2FF) for active accents, satellite gray (#1E2A3A) for card fills, and alert white (#EAF6FF) for all body text
- Teal pulses on hover states and live data indicators, providing immediate visual feedback without animation overload
- No stock photography or illustration appears anywhere; the product interface and data visualizations are the entire visual story
Mobile & speed optimization
The card grid is designed to reflow gracefully from a three-column desktop layout to a fully stacked single-column mobile view. Each card is self-contained, so the reading experience holds at any screen width.
- Cards rearrange responsively, preserving stat-plus-visualization pairs at every breakpoint
- The sticky conversion bar adapts to mobile viewports, keeping the primary call to action reachable without scrolling back to the top
- Typography in alert white against dark card surfaces maintains strong contrast at small sizes without any extra visual treatment
How this template helps you convert
The page is structured so the estimator creates personal relevance before any marketing copy asks for commitment. Every subsequent section deepens that relevance rather than repeating it.
- The live estimator hook creates an immediate, personal stake by showing real cost and latency numbers tied to the visitor's own stack choices, making the signup feel like a natural next step.
- The industry report card cadence builds cumulative trust, each data point narrowing from broad industry stats to specifics that feel directly relevant to the visitor's role and stack.
- The two-path conversion model ensures that visitors who are not ready to sign up still leave a lead by downloading the gated report, keeping them in the funnel without pressure.
Other information about this template
This template is built as a single landing page using a modular card grid structure. It is well suited for cloud architecture platform launches, feature announcement pages, and conference lead capture pages in the infrastructure or DevOps space.
- The template style is Card Grid (Modular), making it straightforward to add or remove card rows as the product's data story evolves
- The creative direction follows an Industry Report cadence, giving the page a credible, research-backed tone that resonates with technical and executive buyers alike
- The freemium and trial conversion direction makes this template a strong fit for product-led growth motions where the product experience is the primary selling argument
Theme
Dashboard Pro
Creative direction
Industry Report
Color system
Midnight Blue
Style
Card Grid (Modular)
Direction
Freemium/Trial
Page Sections
Live Cost and Latency Estimator
Modular Insight Card Grid
Dual Conversion Path Design
Sticky Conversion Bar
Midnight Blue Visual System
Related questions
Can I customize the estimator sliders for my own pricing model?
Do I need to supply my own data for the insight cards?
How many card rows does the template include by default?
Is the secondary lead capture form independent from the primary signup?
What screen sizes does the card grid support?



