Cloud & DevOps Specialist Professional Website Template
Provision is a bold, brutalist landing page template built for cloud hosting and Infrastructure as a Service providers. It leads with a full-viewport metrics wall, data-driven anchor sections, and a friction-reducing CLI install flow. Designed for DevOps engineers and technical buyers, it earns trust through verifiable benchmarks before it ever asks for the download.
by Rocket studio
Quick summary
Provision is a single-page, hub-and-spoke landing page template for Infrastructure as a Service platforms. It opens with a live-stat header, moves through anchored data chapters covering latency, cost, uptime, and global topology, then closes with a terminal-style CLI call to action. Every design decision targets the technical buyer who reads receipts before reaching for a button.
Who this template is for
This template is built for teams and founders who sell infrastructure to people who know exactly what they are buying. The tone, structure, and visual weight all assume a technically fluent reader.
- DevOps engineers and platform teams launching cloud or bare-metal hosting services
- Startup founders and CTOs communicating infrastructure value to developer audiences
- Agency and product leads who need a credible, data-forward landing page for a cloud hosting product
What problem this template solves
Most landing pages for cloud infrastructure feel like marketing brochures dropped on the wrong audience. Engineers distrust fluffy copy. They want numbers, comparisons, and proof. This template skips the soft sell entirely.
- Generic hero sections and stock visuals fail to build credibility with technical decision-makers
- Scattered page structures bury the benchmarks and pricing data that engineers actually need
- Weak calls to action with no in-page install flow create unnecessary friction before the first deploy
What you get with this template
You get a fully structured, single-page landing page organized around anchored navigation sections. Each section is a self-contained data chapter that builds toward the CLI download call to action.
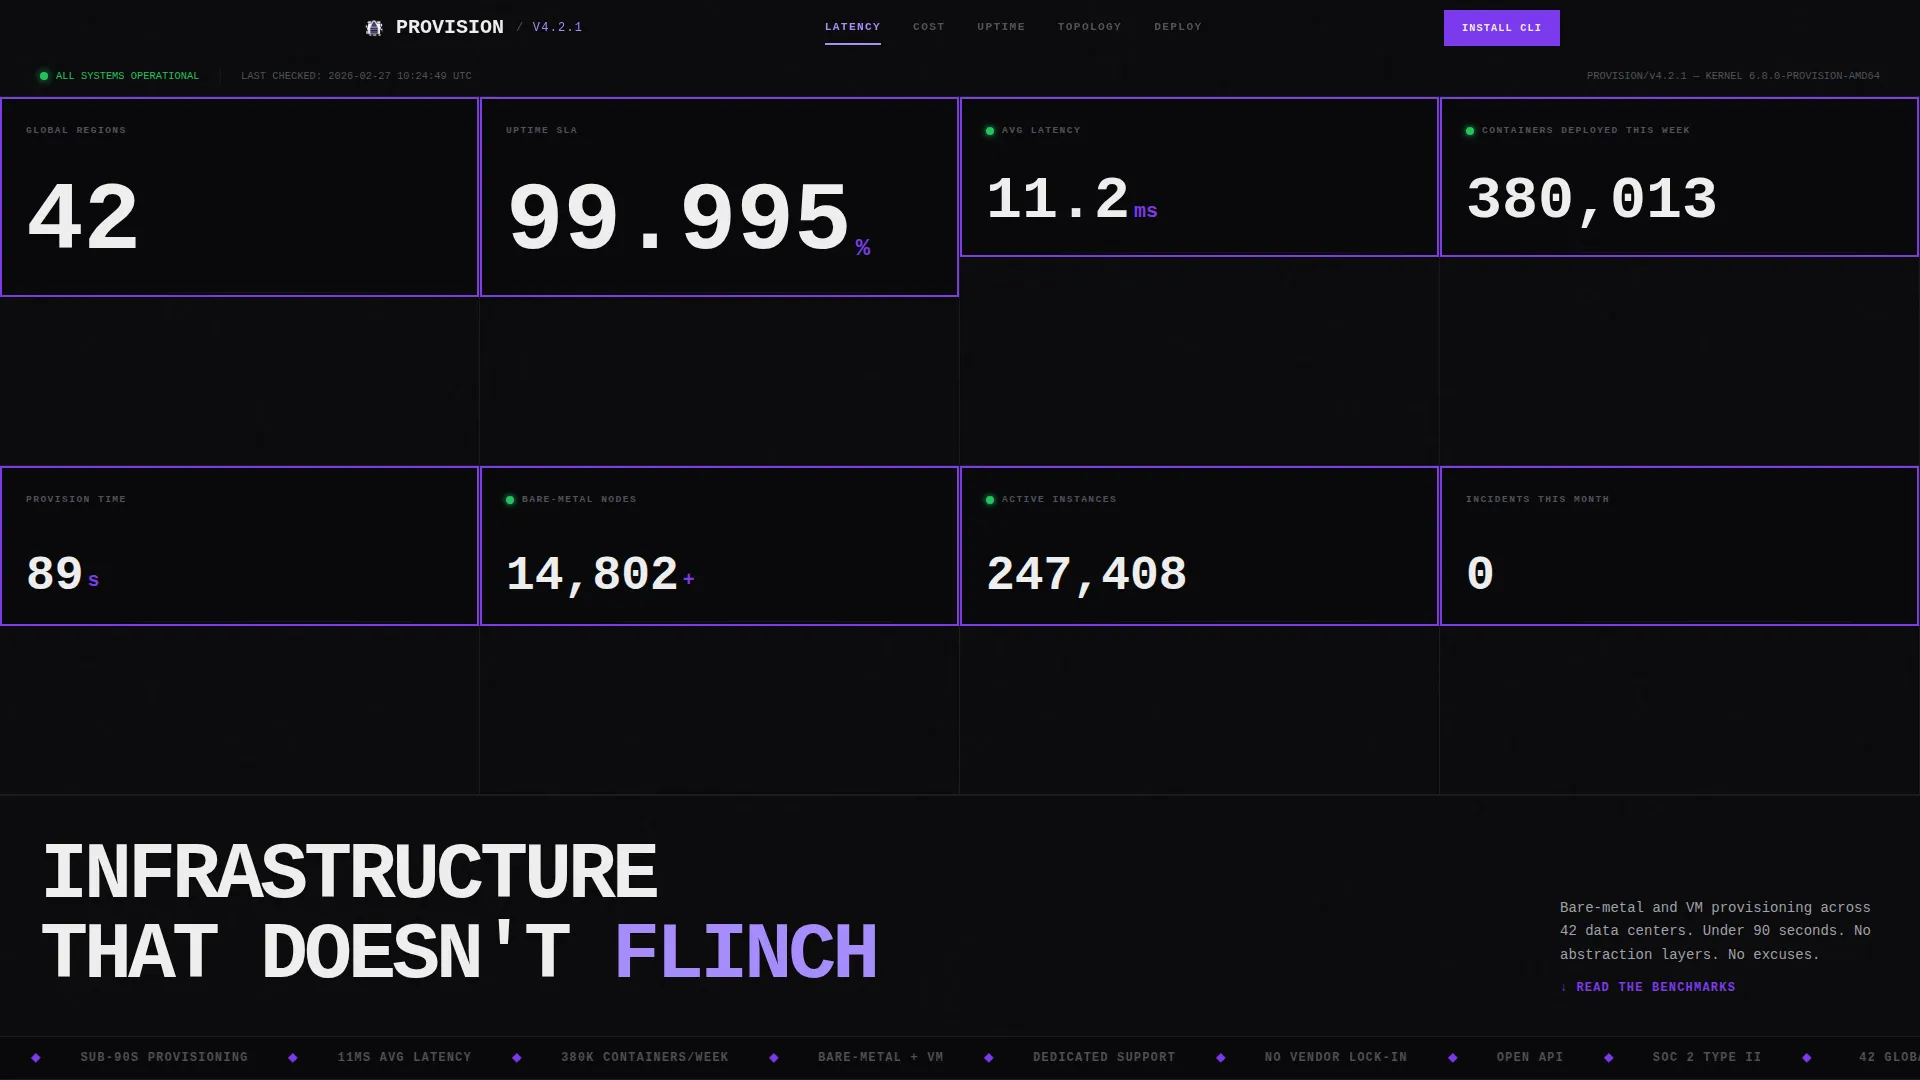
- A full-viewport brutalist stats header with six live-updating metric blocks in a bordered grid
- Four anchor-linked data sections covering latency benchmarks, cost analysis, uptime forensics, and global topology
- A terminal-style call-to-action block with a copyable install command, primary download button, and a secondary free-instance path
Feature list
This template packs specific, purposeful components into a single scroll. Each one is designed around what an infrastructure buyer actually wants to see.
Live Metrics Header Wall
The header fills the entire viewport with a brutalist grid of real-time numbers. Metrics like regions, uptime percentage, average latency, and containers deployed pulse faintly as values tick upward. A single 72-pixel headline anchors bottom-left in full caps. There is no hero image and no illustration because the numbers are the visual.
Anchor Navigation Hub
A sticky navigation bar links to each data chapter on the page. Users can jump directly to Latency Benchmarks, Cost Analysis, Uptime Forensics, or Global Topology without scrolling. Active anchor states render in reactor-glow violet to show exactly where the reader is on the page.
Latency Benchmarks Section
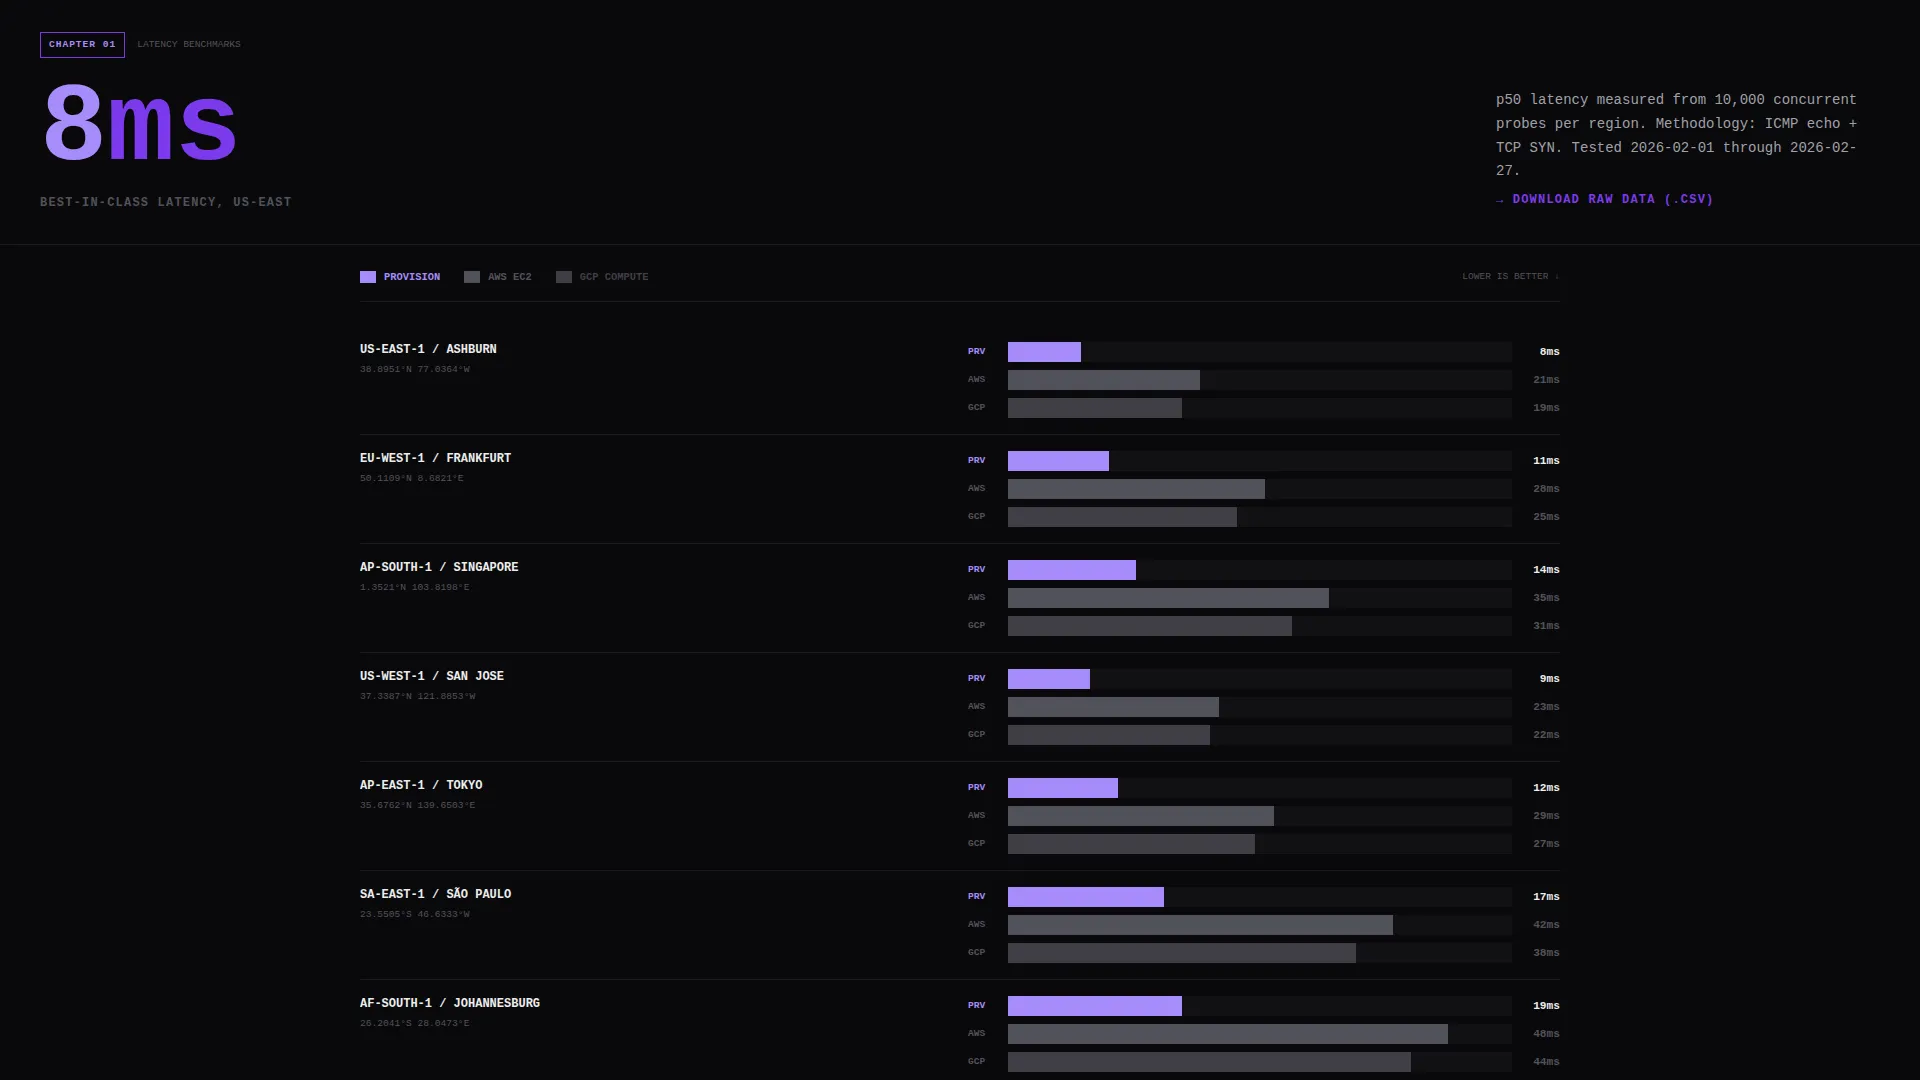
This section renders comparative bar charts showing latency performance against competing cloud providers. Charts are drawn in raw violet blocks with no decorative styling. The section opens with a single oversized statistic before the supporting evidence unfolds beneath it.
Brutalist Pricing Table
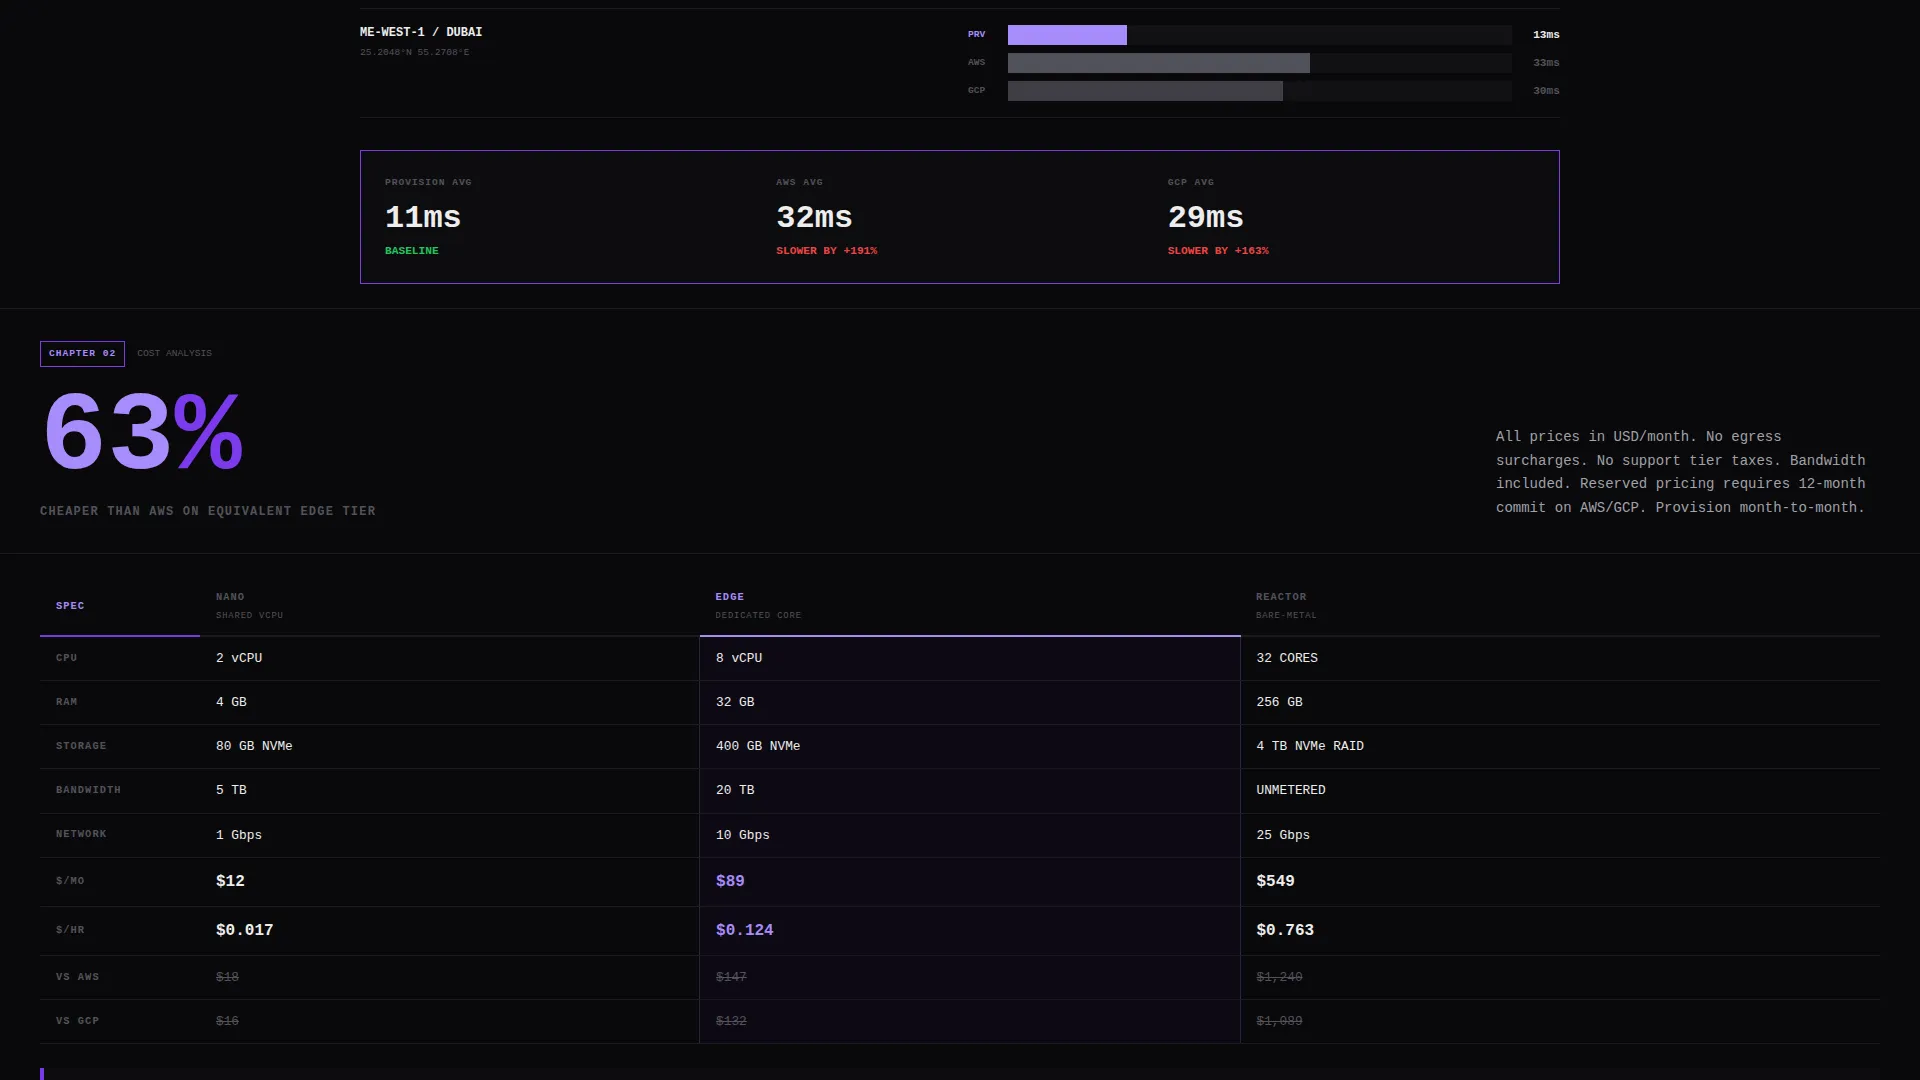
The Cost Analysis section presents pricing in a sharp-cornered grid with no rounded corners, no friendly icons, and no visual softening. Numbers sit in clean rows and columns. Startup CTOs watching burn rates can read the full cost picture at a glance.
Uptime Forensics Timeline
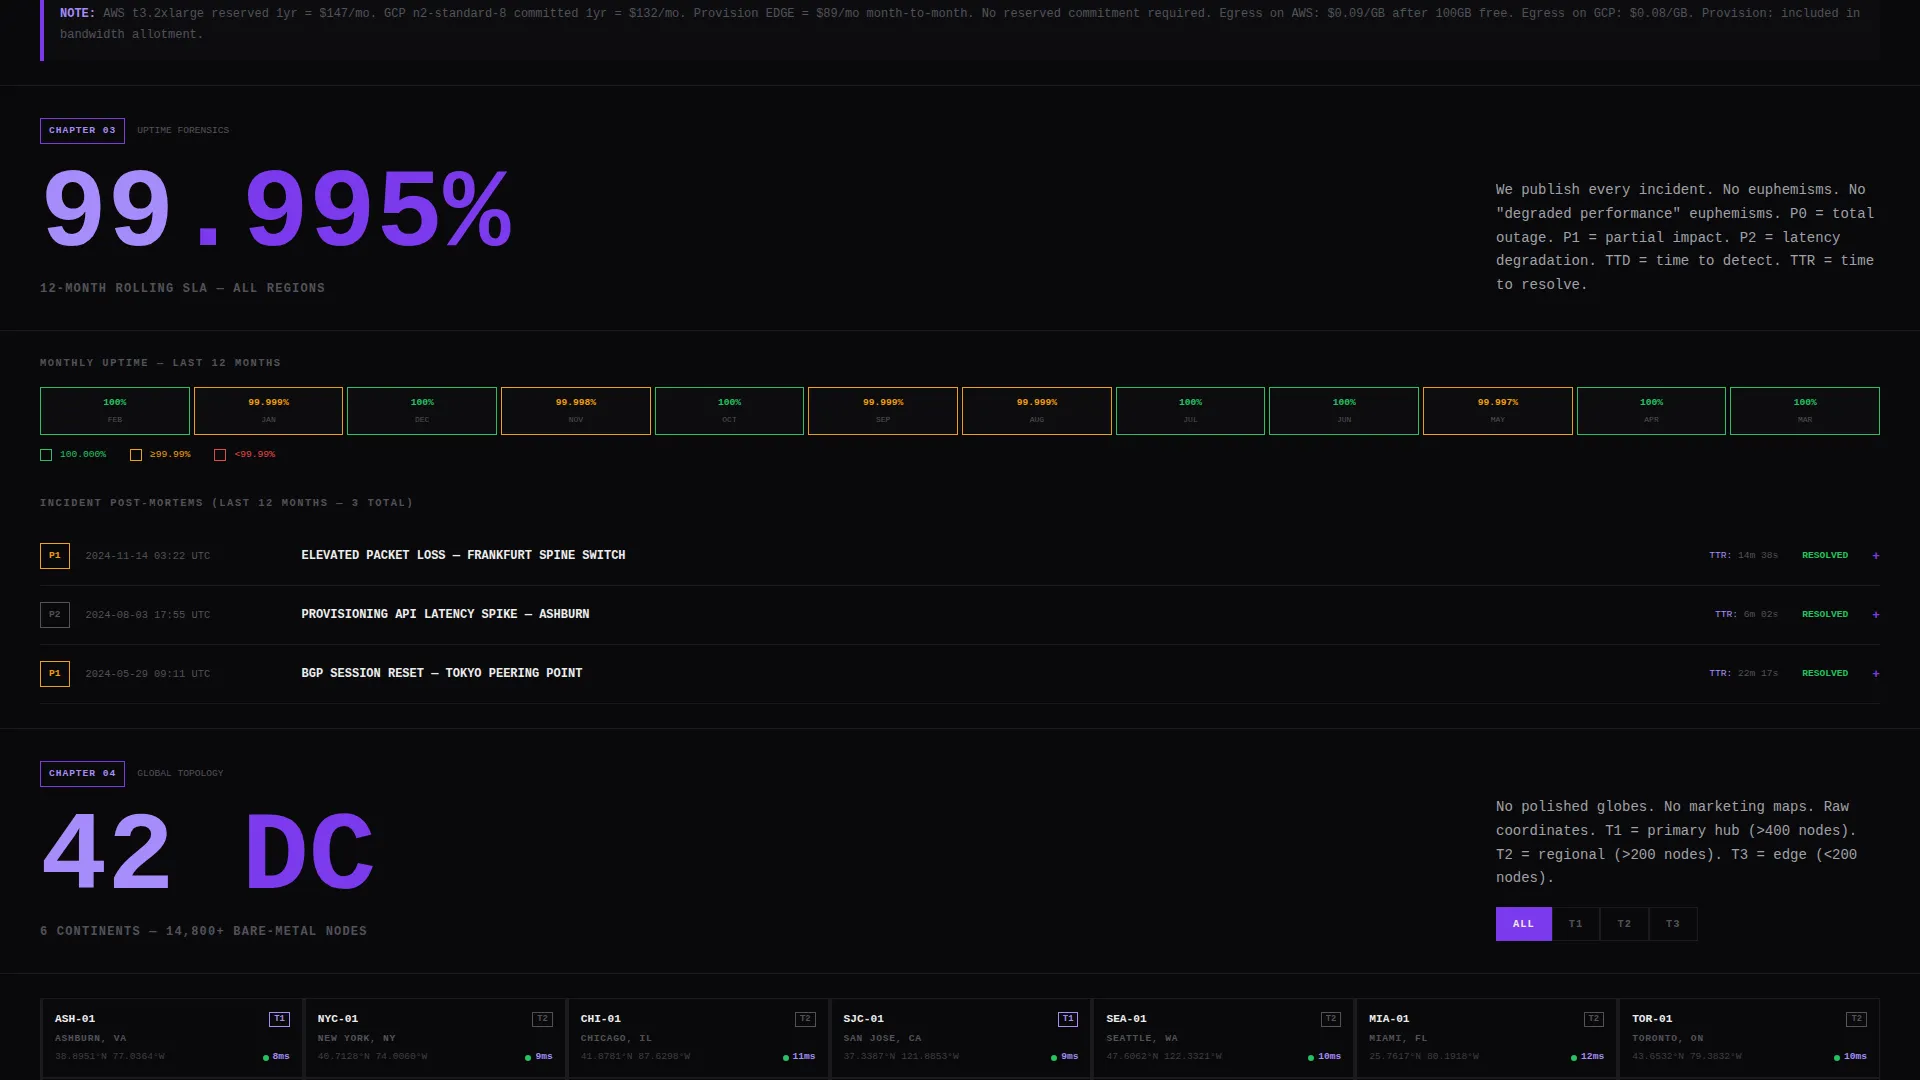
The Uptime Forensics section breaks down incident response using a real post-mortem timeline format. It shows what happened, when it happened, and how fast recovery occurred. Engineers reviewing service reliability get structured, dated evidence rather than a vague uptime badge.
Terminal-Style call to action Block
The call-to-action block displays the CLI install command in a copyable terminal snippet directly above the primary button. The primary action reads "Install the CLI" and a secondary button reads "Download the Dashboard." A third path offers "Deploy Your First Instance Free" linking to a browser-based console preview.
Page sections overview
| Section | Purpose |
|---|---|
| Stats Metrics Header | Opens with a full-viewport live-data grid and the primary brand headline |
| Anchor Navigation Bar | Sticky hub nav linking to each anchored data chapter |
| Latency Benchmarks | Comparative bar charts showing speed against rival cloud providers |
| Cost Analysis Table | Brutalist pricing grid for direct cost comparison |
| Uptime Forensics | Post-mortem incident timeline showing reliability evidence |
| Global Topology Map | Data center locations rendered as coordinate pairs |
| CLI Install call to action | Terminal snippet with primary and secondary download actions |
Design & branding system
The visual identity follows a Bold Brutalist theme built entirely around the Void and Violet color system. Backgrounds stay absolute void black with no gradients. Type is oversized terminal white in monospaced stacks, and violet appears only where interaction lives.
- Color palette: void black (#09090B), deep ultraviolet (#7C3AED), reactor-glow violet (#A78BFA), and raw terminal white (#EDEDED)
- Typography: monospaced stacks at oversized weights; the header headline renders at 72 pixels in full caps
- Borders and spacing: 2-pixel violet borders on all metric blocks, sharp corners throughout, and structural whitespace with no decorative padding
Mobile & speed optimization
The template is structured for fast, readable rendering on smaller screens without sacrificing the dense data presentation that makes it credible on desktop.
- The brutalist grid layout scales across viewport sizes while keeping metric blocks legible and properly bordered
- Anchor navigation collapses cleanly so mobile users can still jump between data chapters without losing their place
- The terminal call to action block and copyable install command remain accessible and tappable at mobile widths
How this template helps you convert
This template earns the download before it asks for it. Every section adds a layer of proof that moves technical buyers closer to action.
- The stats header front-loads credibility. Engineers see verified numbers immediately, before any marketing copy appears, which sets a tone of transparency and competence.
- The data chapters build a cumulative case. Latency charts, cost grids, and the uptime timeline stack evidence progressively so that by the time readers reach the call to action block, they have already evaluated the product on their own terms.
- The terminal call to action removes friction at the exact moment of decision. The install command sits in a copyable snippet one paste away from a live deploy, making the action feel technical and immediate rather than sales-driven.
Other information about this template
This template is part of a broader hub-and-spoke landing page system designed for the Cloud and DevOps category. A few additional details worth noting before you use it.
- The template style is classified as Hub and Spoke with Anchor Navigation, meaning each section is a self-contained spoke reachable from the sticky hub nav at the top
- The creative direction follows an Industry Report format, treating each scroll section as a data chapter in a published technical document rather than a marketing flow
- The header concept is a Stats and Metrics wall, a deliberate departure from image-led hero sections common in general-purpose landing page templates
- The primary call-to-action direction targets app and CLI downloads, making this template a strong fit for developer tools, infrastructure platforms, and self-hosted software products
- This template is built in the Cloud Hosting and Infrastructure as a Service niche under the Technology category and is suitable for platforms offering bare-metal servers, virtual machines, or managed cloud environments
Theme
Bold Brutalist
Creative direction
Industry Report
Color system
Void & Violet
Style
Hub & Spoke (Anchor Nav)
Direction
App Download
Page Sections
Live Metrics Header Wall
Sticky Anchor Navigation
Comparative Latency Benchmarks
Brutalist Pricing Table
Uptime Forensics Timeline
Terminal-style Call to Action Block
Related questions
Who is the ideal user for this template?
Can I customize the live metrics and benchmark data?
Does the terminal call to action block require a real CLI tool?
Is this template suitable for a single-page layout or a multi-page site?
Can I adapt the color system to match a different brand palette?



