Micro-SaaS & Developer Tools Professional Website Template
Pulse is a dark-themed, split-screen landing page template built for uptime monitoring services. It combines a cockpit-style visual identity with Stats-First Impact layout, animated sonar pings, live counters, and a frictionless inline signup flow. Solo founders, DevOps leads, and indie hackers get a conversion-ready page that proves reliability before asking for a single click.
by Rocket studio
Quick summary
Pulse is a single-page, split-screen (50/50) landing page template designed for uptime monitoring services. Built on a dark terminal aesthetic, it pairs oversized performance metrics with interactive user interface mockups in every section. The template uses animated sonar pings, a live check counter, and a one-field inline signup to turn website visitors into active users fast.
Who this template is for
This template is built for teams and individuals who need to communicate website uptime and reliability at a glance. It fits products where speed, availability, and instant alerts are the core selling points.
- Solo SaaS founders who need a conversion-ready page without a design team
- DevOps leads managing monitoring across multiple services and endpoints
- Indie hackers launching a monitoring tool or monitoring platform and need immediate credibility
What problem this template solves
Downtime costs real money. If performance issues go unnoticed, website visitors leave, customers churn, and reputation takes a hit. Most landing pages for monitoring solutions bury the proof under generic copy. Pulse leads with the numbers instead.
- Visitors often need to see proof of reliability before they trust a monitoring service
- Founders lose conversions when signup flows require credit cards or team-size questions
- DevOps buyers scroll past pages that show features before they show outcomes
What you get with this template
Pulse delivers a complete, single-page layout with a structured section flow, dark-cockpit visual design, and conversion-focused copy blocks. Every section is built to reduce friction and build trust with the right audience.
- A dark full-bleed hero with an animated sonar ping ripple, live check counter, and fade-in headline
- Split-screen stat panels pairing oversized uptime and response time metrics with feature user interface mockups
- An inline freemium signup block and a secondary live demo path requiring only one URL input
Feature list
Each feature below is drawn directly from the template brief and reflects what is visually built into the page layout.
Animated Sonar Hero with Live Counter
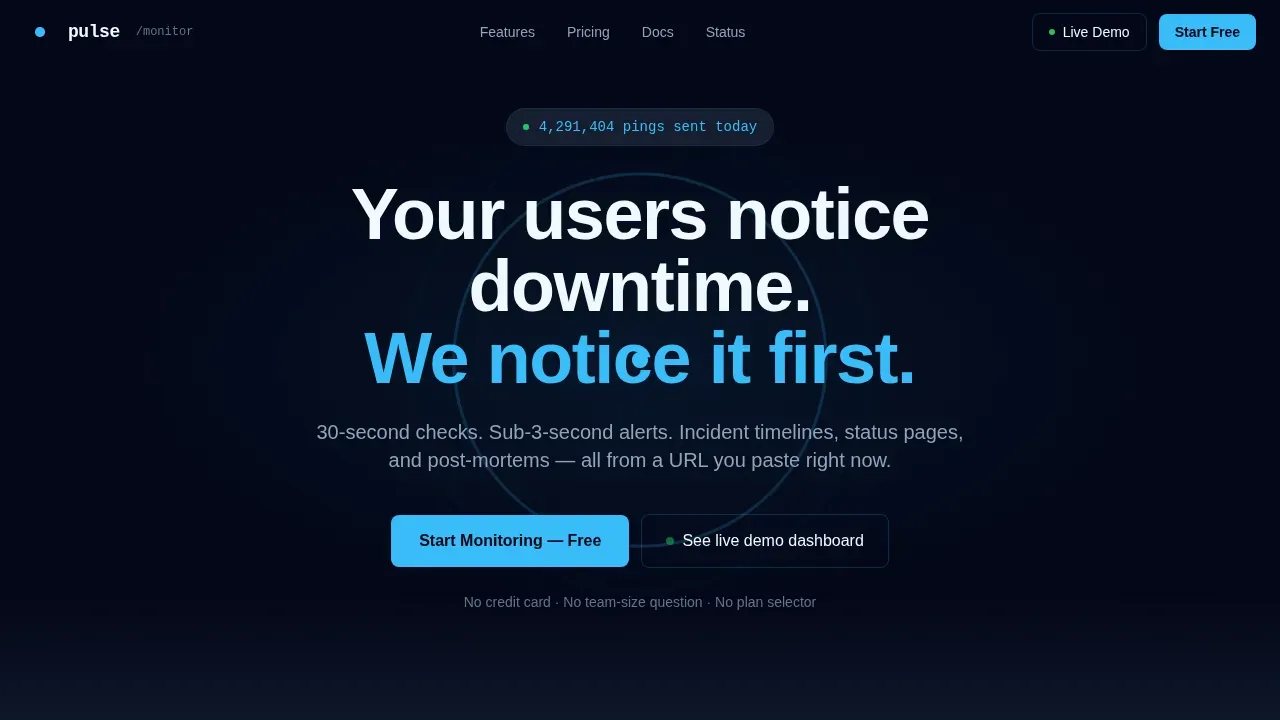
The hero section fills the full viewport with a black background and a soft radial glow. A sky-blue sonar ping ripple expands outward in real time while a tick-up counter displays confirmed checks sent today. The headline fades in over the animation, setting tone immediately.
Stats-First Split Screen Layout
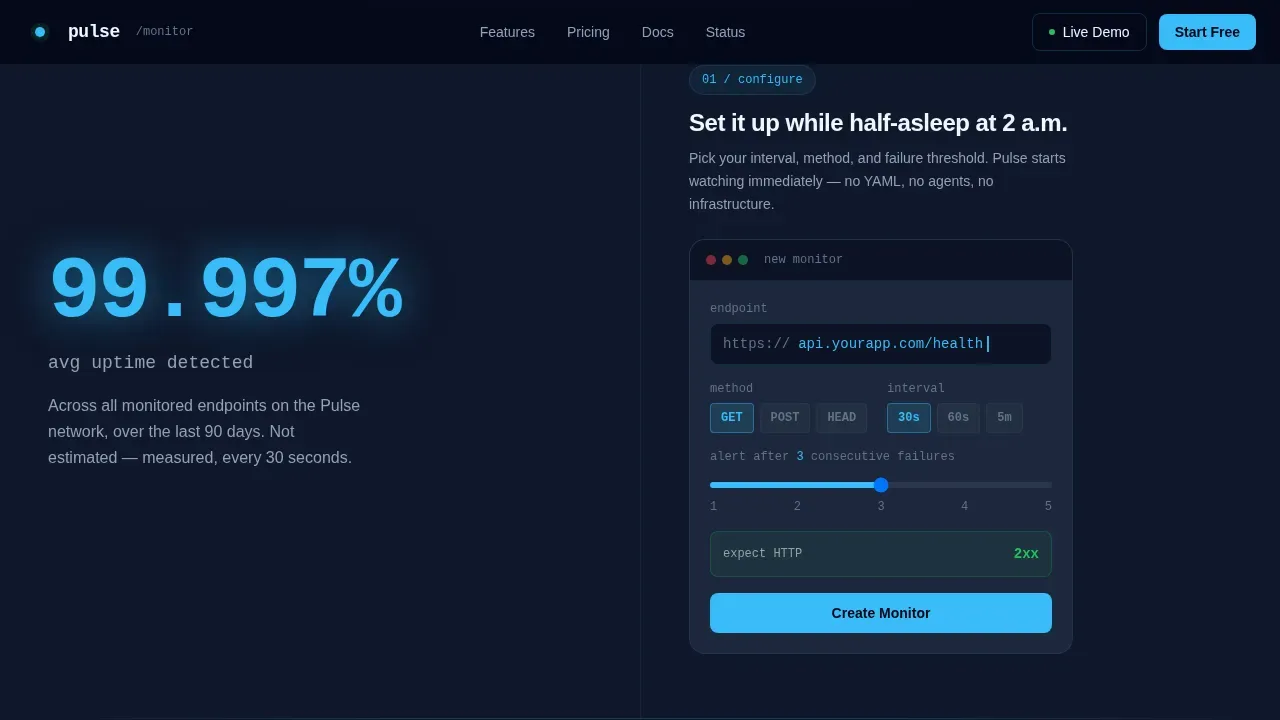
Each content section uses a 50/50 split. One panel holds a single oversized metric rendered in sky blue, covering website uptime percentage, response time, or alert latency. The opposite panel shows the feature that produces that number, such as the check configurator or the status page builder mockup.
Inline Freemium Signup Flow
The primary call-to-action opens an inline signup requiring only a work email and a single URL field. No credit card, no plan selector. This removes every barrier that typically causes visitors to abandon a monitoring service signup page.
Interactive Live Demo Modal
A secondary call-to-action labeled "See live demo dashboard" opens an iframe of a pre-populated monitoring dashboard. Visitors can interact with live dashboards and test the product feel before committing to an account. This path is built for buyers who need to see before they sign.
Status Page Builder Mockup Section
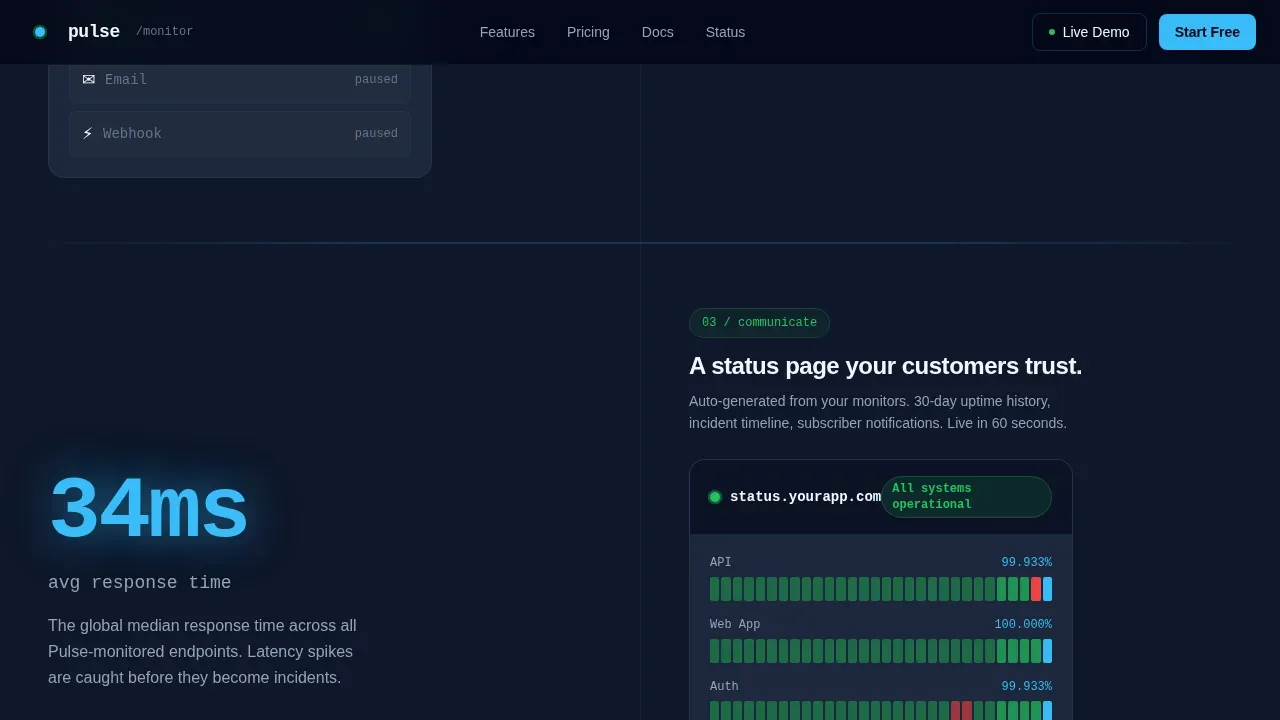
One dedicated split section showcases the status page builder interface. It displays how users can create public status pages, connect a custom domain, add a logo, and show a real time status badge to customers. This section communicates transparency and helps visitors understand what their own customers will see.
Scrolling Testimonials and Final call to action Block
The page closes with staggered testimonial cards from SaaS founders and DevOps leads, followed by a final "Start Monitoring, Free" conversion block. Social proof is positioned at the moment of highest intent, right before the last call-to-action.
Page sections overview
| Section | Purpose |
|---|---|
| Dark Full-Bleed Hero | Animated sonar ping, live counter, fade-in headline, and inline signup |
| Uptime Stats Split | Oversized 99.997% metric paired with check configurator mockup |
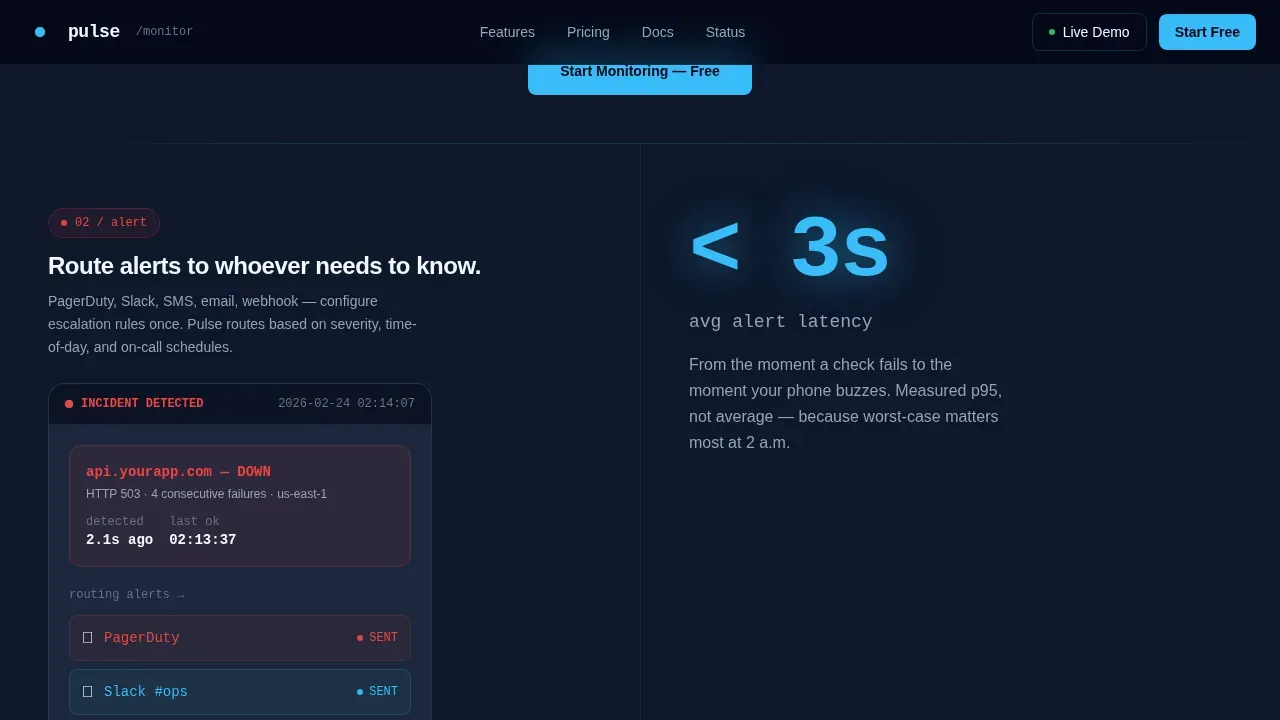
| Alert Flow Split | Multi-channel alert flow visual paired with sub-3-second latency metric |
| Response Time Split | 34ms average response metric paired with status page builder mockup |
| Testimonials and call to action | Scrolling testimonial cards and final freemium conversion block |
| Linear Single-Row Footer | Minimal footer with nav links and domain/brand elements |
Design & branding system
The visual identity follows the Startup Velocity theme and Slate & Sky color system. Typography uses DM Sans for interface copy and JetBrains Mono for all metrics, code values, and status codes. The result feels like a terminal window at midnight with one bright notification glowing in the corner.
- Deep command-line slate (#0F172A) for backgrounds, mid-tone graphite (#334155) for card surfaces, and electric sky blue (#38BDF8) for pings, badges, and interactive elements
- Cool cloud white (#F0F9FF) for body text and negative space, keeping legibility high against dark backgrounds
- Scroll-linked reveals, staggered card entries, and counter tick-up animations deliver a high-animation experience consistent with a real monitoring cockpit
Mobile & speed optimization
The template is built desktop-first to honor the cockpit command-center aesthetic, but all sections reflow responsibly for smaller screens. Animation performance relies on CSS and Intersection Observer triggers, keeping the page light even on constrained connections.
- Static hero with CSS animations avoids heavy JavaScript overhead for the sonar ping and counter elements
- Intersection Observer drives scroll-linked reveals, so off-screen components do not animate until they enter view
- Split-screen panels stack vertically on mobile, preserving the metric-first reading order for users on smaller devices
How this template helps you convert
Pulse earns the click by proving competence first and reducing friction to nearly zero. The page is structured so that every scroll step increases a visitor's confidence before asking anything of them.
- The hero leads with a live ping counter and a bold claim, establishing that the monitoring service is active and real before the visitor reads a single feature description
- Each split section escalates from routine monitoring to incident timelines to post-mortem dashboards, so the product feels more capable the further a visitor scrolls
- The final call to action block appears after social proof from real clients, and the only ask is a single URL paste, no credit card, no limit on initial access
Other information about this template
This template is designed to serve as a strong foundation for any website uptime monitoring service that needs to communicate reliability, visibility, and speed to technical buyers. The layout supports monitoring solutions ranging from simple single-endpoint checks to multi-service observability platforms.
- The status page section is built to show how users can customize their status page with a logo, colors, and a custom domain linked via CNAME record, helping teams communicate openly with customers during incidents
- Public status pages displayed in the mockup support email alerts to subscribers, a status badge for embedding, and incident management reports that tag ongoing issues by current status
- The alert flow section visualizes multi-channel alerts including Slack, SMS, and email alerts, illustrating how a team gets notified when a check fails without false alarms from single-location errors
- Monitoring from multiple global data centers is represented in the layout to show how the service avoids false positives and ensures complete coverage across regions
- SSL certificates, status codes, and response time are all surfaced as visible metrics in the split panels, giving DevOps visitors the technical detail they need to evaluate the monitoring platform
- Advanced settings depicted in the check configurator mockup let users control check frequency and alert rules, enabling teams to customize monitoring to their exact reliability requirements
- The template is a strong fit for projects where the free plan needs to be communicated clearly and where the price-to-value story depends on showing real uptime data rather than feature lists
- Pulsetic is one example of an established monitoring service whose product concepts, including public status pages, incident management reports, multi-data-center checks, historical uptime logs, and downtime alerts via SMS, email, Slack, and phone, align well with the section flow this template is built to present
Theme
Startup Velocity
Creative direction
Stats-First Impact
Color system
Slate & Sky
Style
Split Screen (50/50)
Direction
Freemium/Trial
Page Sections
Animated Sonar Hero with Live Counter
Stats-first Split Screen Panels
Inline Freemium Signup Block
Live Demo Dashboard Modal
Status Page Builder Section
Scrolling Testimonials and Final Call to Action
Related questions
Can I connect a custom domain to the status page section in this template?
Does the template include a section for public status pages?
How does the alert flow section show multi-channel notifications?
Is there truly no credit card required in the signup flow?
What types of checks are shown in the configurator mockup?



