Smart Retail IoT Sensor Analytics Landing Page Template
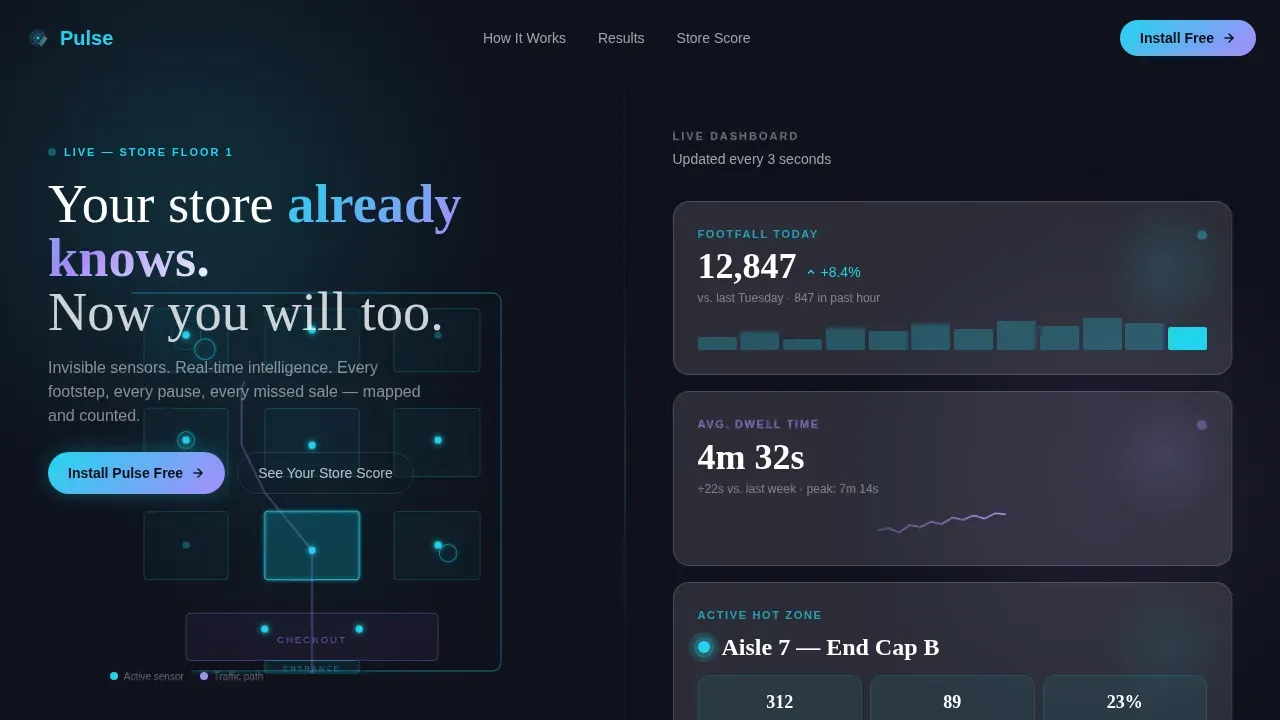
Pulse is a split-screen landing page built for smart retail IoT platforms. It pairs an animated store floor plan wireframe with live metric cards, then walks visitors through a Problem-to-Solution arc that turns sensor data into staffing alerts, heat maps, and footfall counts. The page closes with a store diagnostic quiz gated behind an app download call to action.
by Rocket studio
Quick summary
Pulse is a single-page template designed for retail IoT analytics products. It opens with a dark, glassmorphic control-room aesthetic, animated sensor nodes, and three live-style metric cards. A scroll-driven arc moves visitors from pain to proof, then into an interactive store quiz that drives app installs.
Who this template is for
This template suits teams selling sensor-driven intelligence to physical retail operators. It speaks directly to buyers who live inside spreadsheets and need a faster path to real answers.
- Retail operations managers tracking footfall, dwell time, and heat zones
- Mall directors who need foot traffic proof to justify lease rates
- Franchise owners trying to connect Tuesday staffing levels to actual customer flow
What problem this template solves
Retail companies often have no real-time visibility into what happens on the floor. Stockout rates stay high, conversion stays low, and staffing stays guesswork. This template surfaces those pain points early, then shows the product solving each one.
- High stockout rates caused by missing shelf data
- Inefficient staffing due to lack of occupancy and queue visibility
- No clear way to translate in-store sensor data into actionable decisions
What you get with this template
You get a fully structured, section-led landing page ready to represent any smart retail IoT analytics product. Every section is purposeful, sequenced, and visually distinct.
- Hero section with a 50/50 split: animated floor plan wireframe on the left, three live metric cards on the right
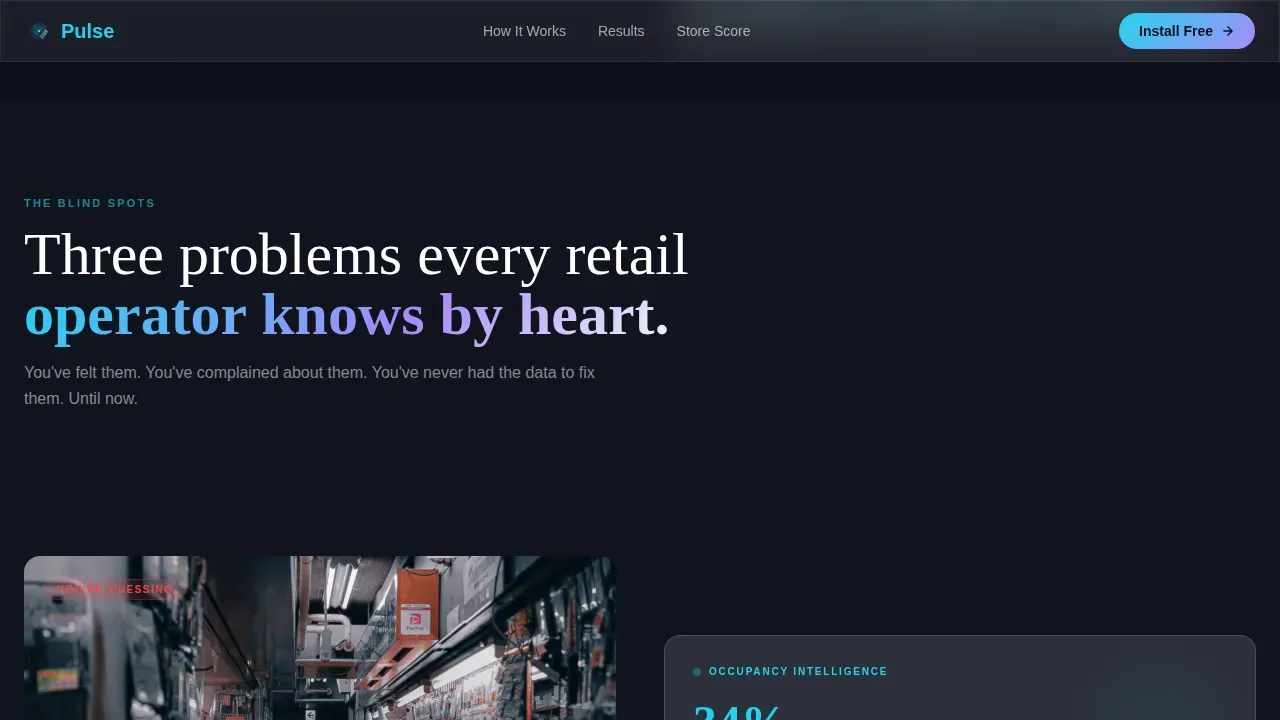
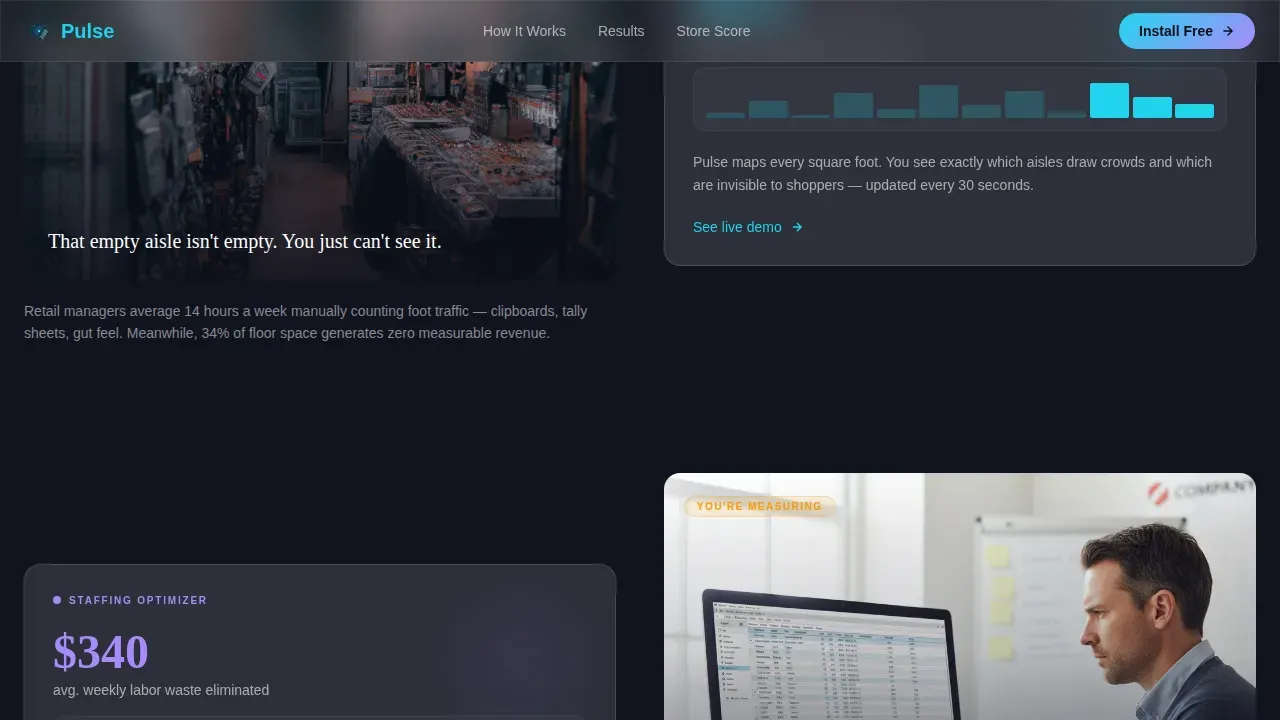
- A Problem-to-Solution arc with three paired retail blind spots and interface responses
- A store score quiz flow with a gated report preview driving the primary app download call to action
Feature list
This template delivers a focused set of built-in sections and design behaviors grounded in the source brief.
Animated Hero with Live Metric Cards
The left panel renders a cyan wireframe floor plan with glowing sensor nodes. The right panel stacks three frosted-glass cards showing visitor count, average dwell time, and the active heat zone. Numbers animate on load, keeping the display feeling like a live dashboard.
Problem-to-Solution Scroll Arc
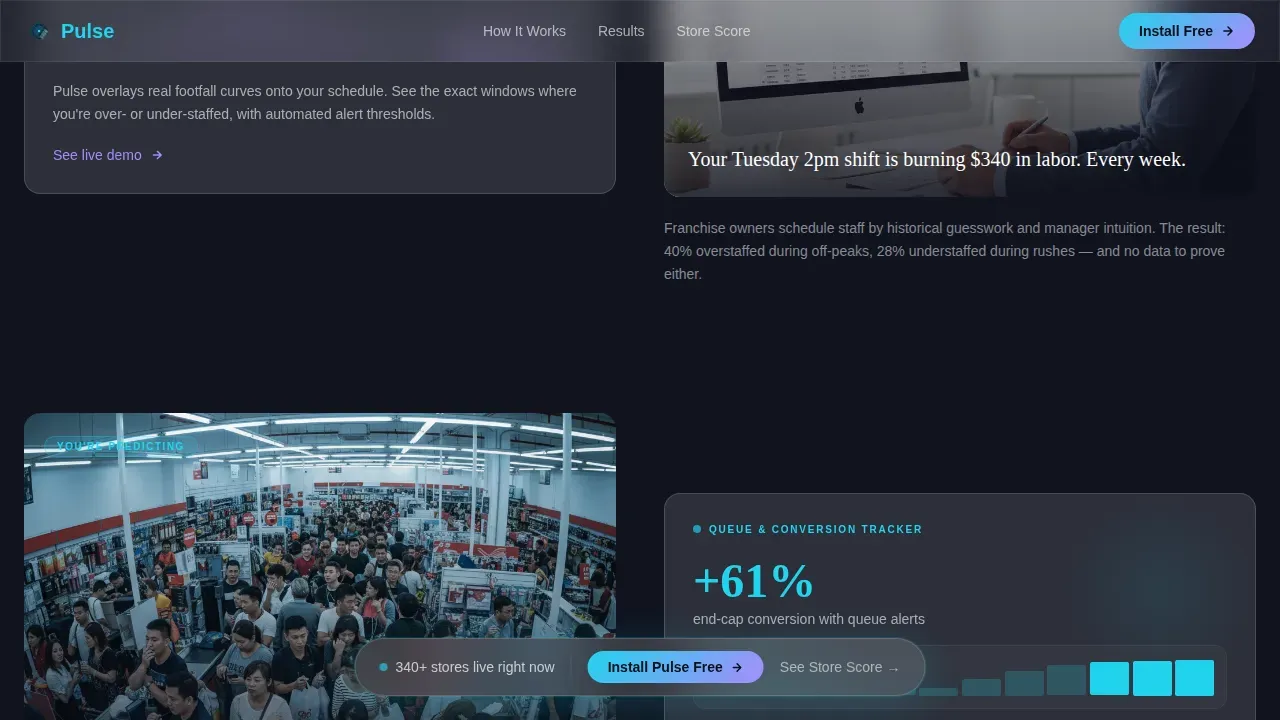
Three paired sections each open with a familiar retail blind spot, then resolve it with a Pulse interface view. The arc escalates from guessing to measuring to predicting, ending with a single screen replacing multiple legacy views.
Fixed Call-to-Action Bar
After the third section, a frosted glass bar locks to the bottom of the viewport. It holds the primary install prompt and stays visible through the quiz and proof sections, reducing drop-off at the decision point.
Store Score Quiz with Gated Report
Visitors answer three quick questions covering store type, square footage, and current foot traffic method. The result is a personalized report preview shown only after the app download step, making the call to action feel earned rather than forced.
Bento Grid: How It Works
A structured bento grid lays out the full sensor pipeline: sensor to stream to insight to action. Each cell is compact, readable, and scannable at a glance.
Proof Wall with Operator Metrics
A dedicated section displays specific client outcomes with real numbers, named retail formats, and square footage context. Social proof includes client logos to reinforce credibility and data reliability.
Page sections overview
| Section | Purpose |
|---|---|
| Hero Split Screen | Introduces platform with animated wireframe and live metric cards |
| Blind Spots Arc | Pairs three retail pain points with real-time interface solutions |
| How It Works | Bento grid showing the sensor-to-action data pipeline |
| Proof Wall | Client outcomes with quantifiable metrics and operator logos |
| Store Score Quiz | Interactive diagnostic driving gated report and app download |
| Footer | Linear single-row footer with minimal links |
Design & branding system
The visual identity runs on a glassmorphic palette designed to feel like a control room viewed through a rain-wet storefront window. Every surface is intentionally luminous and layered.
- Background deep retail night (#0D0F1A), frosted panel surfaces at low opacity, signal cyan (#22D3EE) on live data points, and frosted lilac (#A78BFA) for interactive highlights
- Typography pairing: Fraunces for display headlines, DM Sans for body and interface labels
- Scroll-triggered reveals, counting number animations, and pulsing sensor node effects throughout
Mobile & speed optimization
The template is built desktop-first for operations managers at workstations, with a responsive fallback for tablet and mobile use. Animations are handled with GPU-accelerated transforms to keep motion smooth.
- IntersectionObserver powers all scroll-triggered reveals without layout blocking
- Frosted glass surfaces use CSS backdrop-filter rather than heavy image overlays
- The fixed call-to-action bar adapts gracefully to narrower viewports
How this template helps you convert
The page is structured to earn the install tap before asking for it. Each section adds one more layer of proof before the call to action appears.
- The hero shows live data first, so visitors understand the product before reading a single feature claim
- The Problem-to-Solution arc mirrors the visitor's exact daily frustration, building recognition and trust
- The quiz personalizes the output, making the gated report feel relevant and the download feel low-risk
Other information about this template
This solution template is built around the full device and sensor ecosystem common to smart retail deployments. It can support visual representations that reflect real IoT device management workflows, including how a tenant or supermarket administrator would interact with the platform.
- The smart supermarkets dashboard layout can display device markers across a floor plan state, letting operators view supermarket and device markers at a glance
- The administration dashboard can reflect a device management state that lets users manage devices, filter devices based on type using a device type filter, and hide specific devices based on role or zone
- The supermarket management state and dashboard state displays supermarkets alongside their corresponding alarms, supporting the header and alarms list layout shown in the template
- Device details panels can show a specific device marker, define precise location, and surface a sample device payload for any particular device, including battery powered nodes
- The template layout supports alarm rule configurations where smoke sensors or door sensors raise a major alarm, and a motion sensor can raise a critical alarm when triggered outside working hours
- Occupancy sensors raise a major alarm after 30 minutes of continuous room occupancy; liquid level sensors raise alarms below threshold; smart bin sensors alert when fullness exceeds the set limit
- Smart shelf sensors trigger corresponding alarms when weight telemetry drops below default threshold values, and different default threshold values can be set per device type
- The supermarket devices state and supermarket devices state displays can reflect created multiple sensors, created devices, and devices assigned across one or multiple supermarkets
- A live demo dashboard with demo data helps prospects experience the platform without needing to connect real devices or send a sample device payload immediately
- The page design supports a solution provider positioning that can provision multiple customers and provision customers across multiple supermarkets, with IoT devices pooled and devices assigned per corresponding supermarket
- Retail analytics applications benefit from real-time data collection and visualization; integrating AI with no-code tools can lead to faster dashboard development cycles
- No-code platforms allow non-technical users to build on top of a generic smart retail solution without traditional programming skills
- The platform calculates state changes and raises a critical alarm for smoke sensors when smoke is detected; a freezer device and other devices follow their own alarm rule logic
- Collected data from multiple sensors, including a motion sensor similar to occupancy sensors, feeds into the smart supermarket administration dashboard for display data and reporting
- Users can view display devices, display device details state, and delete existing devices or delete devices as needed; exact commands are available through the dashboard development guide
- The smart supermarket administration layer supports multiple devices and multiple customers, with the supermarkets dashboard reflecting each corresponding supermarket in a unified view
Theme
Directory & Discovery
Creative direction
Problem→Solution Arc
Color system
Glassmorphic
Style
Split Screen (50/50)
Direction
App Download
Page Sections
Animated Split-screen Hero
Problem-to-solution Scroll Arc
Fixed Frosted Call-to-action Bar
Interactive Store Score Quiz
Proof Wall with Real Operator Metrics
Bento Grid Pipeline Explainer
Related questions
Who is this landing page template designed for?
What sections are included in this template?
Does the template include the quiz interaction layout?
Can the template reflect different alarm types and sensor behaviors?
Is this template suitable for a multi-location retail operator?



