Financial Services Digital Presence Portfolio Website Template
Ticker is a split-screen landing page template built for fintech platforms that turn raw market data into real-time decision engines. It pairs bold proof-first copy with a live-styled portfolio dashboard mockup, guiding self-directed investors, fintech founders, and registered investment advisors toward a single high-intent action: launching a free demo of your stock dashboard.
by Rocket studio
Quick summary
Ticker is a single-page, split-screen landing page template designed for fintech and trading intelligence platforms. It opens with hard data, builds trust through live-styled dashboard visuals, and drives visitors toward one clear action. Every section pairs a metric with a feature explanation, keeping the focus on portfolio performance and real-time market intelligence from the first pixel to the final call to action.
Who this template is for
This template is built for products that live and breathe market data. It fits teams who need a landing page that looks as sharp as the platform it promotes.
- Self-directed investors managing six-figure stock portfolios who expect a dashboard-grade first impression
- Fintech founders and product teams benchmarking a trading intelligence platform against established market incumbents
- Registered investment advisors, often called RIAs, who need clients to see portfolio performance clearly without a phone call
What problem this template solves
Most finance landing pages bury the product behind generic headlines and stock photography. Visitors who track live investments need to feel the platform working before they commit. This template solves that gap by leading with data visualizations that look operational, not decorative.
- A portfolio dashboard page that shows nothing useful above the fold loses high-intent traders in under five seconds
- Complex data presented as walls of text makes risk scores, spreads, and holdings impossible to scan at a glance
- Visitors past the awareness stage need a direct path to a demo, not a form that delays the decision
What you get with this template
The template includes a complete set of section layouts, visual components, and interaction patterns ready to deploy. You do not need to build the page from scratch.
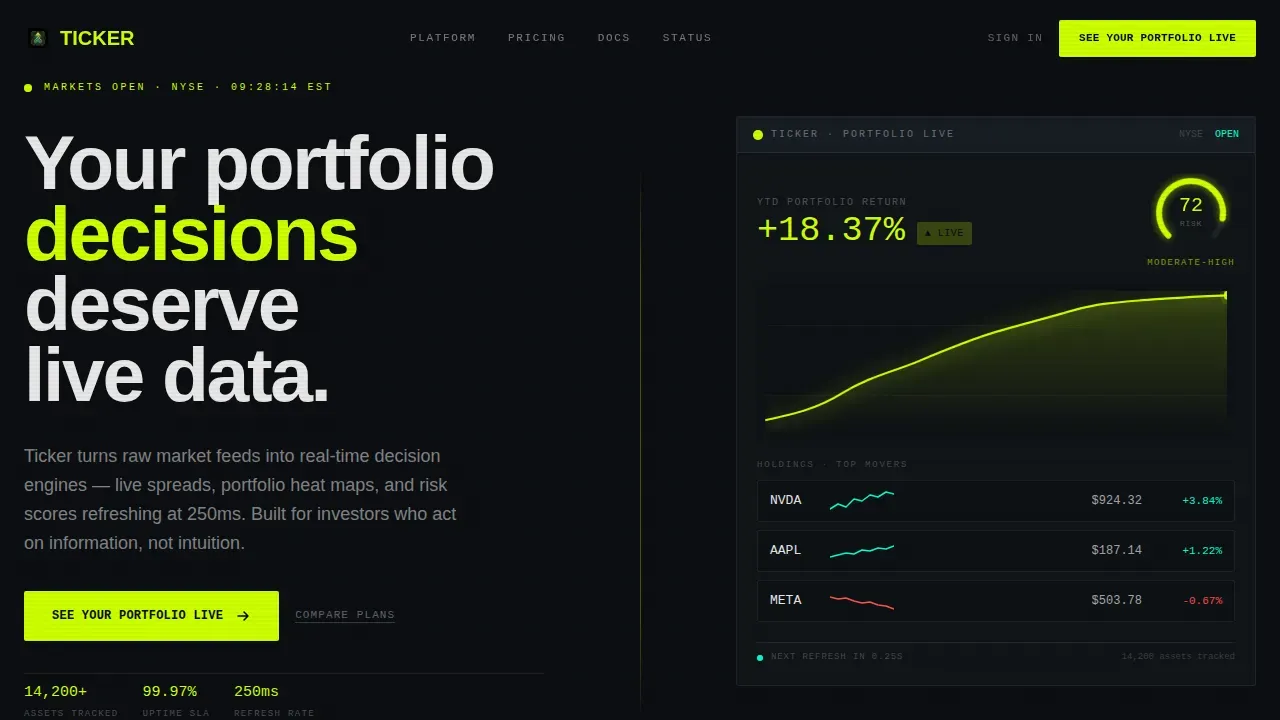
- A 50/50 split-screen hero with a bold claim on the left and a live-styled portfolio dashboard mockup on the right, complete with a glowing equity line chart, pulsing return badge, ticker symbols with micro-sparklines, and a risk score dial
- Animated stats wall, alternating metric-to-feature split sections covering live spreads, heat maps, and risk scores, a social proof section with testimonial cards and outcome metrics, a sticky call-to-action bar, and a minimal footer
- GSAP scroll-trigger animations, counter animations, pulsing data elements, and sparkline hover interactions baked into the layout model
Feature list
This template is purpose-built around one principle: show the product working before asking for anything. Every feature serves that goal.
Split-Screen Hero with Live Dashboard Mockup
The hero section divides the viewport into two equal panels. The left panel carries a single oversized claim in high-contrast signal white type. The right panel renders a live-styled portfolio dashboard module: a glowing chartreuse equity curve, a percentage return badge that pulses gently, three stock ticker symbols each paired with micro-sparklines, and a risk score dial sitting at 72. This visual model communicates platform capability before a single line of body copy is read.
Animated Stats Wall and Counter Triggers
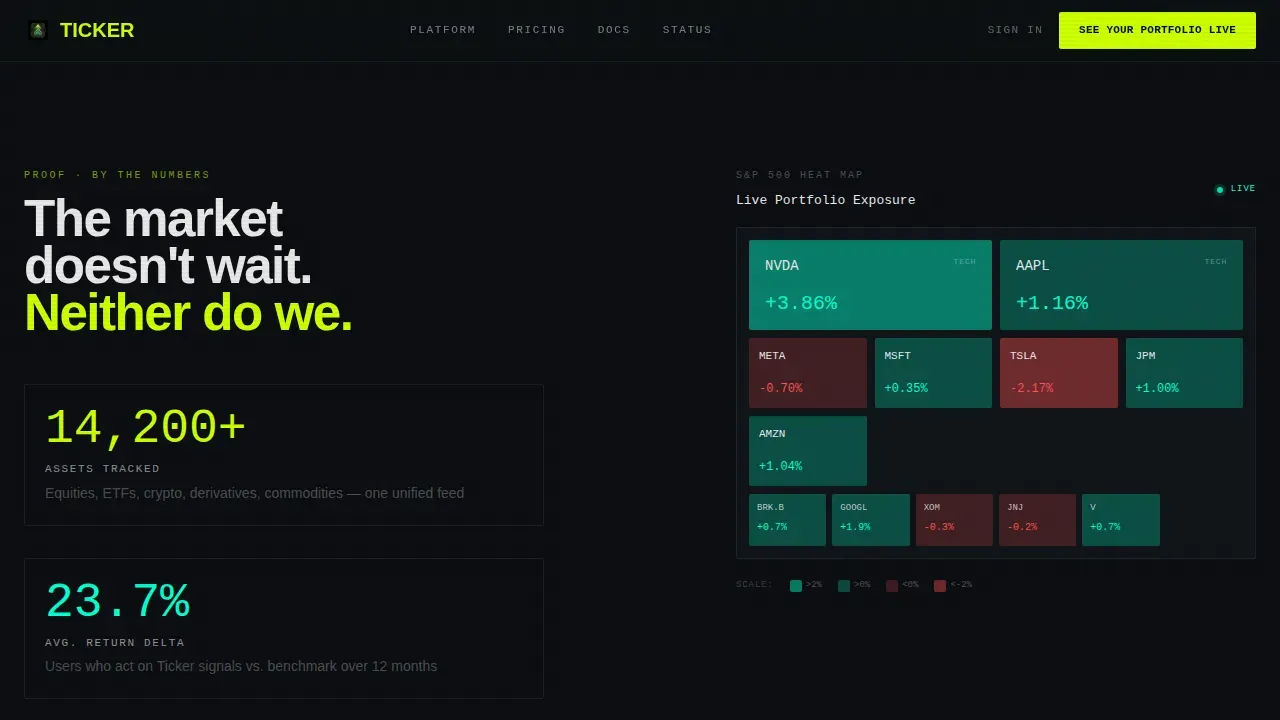
Below the hero, the left panel displays animated counters tracking assets monitored, average return delta, and uptime percentage. GSAP scroll triggers fire each counter as the user scrolls into view. The right panel shows the interface in broader context. This section uses motion to make abstract platform performance feel measurable and real.
Alternating Metric-to-Feature Split Sections
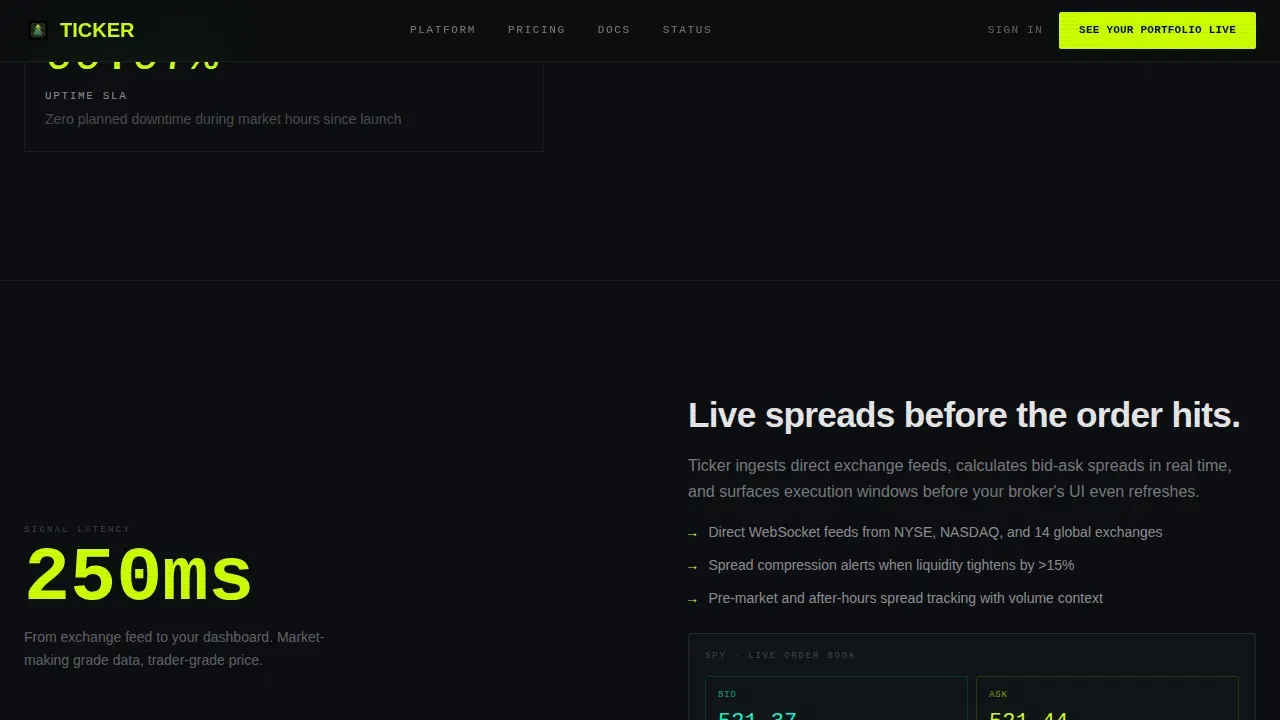
Three paired sections escalate the story from individual tools to full portfolio intelligence. Each pair places a single metric or outcome on one side and a feature explanation on the other. The three feature pairs cover live spread tracking, portfolio heat map data visualization, and risk score analysis. The rhythm builds trust incrementally: a number lands first, the explanation earns belief, then the next number arrives harder.
Sticky Call-to-Action Bar
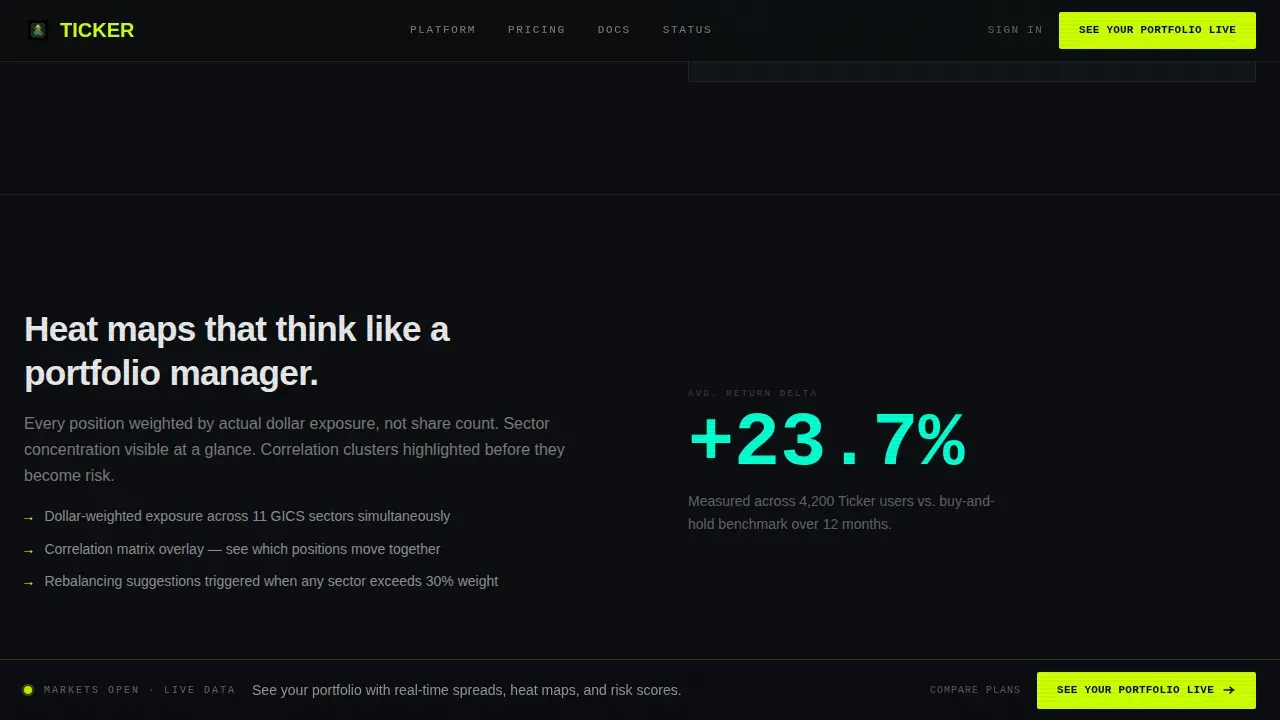
After the second scroll, a sticky bar locks to the viewport bottom and repeats the primary call to action: "See Your Portfolio Live." A secondary text link, "Compare Plans," sits below for visitors already past the consideration stage. The bar stays visible as the user continues scrolling, removing friction from the conversion moment.
Social Proof Section with Outcome Metrics
The social proof section combines three user testimonials that reference specific portfolio results with a row of key outcome metrics. This section gives high-intent visitors the third-party validation they need before clicking through to the dashboard demo. No generic praise; each card is anchored to a measurable result.
Footer with GitHub Developer Minimal Pattern
The footer follows Pattern 8, a minimal developer-grade layout that keeps the page clean and professional. It avoids heavy navigation clusters and lets the sticky call-to-action bar remain the dominant action prompt as the page ends.
Page sections overview
| Section | Purpose |
|---|---|
| Hero Split Screen | Pair bold claim with live dashboard mockup |
| Animated Stats Wall | Show platform scale through animated counters |
| Spreads Feature Split | Highlight live spread tracking with supporting metric |
| Heat Map Feature Split | Demonstrate portfolio heat map data visualization |
| Risk Score Split | Present risk score analysis alongside outcome data |
| Social Proof Section | Build trust with testimonials and outcome metrics |
| Sticky Call-to-Action Bar | Keep primary conversion action persistent on scroll |
| Final Call-to-Action Block | Reinforce demo click before footer |
| Minimal Developer Footer | Close page with clean, low-distraction footer layout |
Design & branding system
The visual identity follows an Acid Digital color system built around a void black base. The aesthetic has been described as a Bloomberg terminal redesigned by a Berlin nightclub: high-contrast, zero warmth, every pixel earning its place. Financial product landing pages often favor deep neutrals for credibility, and this template delivers that while adding sharp neon accents that signal speed and live data.
- Core palette: void black (#0B0E11) dominates all backgrounds; electric chartreuse (#CCFF00) fires on calls to action and live data highlights; terminal cyan (#00FFD1) marks positive movement and active interface states; signal white (#E8E8E8) keeps all body text razor-legible against the dark field
- Typography model: DM Sans handles body copy for clean readability; Cabinet Grotesk and JetBrains Mono handle data displays and monospaced financial metrics, giving numbers the weight and authority they need on a stock dashboard
- No stock photography and no human faces appear anywhere in this template; data visualizations are the hero images throughout every section
Mobile & speed optimization
The template is built desktop-first to serve dual-monitor traders and analysts who manage investments on large screens. Responsive breakpoints ensure the layout adapts cleanly to tablet and mobile viewports so the portfolio dashboard remains readable on any device. Landing pages must establish a strong first impression quickly, and this template is structured to keep initial render fast and focused.
- Static page sections use server-side rendering for fast delivery; animated dashboard components are handled client-side to balance performance with interactivity
- The sticky call-to-action bar and counter animations are optimized to stay smooth across device sizes, ensuring mobile users who check their portfolio on the go get the same conversion path as desktop visitors
How this template helps you convert
This template is built around a single conversion goal: get the visitor to click through to a free dashboard demo preloaded with sample data. Every design and copy decision supports that goal without introducing competing actions.
- The hero section leads with the hardest proof first, a live-styled stock dashboard mockup that shows the product working before any feature is explained, so high-intent traders trust the platform on sight
- The sticky call-to-action bar, repeating "See Your Portfolio Live" after the second scroll, keeps the primary action visible throughout the entire page experience without requiring the user to scroll back to the top
Other information about this template
This template sits at the intersection of financial data presentation and high-conversion landing page design. It is versatile across the fintech sector, fitting financial advisors, trading app teams, and real-time market news platforms alike. Understanding a few broader context points helps teams get the most from this resource.
- Portfolio dashboard templates like this one can track market trends, monitor progress across multiple holdings, and support allocation strategy decisions across a range of investment types including stocks, mutual funds, and exchange-traded funds (ETFs)
- A good stock dashboard provides detailed information on stock prices, market value, volume, volatility, and other financial metrics in a format that traders can scan at speed; this template models that experience visually without requiring the platform to be live at launch
- Effective portfolio management requires tools that provide real-time insights; teams can integrate data sources later, but the template gives you the conversion layer first so you can acquire users while the platform is still in development
- Stock market dashboards help investors and analysts make faster, smarter decisions by reducing the time it takes to assess a current portfolio; this template communicates that speed through its Stats-First layout model
- The template is compatible with workflows that involve Google Sheets as a lightweight data layer; Google Sheets supports the GOOGLEFINANCE function to automatically update stock prices, making it a practical resource for teams prototyping a stock portfolio tracker before connecting a full data pipeline
- Google Sheets can serve as an interim data model for tracking holdings, current portfolio value, and latest price data; this means smaller teams can use Google Sheets alongside the template while building toward a live backend
- Many investment tracking workflows start in Google Sheets because it offers flexibility, privacy, and the ability to analyze trends without specialized tooling; this template can complement that process by giving the platform a credible public face
- Interactive charts that update automatically without page refreshes are essential for real-time data visualization; the template models this behavior with SVG sparklines and a live-styled line chart in the hero dashboard module, giving visitors a believable preview of the product's data analysis capabilities
- WebSocket technology is commonly used for streaming live data updates on portfolio intelligence dashboards; while the template ships with styled mockup components, the layout and interaction patterns are designed to accommodate live data connections as the platform matures
- AI-powered portfolio analyzers can provide personalized investment insights and recommendations based on user data; machine learning algorithms can analyze historical data to predict future price movements and provide buy or sell signals, and this template is structured to present those capabilities credibly to early visitors
- Predictive analytics and AI insights are increasingly critical modules for helping users forecast future performance in portfolio intelligence platforms; the template's Stats-First creative direction gives those claims maximum visual weight when you are ready to add them to your copy
- The template model does not require building from scratch; it ships as a ready-to-customize layout so teams can adapt color values, copy, and data display details to match their specific brand and product strategy
- Multiple stocks, holdings across asset classes, and allocation breakdowns across a stock portfolio can all be surfaced through the dashboard section patterns included in this template; teams can extend the quantity and variety of data presentations shown without restructuring the core layout
Theme
Dashboard Pro
Creative direction
Stats-First Impact
Color system
Acid Digital
Style
Split Screen (50/50)
Direction
Click-Through
Page Sections
Split-screen Hero with Dashboard Mockup
GSAP Animated Stats and Counter Wall
Alternating Metric-to-feature Section Pairs
Sticky Conversion Bar with Dual Actions
Social Proof Section with Outcome Metrics
Minimal Developer Footer Layout
Related questions
Who is this landing page template designed for?
Does this template include animations and interactive elements?
Can I customize the colors, copy, and data values in this template?
Is this template optimized for mobile devices?
How does the conversion strategy work in this template?



