Premium Performance Landing Page Template
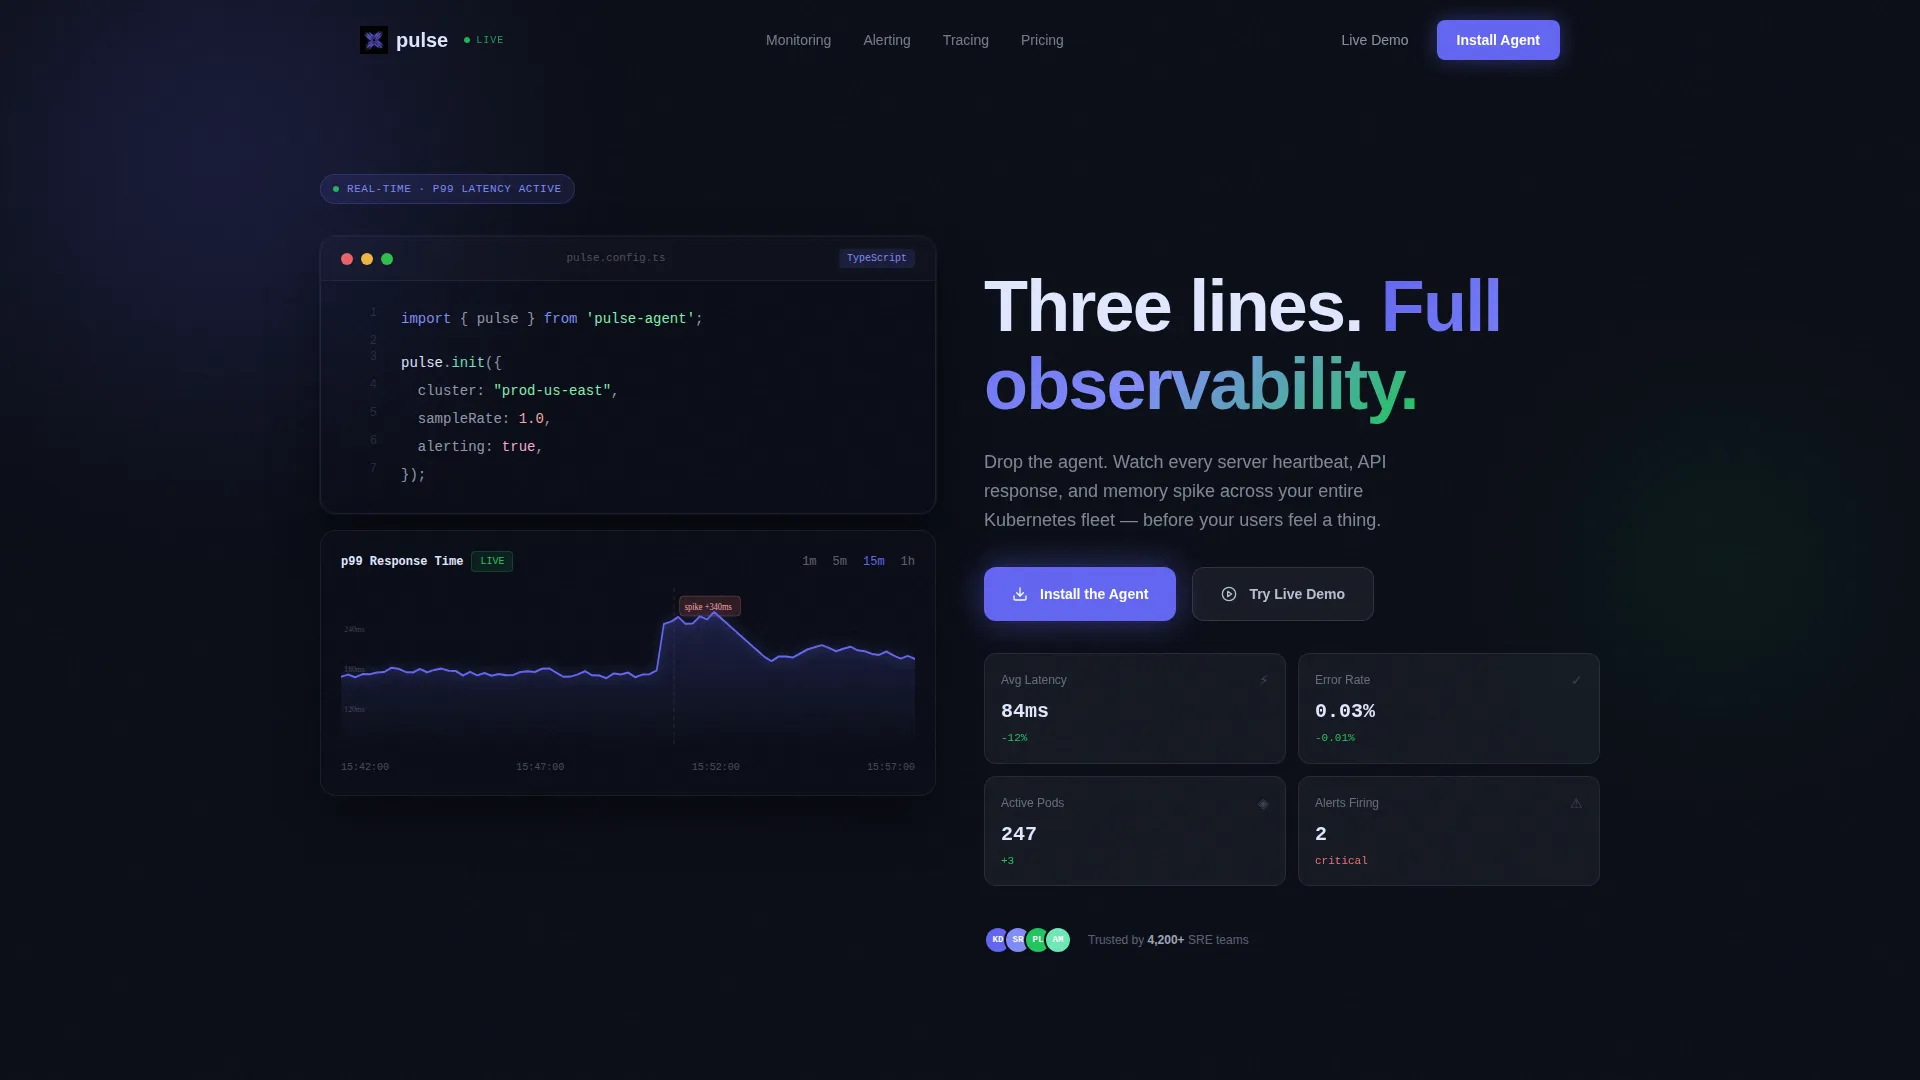
Pulse is a real-time performance monitor landing page built for DevOps engineers, Site Reliability Engineers (SREs), and platform leads. It opens with a live syntax-highlighted code snippet and an animated latency graph, then scrolls through data-backed findings styled as an industry report. The page drives toward agent installation with a platform-toggle download flow.
by Rocket studio
Quick summary
Pulse is a dashboard-style landing page for a real-time performance monitoring tool. It greets engineers with a working code snippet, then walks them through monitoring, alerting, incident response, and post-mortem workflows using interactive data widgets. The page closes with a platform-aware install command and a live demo path.
Who this template is for
This template is built for technical teams who ship infrastructure products and need to speak directly to an engineering audience. It skips marketing language and leads with evidence.
- DevOps engineers managing Kubernetes clusters who need instant signal on failures
- Site Reliability Engineers (SREs) handling incident response across distributed systems
- Platform leads who must demonstrate uptime commitments to enterprise clients under service-level agreements (SLAs)
What problem this template solves
Most product landing pages rely on adjectives. Engineering buyers distrust adjectives. They want proof before they install anything. This template solves the credibility gap by letting visitors interact with the product before reading a single persuasive sentence.
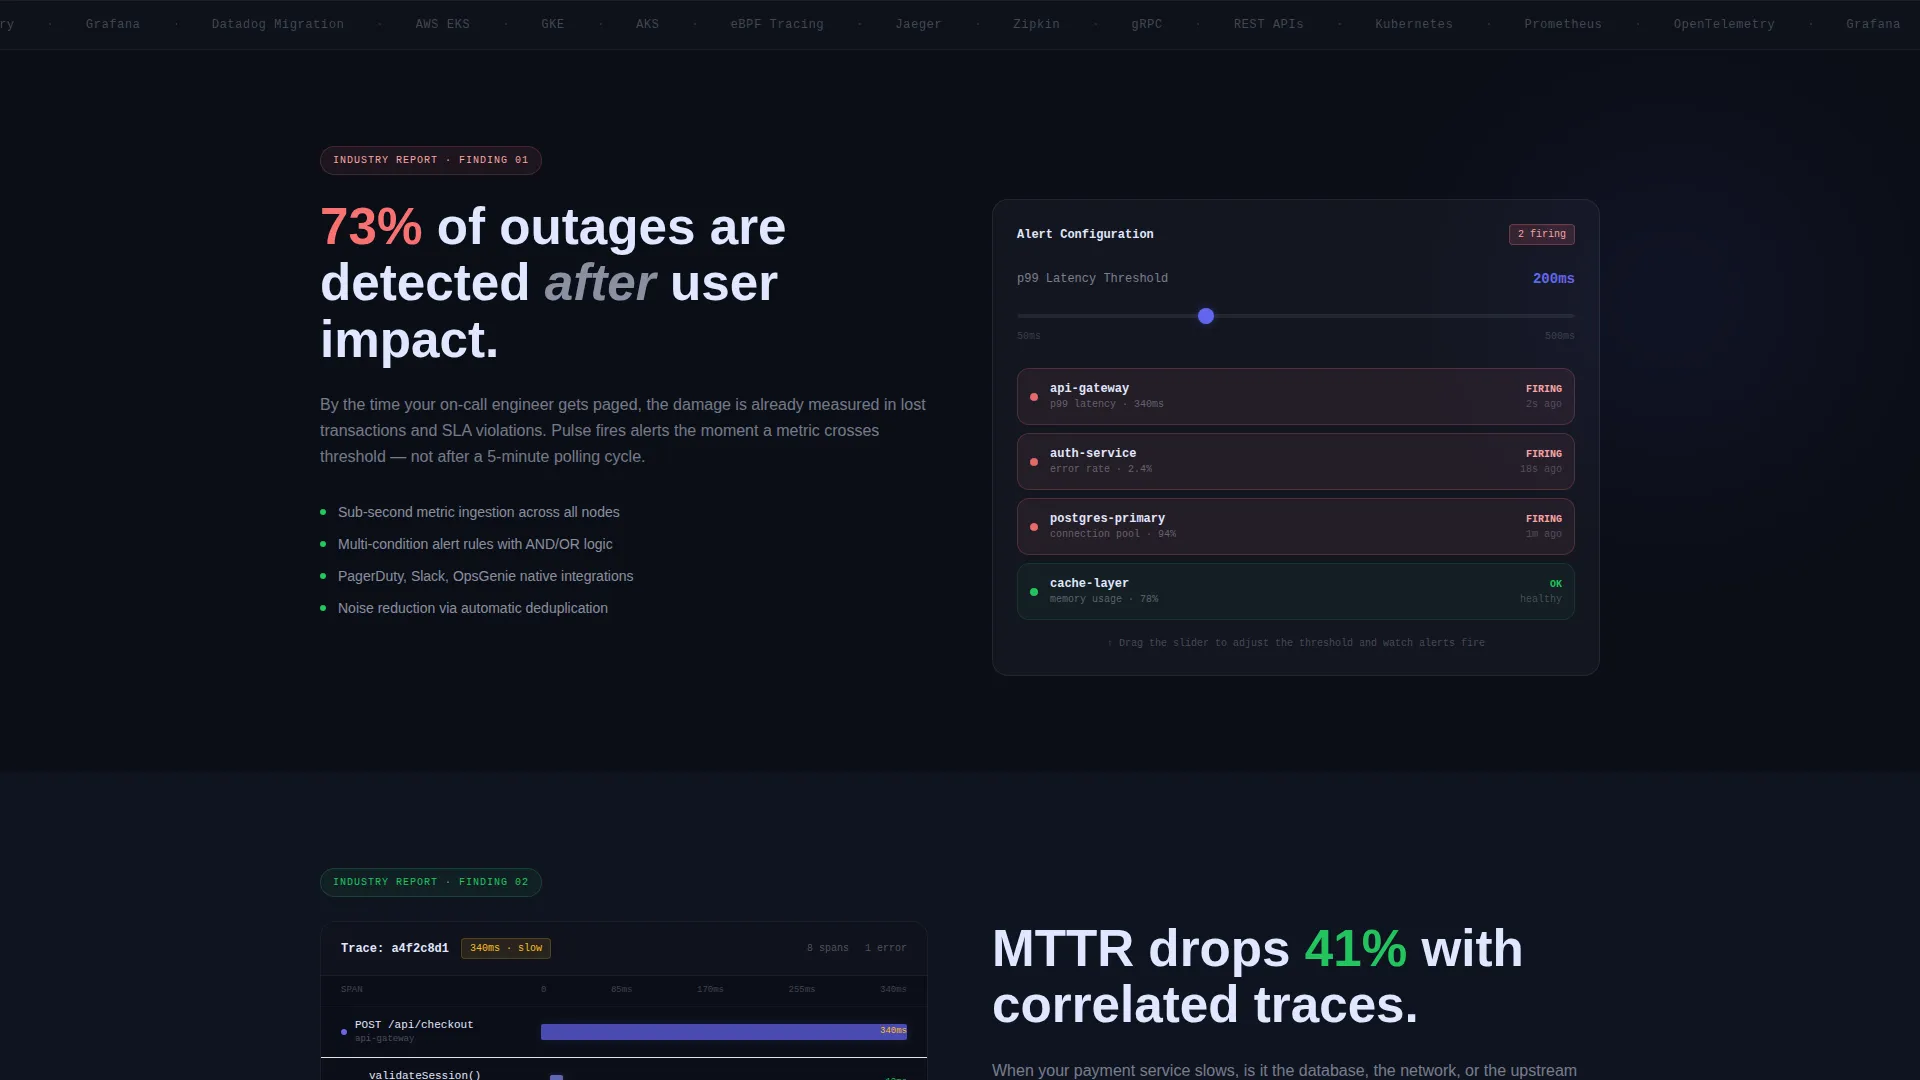
- Outages are often detected after user impact, so the page opens with a live-simulated alert to show immediate detection
- Engineers need to see real workflows, not screenshots, before committing to an install
- Teams evaluating monitoring tools need to compare mean time to resolution (MTTR) outcomes, not feature lists
What you get with this template
You get a complete single-page layout structured around the full incident lifecycle. Every section mirrors a real operational workflow, from first detection through post-mortem review.
- A syntax-highlighted header code block with a blinking cursor and an animated p99 latency graph
- Scroll-driven industry-report sections, each pairing a data claim with an interactive dashboard widget
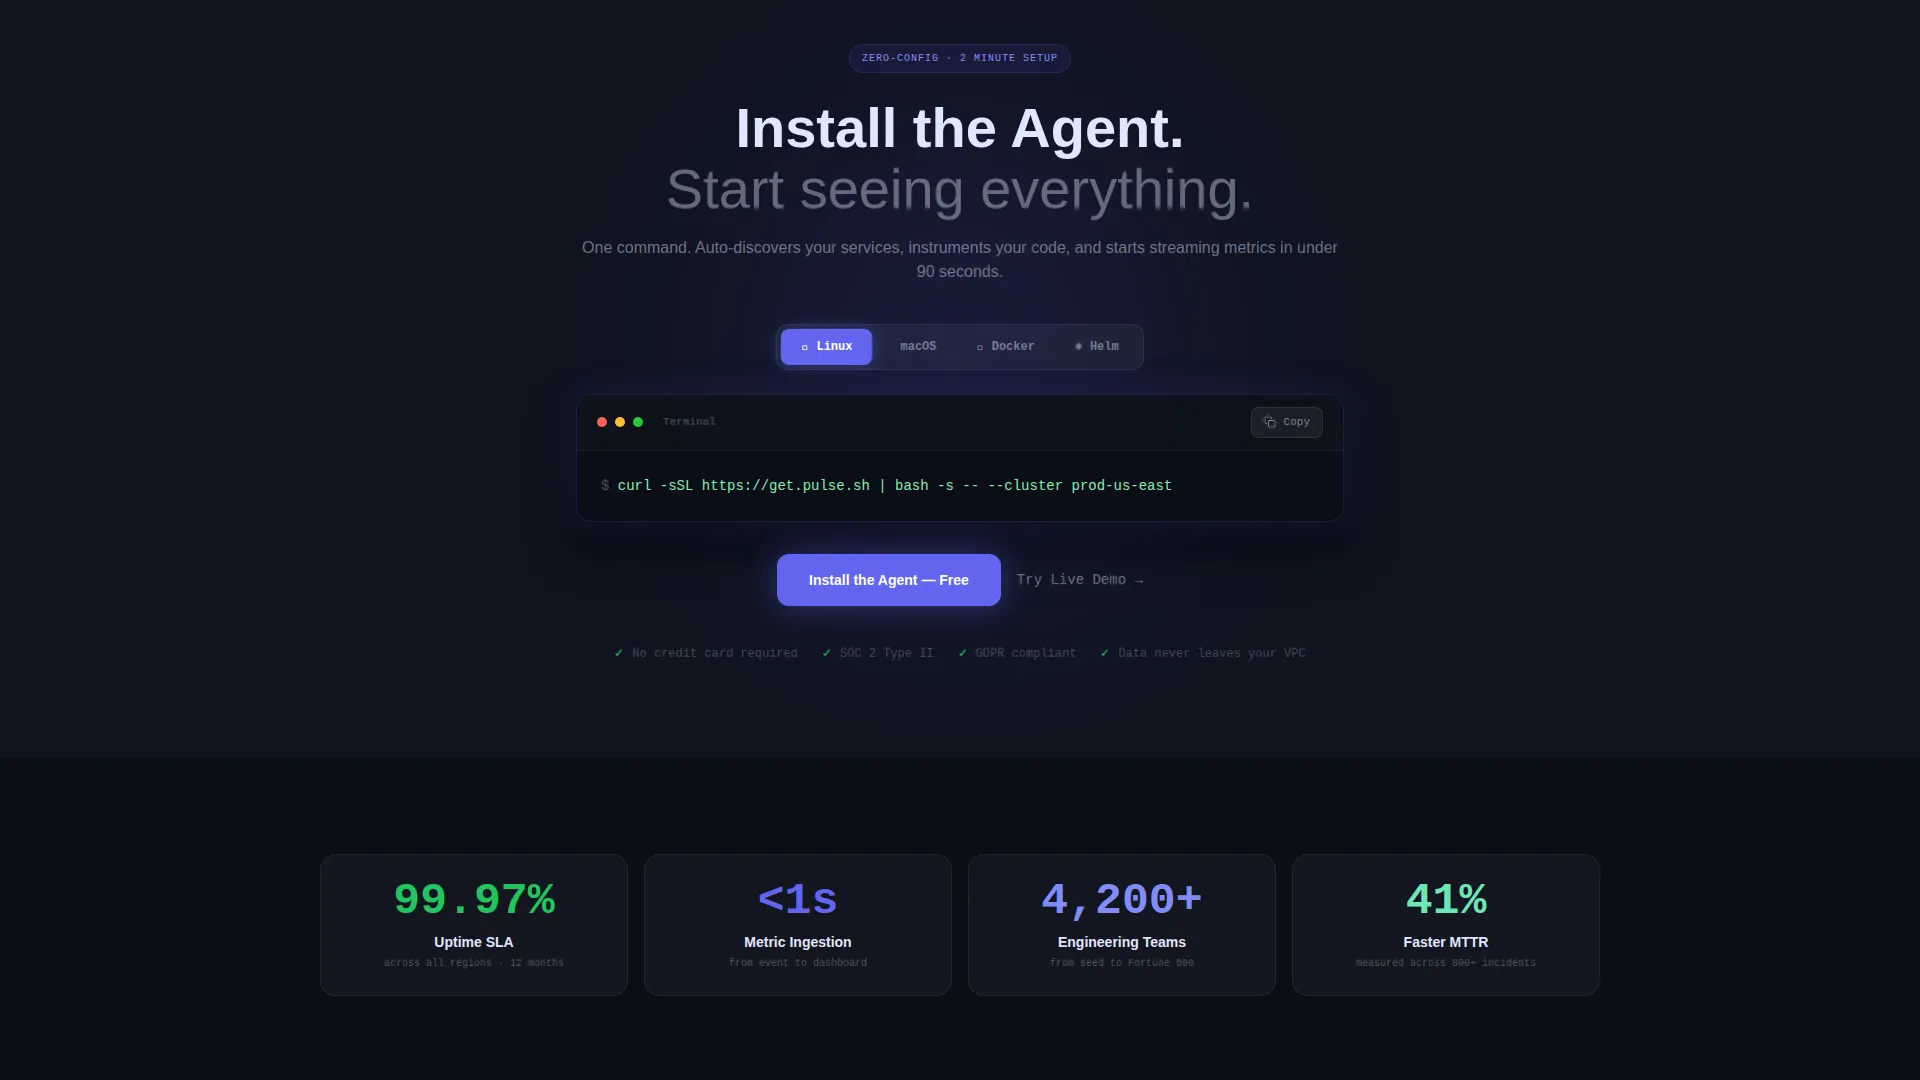
- A platform-toggle install section supporting Linux, macOS, Docker, and Kubernetes Helm chart commands
Feature list
This template delivers six purpose-built sections and components grounded in the source brief.
Syntax-Highlighted Code Snippet Header
The page opens with a monospaced integration block rendered against void black. A blinking cursor animates as if the command was just typed. Below it, a live-simulated latency graph plots p99 response times spiking and resolving in real time.
Animated Live Latency Graph
A graph in the header section animates into view, showing p99 latency spikes that then resolve. This component acts as the first proof point, demonstrating product behavior before any descriptive copy appears on screen.
Industry Report Scroll Sections
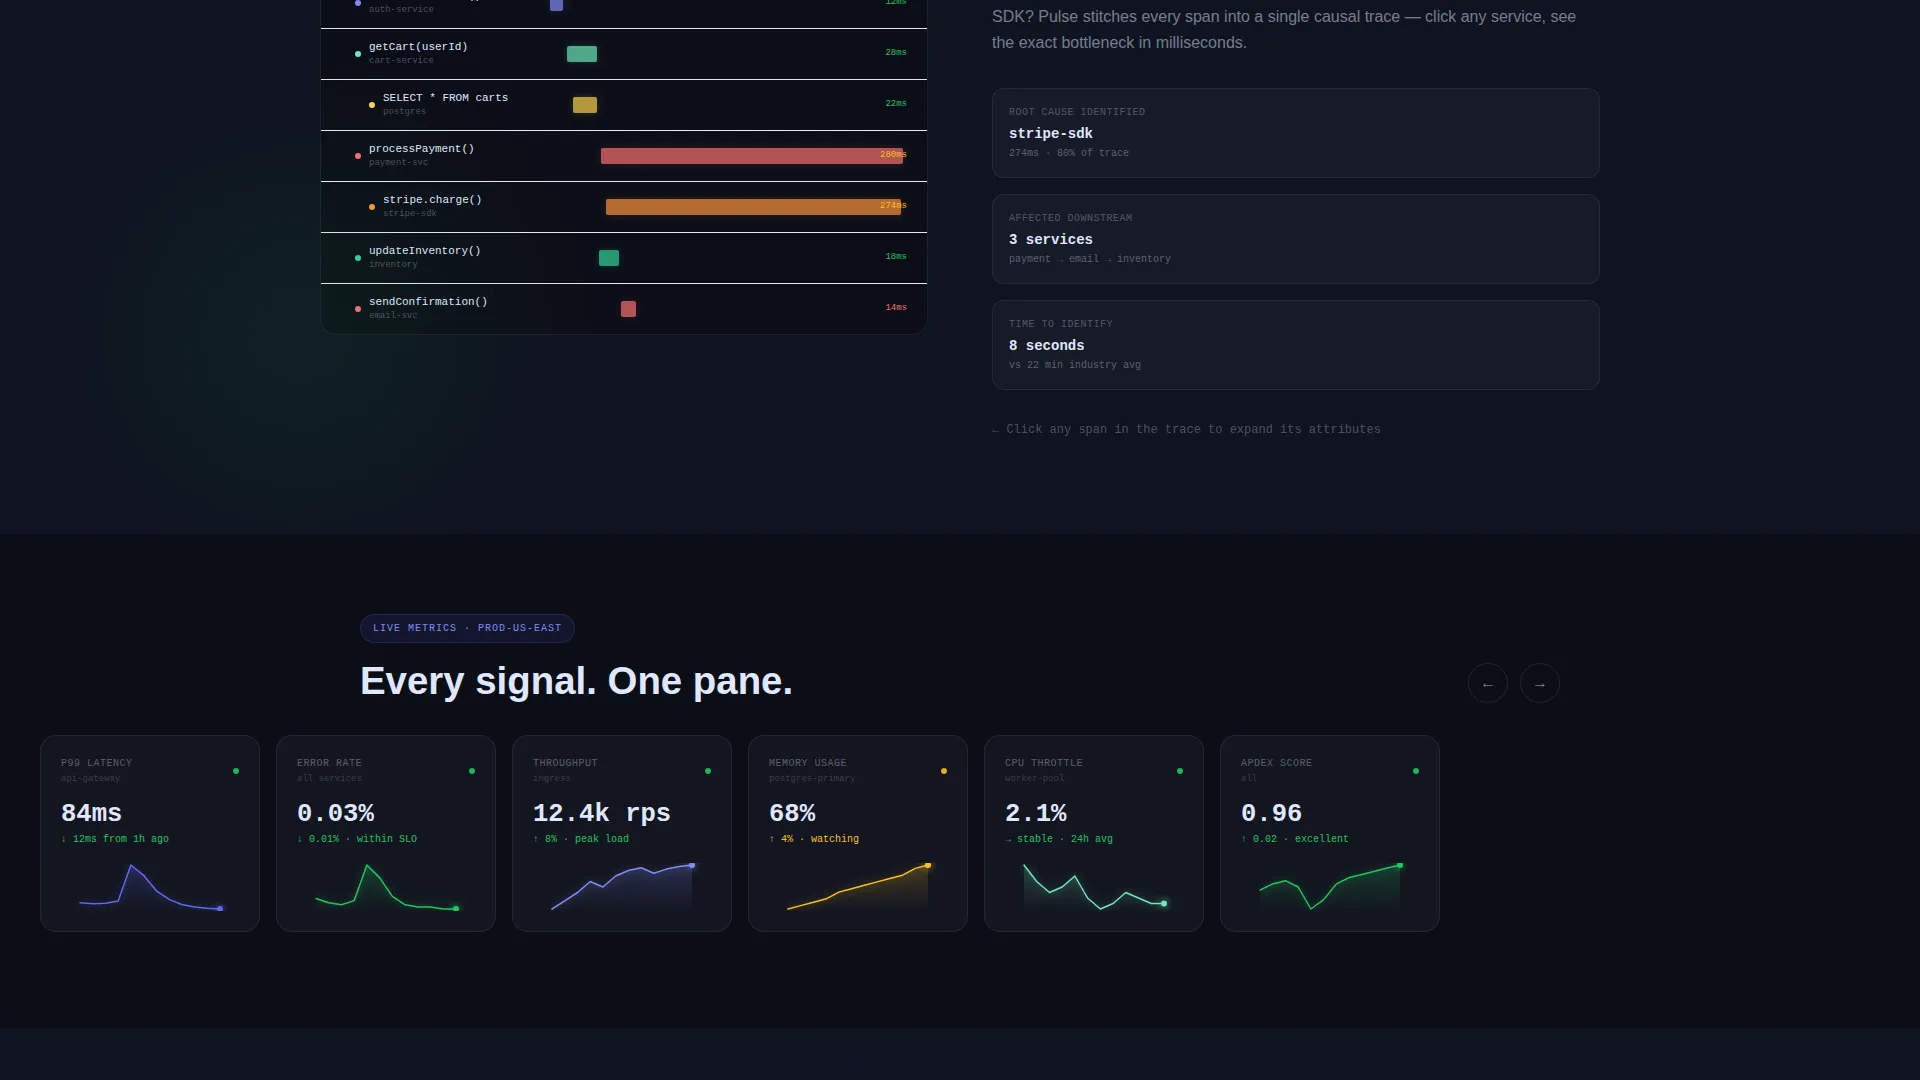
Each scroll section presents a data-backed finding styled like a research brief. Claims such as "73% of outages are detected after user impact" and "MTTR drops 41% with correlated traces" introduce specific feature views: alert configuration, distributed tracing, and incident response panels.
Interactive Dashboard Widgets
Every industry-report section pairs its data finding with a hoverable, filterable dashboard widget. Visitors can interact with the monitoring interface directly on the page, treating each widget as an embedded product trial.
Platform-Toggle Install Flow
The primary call to action (call to action) includes a toggle that switches between Linux, macOS, Docker, and Kubernetes Helm chart options. The install command updates dynamically below the toggle to match the selected platform.
Live Demo Sandbox Path
A secondary call to action links to a sandbox environment populated with synthetic data. This gives visitors a low-commitment way to explore the product before choosing to install the agent.
Page sections overview
| Section | Purpose |
|---|---|
| Code Snippet Header | Show integration instantly with live latency graph |
| Headline Fade-In | Deliver the core value message after proof |
| Outage Detection Brief | Present alert configuration via data finding |
| Distributed Tracing Brief | Introduce trace correlation with MTTR claim |
| Incident Response Brief | Show incident workflow with interactive widget |
| Post-Mortem Review Brief | Close the operational loop with review panel |
| Agent Install call to action | Drive download with platform-toggle command block |
| Live Demo Path | Offer sandbox access as a secondary conversion |
Design & branding system
The visual theme is Tech Glass, built around an Electric Indigo color system. The palette evokes a server room viewed through tinted glass: every element glows faintly and serves a functional purpose.
- Void black (#0B0E17) forms the primary background, giving the interface the depth of a terminal screen
- Electric indigo (#6366F1) pulses through graphs and active-state elements, with frosted glass white (#E0E7FF) at 12% opacity used for card surfaces that appear to float above the dark
- Signal green (#22C55E) is reserved exclusively for healthy-state indicators and confirmation micro-interactions, keeping status signals immediately readable
Mobile & speed optimization
The layout is designed to remain functional and legible on smaller screens. Interactive widgets and code blocks are structured to reflow cleanly without losing their context or hierarchy.
- The monospaced code snippet and latency graph scale to viewport width, keeping the header readable on mobile devices
- Platform-toggle controls and call to action buttons are sized for touch interaction without requiring zoom
- The scroll-driven section structure naturally reduces layout complexity on narrow screens by presenting one data finding at a time
How this template helps you convert
This template converts by earning trust before asking for a commitment. Every design and layout decision is pointed toward one outcome: getting an engineer to run the install command.
- The animated code snippet and latency graph function as an immediate, wordless proof of value, reducing skepticism before the headline even loads
- Interactive dashboard widgets let engineers explore the product interface inside the page, making the install feel like a natural next step rather than a leap of faith
- The platform toggle removes friction at the decision moment by surfacing the exact install command for the visitor's chosen environment
Other information about this template
This template is categorized under Documentation and Support, specifically within the Status and Monitoring subcategory. It is designed to serve the real-time performance monitor niche with a layout that mirrors the actual tools and workflows engineers use every day.
- The template style is Dashboard and Data Grid, making it suitable for products that need to demonstrate live data behavior rather than static feature lists
- The creative direction follows an Industry Report format, grounding every persuasive claim in a quantified finding rather than marketing language
- The header concept is a Code Snippet, signaling technical credibility to engineering visitors from the first pixel they see
- The landing page direction targets App Download, with both a primary install path and a secondary demo path to accommodate visitors at different stages of evaluation
Theme
Tech Glass
Creative direction
Industry Report
Color system
Electric Indigo
Style
Dashboard/Data Grid
Direction
App Download
Page Sections
Syntax-highlighted Code Snippet Header
Animated P99 Latency Graph
Industry Report Scroll Sections
Interactive Hoverable Widgets
Platform-toggle Install Command
Live Demo Secondary Path
Related questions
Who is this landing page template built for?
Can I change the install platforms shown in the toggle?
Do I need real data to power the dashboard widgets?
How does the industry-report scroll structure work?
Is the live demo path included in the template?