Reclaim — Smart Beverage Logistics Landing Page Template
The Reclaim Data Command Wine Spirits Reverse Logistics Landing Page Template is a split-screen B2B landing page built for wine and spirits operations teams. It combines a live-style reverse logistics dashboard with compliance-grade detail, guiding distribution managers, winery DTC leads, and spirits brand controllers toward a recovery audit conversation. Every section is data-first, audit-ready, and built to convert.
by Rocket studio
Quick summary
This template is a desktop-first, split-screen (50/50) landing page designed for the wine and spirits reverse logistics market. It uses a Data Command visual theme with a Teal Catalyst color system to present a live-style reverse logistics dashboard alongside a conversion-focused narrative. The page is purpose-built for B2B partnership outreach, with two clearly structured conversion paths and section-by-section proof of ROI.
Who this template is for
This template is built for operations teams who live inside the returns process every day. If your business touches the wine or spirits supply chain and unmanaged product returns are quietly eroding your margins, this landing page was designed for you.
- Distribution compliance managers tracking three-tier return authorizations and RMA (Return Material Authorization) documentation across multiple states
- Winery DTC (direct-to-consumer) operations leads managing seasonal return spikes and retailer overstock recovery
- Spirits brand controllers who need complete chain-of-custody records that hold up under TTB (Alcohol and Tobacco Tax and Trade Bureau) audit review
What problem this template solves
Reverse logistics in the wine and spirits industry is not a generic supply chain problem. It is a regulated, high-stakes, margin-sensitive process where a broken shipment or a mispick does not just create a customer service issue, it creates a compliance gap. Common challenges in reverse logistics include managing returns, tracking items accurately, and keeping costs low while satisfying regulatory requirements. Inefficient reverse logistics processes lead to increased operational costs and customer dissatisfaction. The complexity of managing returns can overwhelm logistics departments, leading to delays and costly errors.
- There is no centralized reverse logistics dashboard showing where returned products are, what condition they are in, and whether return labels and authorizations are properly logged
- Companies lose recovery value because returned goods are not categorized fast enough to determine whether they qualify for restock, repair, recycle, or disposal
- The lack of technology integration in the returns process means operations teams rely on spreadsheets, which cannot deliver the comprehensive view that supply chain managers need for strategic decision making
What you get with this template
You get a fully structured, professionally designed, completely editable landing page that presents your reverse logistics operations in a control-room-grade visual format. Every section is pre-built for the wine and spirits industry. You do not start from zero, you start with a layout that already speaks the language of compliance, recovery, and logistics.
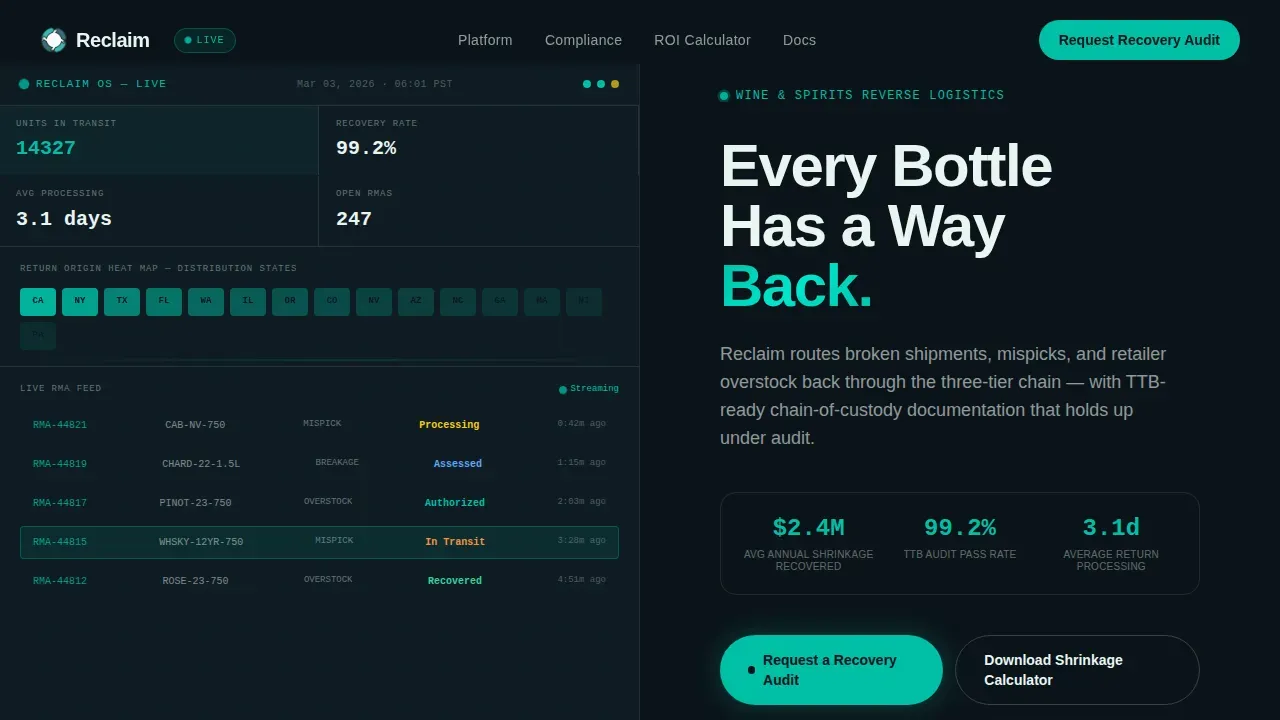
- A split-screen hero section showing a live-style reverse logistics dashboard on the left alongside a bold conversion headline and primary call-to-action on the right
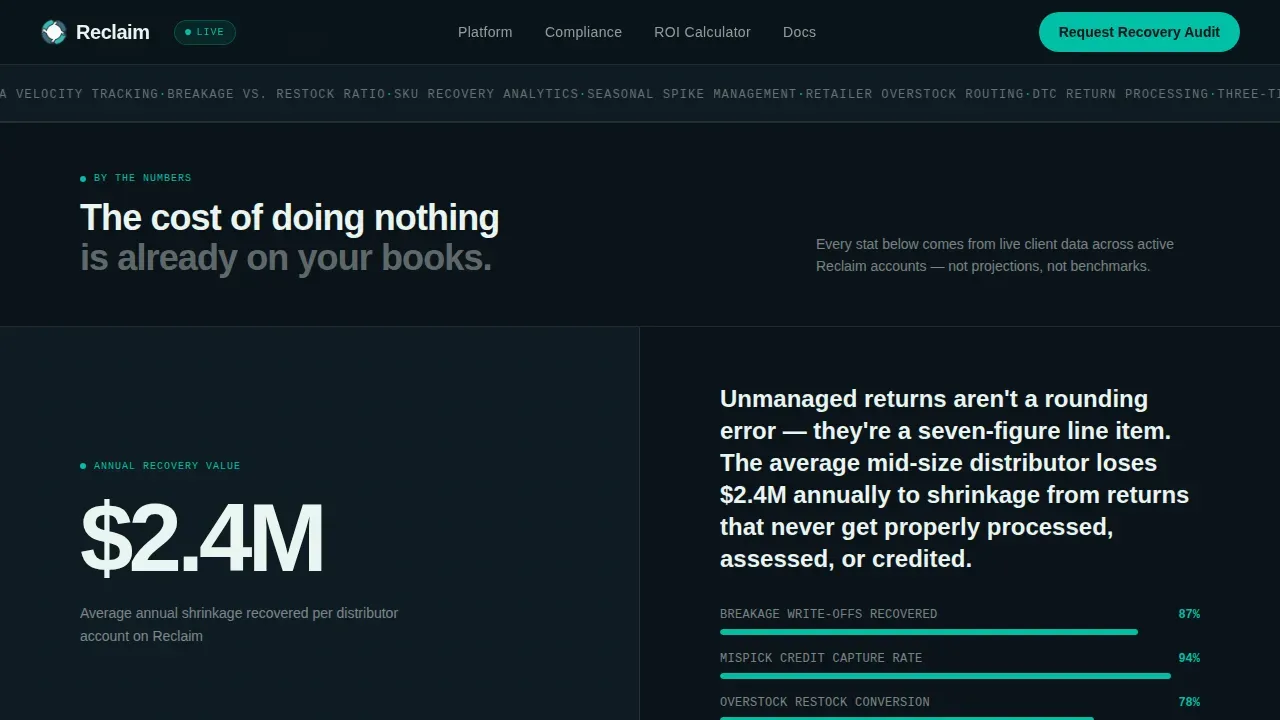
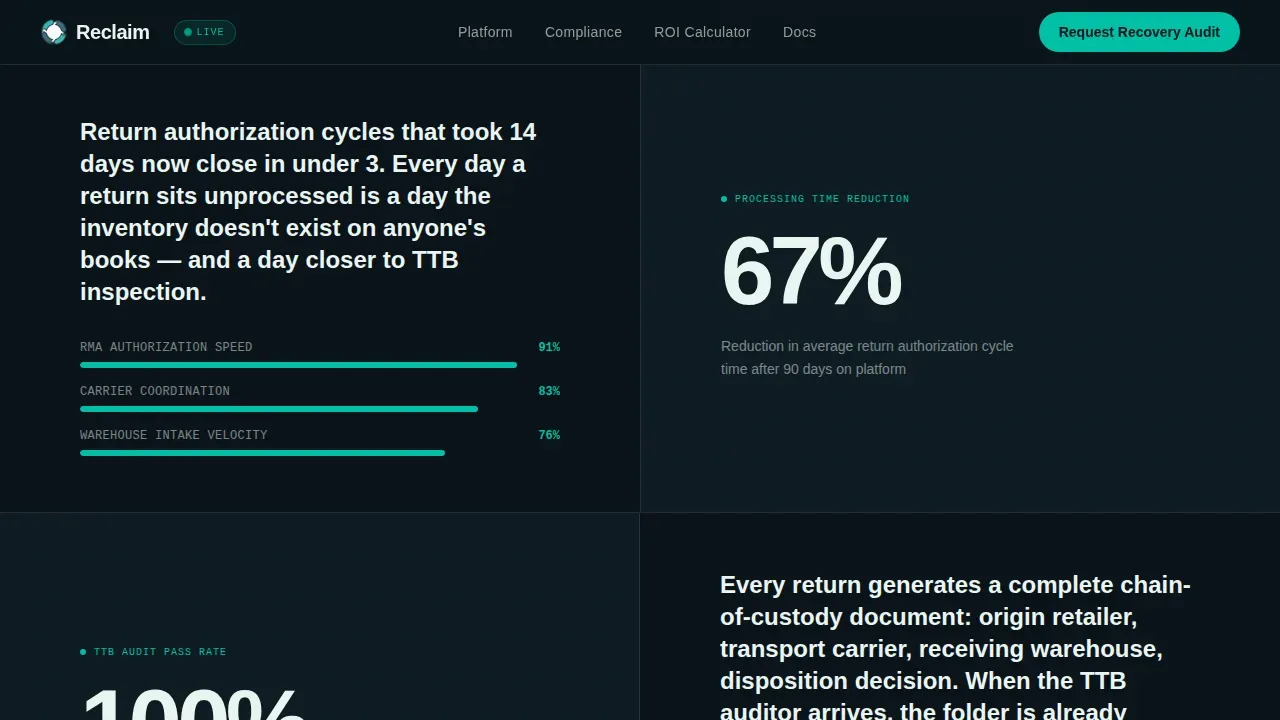
- Stats-first scroll sections that open with massive recovery numbers, recovery dollars saved, processing time reduction, audit pass rate, before revealing the operational context behind each figure
- Two conversion forms: a primary "Request a Recovery Audit" form with dropdown fields for return volume and distribution footprint, and a secondary "Download the Shrinkage Calculator" gated PDF path for leads not yet ready to commit
Feature list
This template delivers specific, prompt-backed features designed for wine and spirits reverse logistics operations. Each section, component, and visual element has a clear job to do.
Live-Style Reverse Logistics Dashboard Header
The hero section presents a split 50/50 layout. The left panel displays a live-style reverse logistics dashboard with labeled metrics: 14,327 units in transit, a 99.2% recovery rate, an average processing time of 3.1 days, and a heat map of return origins across distribution states. Every data point uses units that compliance managers and supply chain managers recognize, SKU recovery percentages, RMA velocity, and breakage-versus-restock ratios. The right panel carries the headline "Every Bottle Has a Way Back" in bold signal white, with the primary call to action anchored directly below it. This is not a decorative header, it is a data-first presentation that earns trust before a visitor reads a single paragraph.
Stats-First Impact Scroll Sections
Each scroll section opens with a massive statistic on the left panel, recovery dollars saved, processing time reduction, audit pass rate, before the right panel delivers the operational context behind the number. The narrative escalates from individual bottle tracking to full portfolio-level analytics. The structure builds the case, number by number, that unmanaged returns in the wine and spirits reverse supply chain are already a seven-figure margin leak. This approach helps companies present their value story clearly, making complex information immediately legible to a busy operations lead or brand controller.
Before-and-After Comparison Section
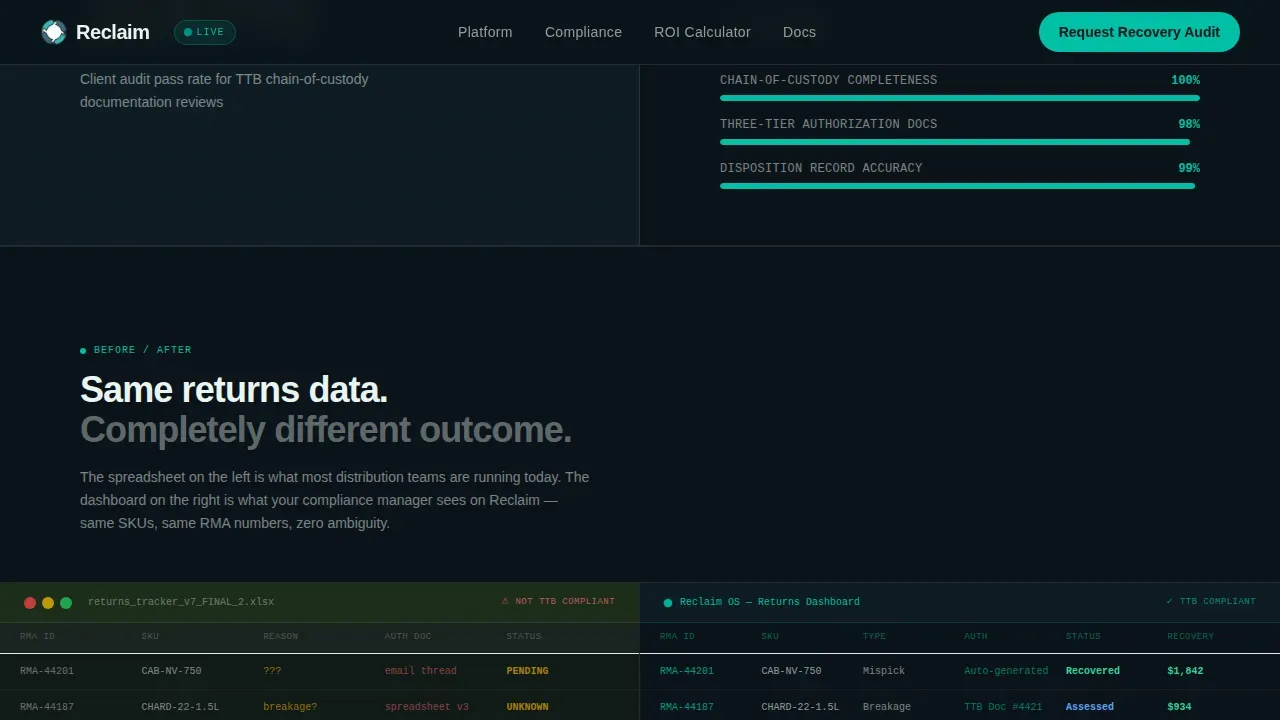
Midpage, a side-by-side visual comparison splits the screen between a chaotic spreadsheet workflow and the Reclaim reverse logistics dashboard view of the same data. The contrast is immediate and visceral. This section directly addresses the core frustration of supply chain managers who are managing returns across dozens of retail accounts using disconnected tools. Seeing the same inventory details presented in two radically different formats, one a mess of rows, one a clean dashboard with order status indicators, does the persuasion work that paragraphs alone cannot.
Dual Conversion Form Architecture
The template includes two distinct conversion paths. The primary form captures company name, estimated monthly return volume (via dropdown: under 500 cases, 500 to 2,000 cases, or 2,000 or more cases), distribution footprint measured in state count, and a direct work email. This is positioned first alongside the hero dashboard, then anchored again after the ROI comparison section. The secondary path offers a gated "Download the Shrinkage Calculator" PDF for leads not yet ready to engage directly. Both paths are designed to deliver value before asking for commitment.
Trust and Compliance Documentation Section
A dedicated section addresses chain-of-custody documentation, TTB audit trail records, and three-tier authorization paperwork. This section speaks directly to the regulatory reality that wine and spirits companies face, unique regulatory hurdles that other industries do not encounter. The RMA portal initiation flow, return label tracking, and various order status indicators are all present. Companies can use this section to dispense information about their compliance posture and demonstrate that their reverse logistics management process is audit-ready at every step.
Footer and Social Proof Components
The footer follows a Pattern 1 Linear Single-Row layout. Social proof components throughout the page include recovery metrics, audit pass rates, processing time statistics, and space for client testimonials. Case studies that showcase reduced leakage or improved recovery rates are built into the presentation structure, with designated placement for client logos from Tier 1 wineries, distributors, and large-scale retail partners. These components collectively build the credibility that B2B buyers need before they submit a form or download a resource.
Page sections overview
| Section | Purpose |
|---|---|
| Hero Dashboard Split | Live metrics left, headline and primary call to action right |
| Stats Impact Row | Opens with recovery stat, reveals operational context |
| ROI Comparison Panel | Spreadsheet chaos versus clean dashboard view |
| Compliance Trust Section | Chain-of-custody, TTB audit trail, three-tier docs |
| Primary call to action Form | Recovery Audit request form with dropdown fields |
| Shrinkage Calculator Gate | Secondary PDF lead capture for early-stage prospects |
| Social Proof Strip | Testimonials, recovery metrics, and client logos |
| Footer Row | Linear single-row footer with navigation and legal links |
Design & branding system
The visual identity follows a Data Command theme using the Teal Catalyst color system. The palette is built to feel like the glow of a warehouse management terminal in a temperature-controlled facility, clinical, awake, and running twenty-four hours without blinking.
- Colors: deep operations black (#0B1419) for backgrounds, primary teal (#00BFA6) for live status indicators and key call-to-action elements, cool slate (#3B4F5C) for data surface panels, and signal white (#EAF5F2) for typography and card backgrounds
- Typography: Manrope for display headings to deliver authority and clarity, JetBrains Mono for all data and metrics to reinforce the terminal-grade aesthetic, font size choices are intentional, with large display numerics for stats and compact mono for dashboard figures
- Animation and interactivity are set to high: pulsing teal indicators, scroll-reveal stats, marquee banners, parallax depth on hero panels, and staggered number counters for the Stats-First Impact sections
Mobile & speed optimization
Although this template is desktop-first by design, because distribution compliance managers and brand controllers primarily work on workstations, the layout is built to remain functional across screen sizes. The 50/50 split-screen panels stack cleanly on smaller viewports without losing the dashboard readability that makes the page credible.
- Server Components handle all static content sections for efficient rendering, while Client Components manage animations, the live-style dashboard indicators, and the calculator modal interactivity
- The form with its dropdown fields, the gated PDF modal, and the various order status displays within the dashboard panel are all built as interactive Client Components to keep the experience smooth and responsive
How this template helps you convert
The conversion architecture is built on a simple principle: prove the cost of inaction before asking for a commitment. Every section earns the next click by presenting a number, a contrast, or a compliance consequence that makes doing nothing feel expensive.
- The hero reverse logistics dashboard opens with live-style metrics that immediately validate the product, a compliance manager sees familiar key performing indicators (KPIs) like recovery rate and RMA velocity, and trusts that this system understands their world before they read a single word of copy
- The Stats-First Impact sections escalate the case from individual SKU tracking to portfolio-level financial performance, showing that inefficient returns management is not just an operations inconvenience but a measurable, recoverable revenue gap, building urgency toward the "Request a Recovery Audit" call-to-action
- The dual form architecture captures leads at both ends of the buying journey: the direct audit request form for buyers who are ready, and the Shrinkage Calculator download for those who need to build the internal business case first, enhancing customer satisfaction with the evaluation process itself before any sales conversation begins
Other information about this template
This template sits at the intersection of wine and spirits compliance, B2B SaaS presentation design, and modern reverse logistics dashboard visualization. It is built for companies who need a landing page that does real work, not just a brochure.
- The completely editable template structure means every data label, stat, color, and copy block can be updated to reflect your actual reverse logistics operations metrics, return policies, and sales territory footprint
- Editable templates like this one are especially valuable for operations teams that need to present a reverse logistics dashboard to internal stakeholders or external partners, the layout is already optimized to dispense information clearly and quickly
- The template is professionally designed using best practices for reverse logistics dashboard templates: clean layout, consistent color scheme, legible data hierarchies, and clear action paths, making complex information accessible without cognitive overload
- For teams that also need to present internally, the visual structure translates well to a completely editable PowerPoint presentation or Google Slides deck for stakeholder meetings, where the same reverse logistics dashboard data can be presented in slide format
- Topics discussed within the page include the reverse logistics process from RMA initiation through disposition decision, the five Rs framework (Recognize, Return, Repair, Recycle, Reclaim) as applied to alcohol products, excise tax reclamation for returned or destroyed spirits, and the environmental impact of responsible disposal and glass bottle reclamation
- The Rapid Recall module concept built into the template uses captured data to identify impacted batches quickly, a critical component for companies managing product recalls or vintage mispicks across a wide retail footprint
- Return categorization is a core part of the process presented: the template supports visual presentation of how returned products are classified (unopened, corked, minor defects, damaged label, or broken) to drive disposition decisions and determine whether units qualify for restock, repair, recycle, or end-of-life disposal
- Businesses in other industries have demonstrated the value of structured reverse logistics strategies: for example, companies like Cosgra repair damaged products to restore them to working condition, while others recycle goods that do not meet repair or resale standards, the same principles deliver competitive advantage in the wine and spirits supply chain
- The immediate download path for the Shrinkage Calculator is designed to capture name and email only, making it a lower cost entry point for leads who need to build a business case before requesting a full recovery audit
- Barcode scanning and RFID capabilities for logging SKUs, lot numbers, and original purchase dates are presented within the dashboard section as important parameters of the recognition phase, giving operations teams the inventory details they need to act fast on returned goods
- The template supports strategic alliances and partnership narratives, presenting your company as a trusted supply chain partner rather than a transactional vendor, a key element of reverse logistics strategies that focus on long-term customer relationships and reduce costs across the reverse supply chain
- Various order status indicators, return labels, and RMA velocity figures are all present as labeled components within the dashboard section, ensuring that every important aspect of returns management is visually accounted for
Theme
Data Command
Creative direction
Stats-First Impact
Color system
Teal Catalyst
Style
Split Screen (50/50)
Direction
Partnership/B2B
Page Sections
Live-style Dashboard Hero Panel
Stats-first Impact Scroll Sections
Before-and-after Comparison Panel
Dual Conversion Form Architecture
Compliance and Chain-of-custody Section
Social Proof and Client Credibility Components
Related questions
What types of wine and spirits companies is this landing page template built for?
Does the template include both a lead capture form and a content download path?
How is the reverse logistics dashboard section structured within the template?
Can the template data and copy be updated to match our actual operations metrics?
How does the comparison section help communicate the value of a structured returns process?