Restaurant Software Reviews & Social Proof Website Template
Route is a bold brutalist landing page template built for restaurant route optimization platforms. It uses a dashboard-style data grid layout with a carbon fiber color system to present delivery metrics at war-room scale. The design is built for multi-unit operators, ghost kitchen networks, and fleet managers who need to show evidence, not just pitch.
by Rocket studio
Quick summary
Route is a single-page brutalist landing page template designed for restaurant route optimization platforms. It opens with a live-format metrics wall and scrolls through head-to-head data grids in a spec sheet cadence. The carbon fiber palette keeps every panel dark and every number sharp. No illustrations, no storytelling, just delivery evidence, row by row.
Who this template is for
This template is built for logistics-focused software teams that sell to the restaurant and delivery industry. It works best when your product wins on performance data and your buyer responds to numbers over narrative.
- Multi-unit restaurant operators managing fifteen or more locations who need real-time route efficiency
- Ghost kitchen networks running multiple brands from a single address with complex dispatch demands
- Regional delivery fleet managers tracking fuel costs and per-mile margins across a large vehicle pool
What problem this template solves
Most software landing pages rely on hero images and benefit copy to earn trust. For route optimization tools, that approach misses the buyer. Fleet managers and operations directors want proof, not persuasion. This template is built around that reality.
- Generic marketing pages cannot show delivery performance data at the scale decision-makers expect
- Buyers comparing routing platforms need side-by-side metrics, not paragraphs, to justify a switch
- Standard templates lack the visual urgency of a live dispatch environment, which weakens credibility with technical operators
What you get with this template
You get a complete, single-page layout structured around comparison-driven conversion. Every section is designed to make the visitor's current routing solution look slow before they reach the primary call to action.
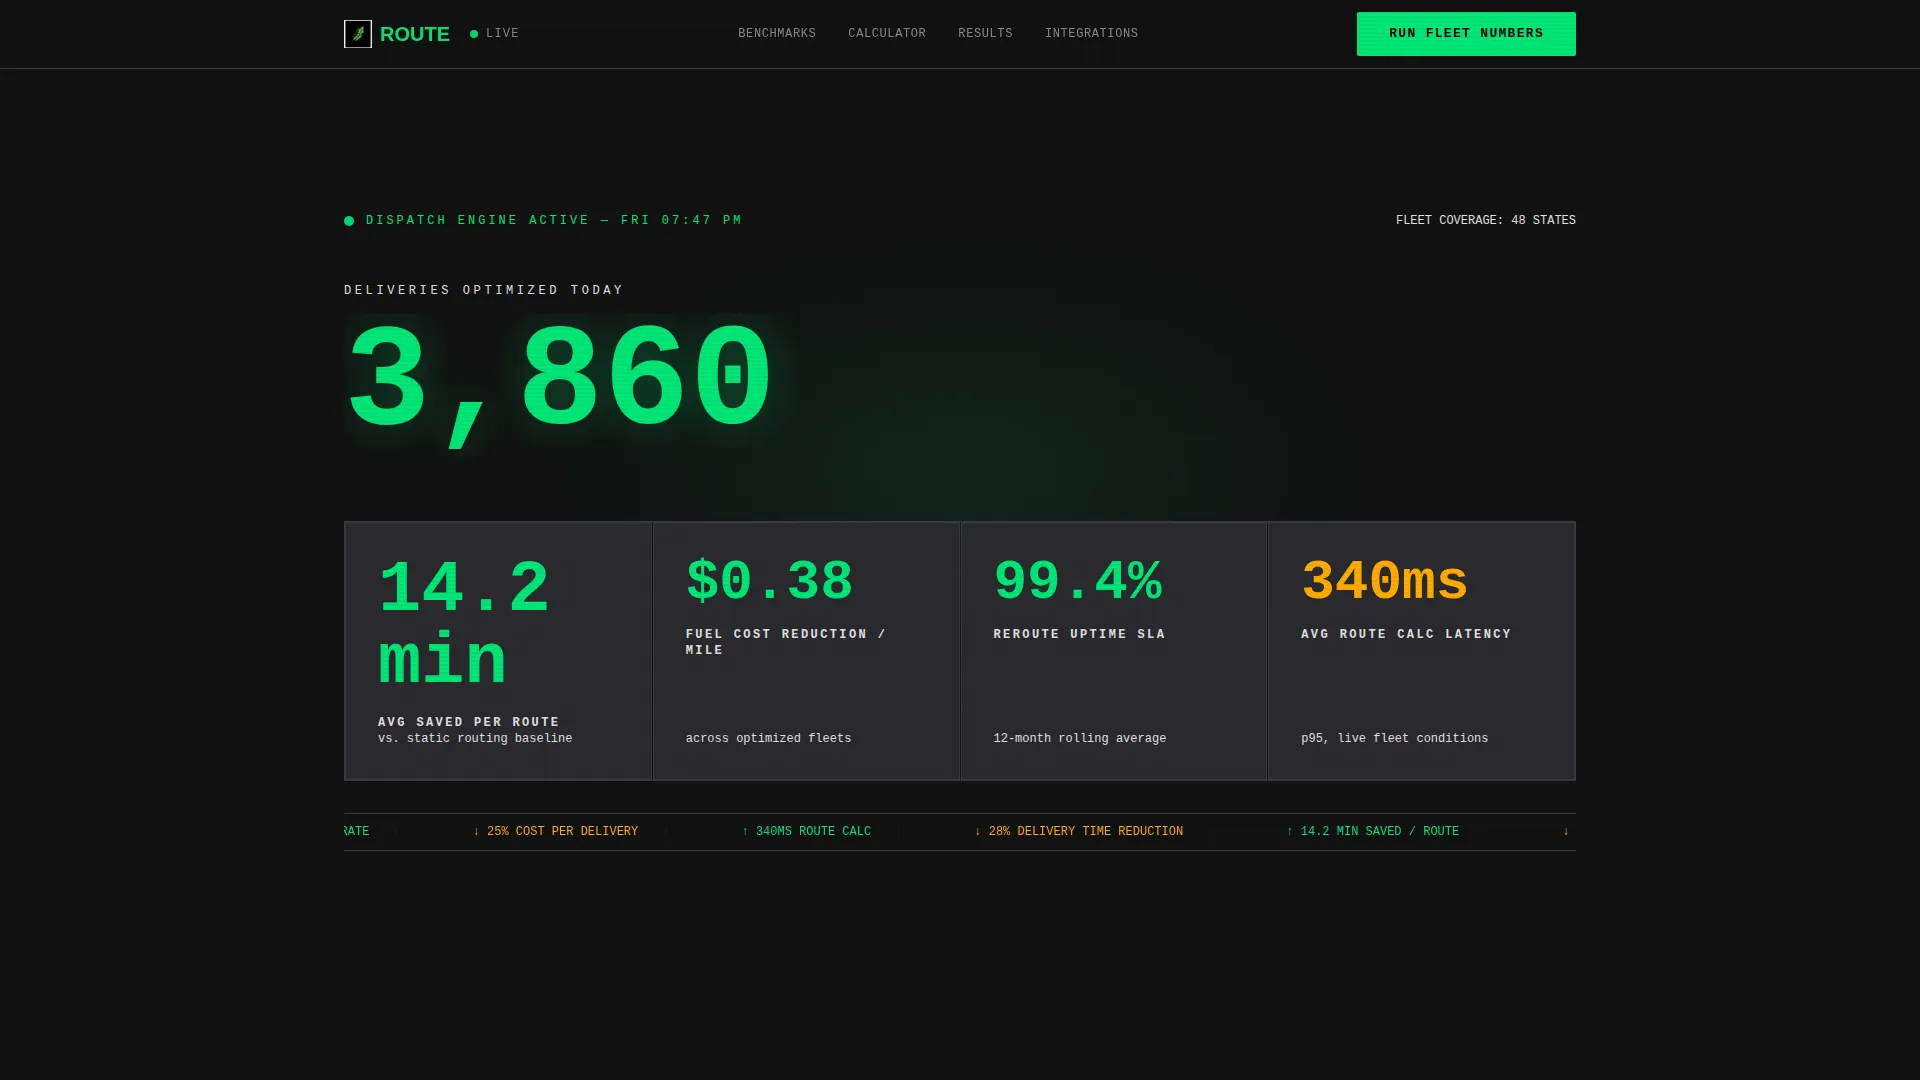
- A dense stats wall header with oversized monospaced numbers and an animated route count ticker
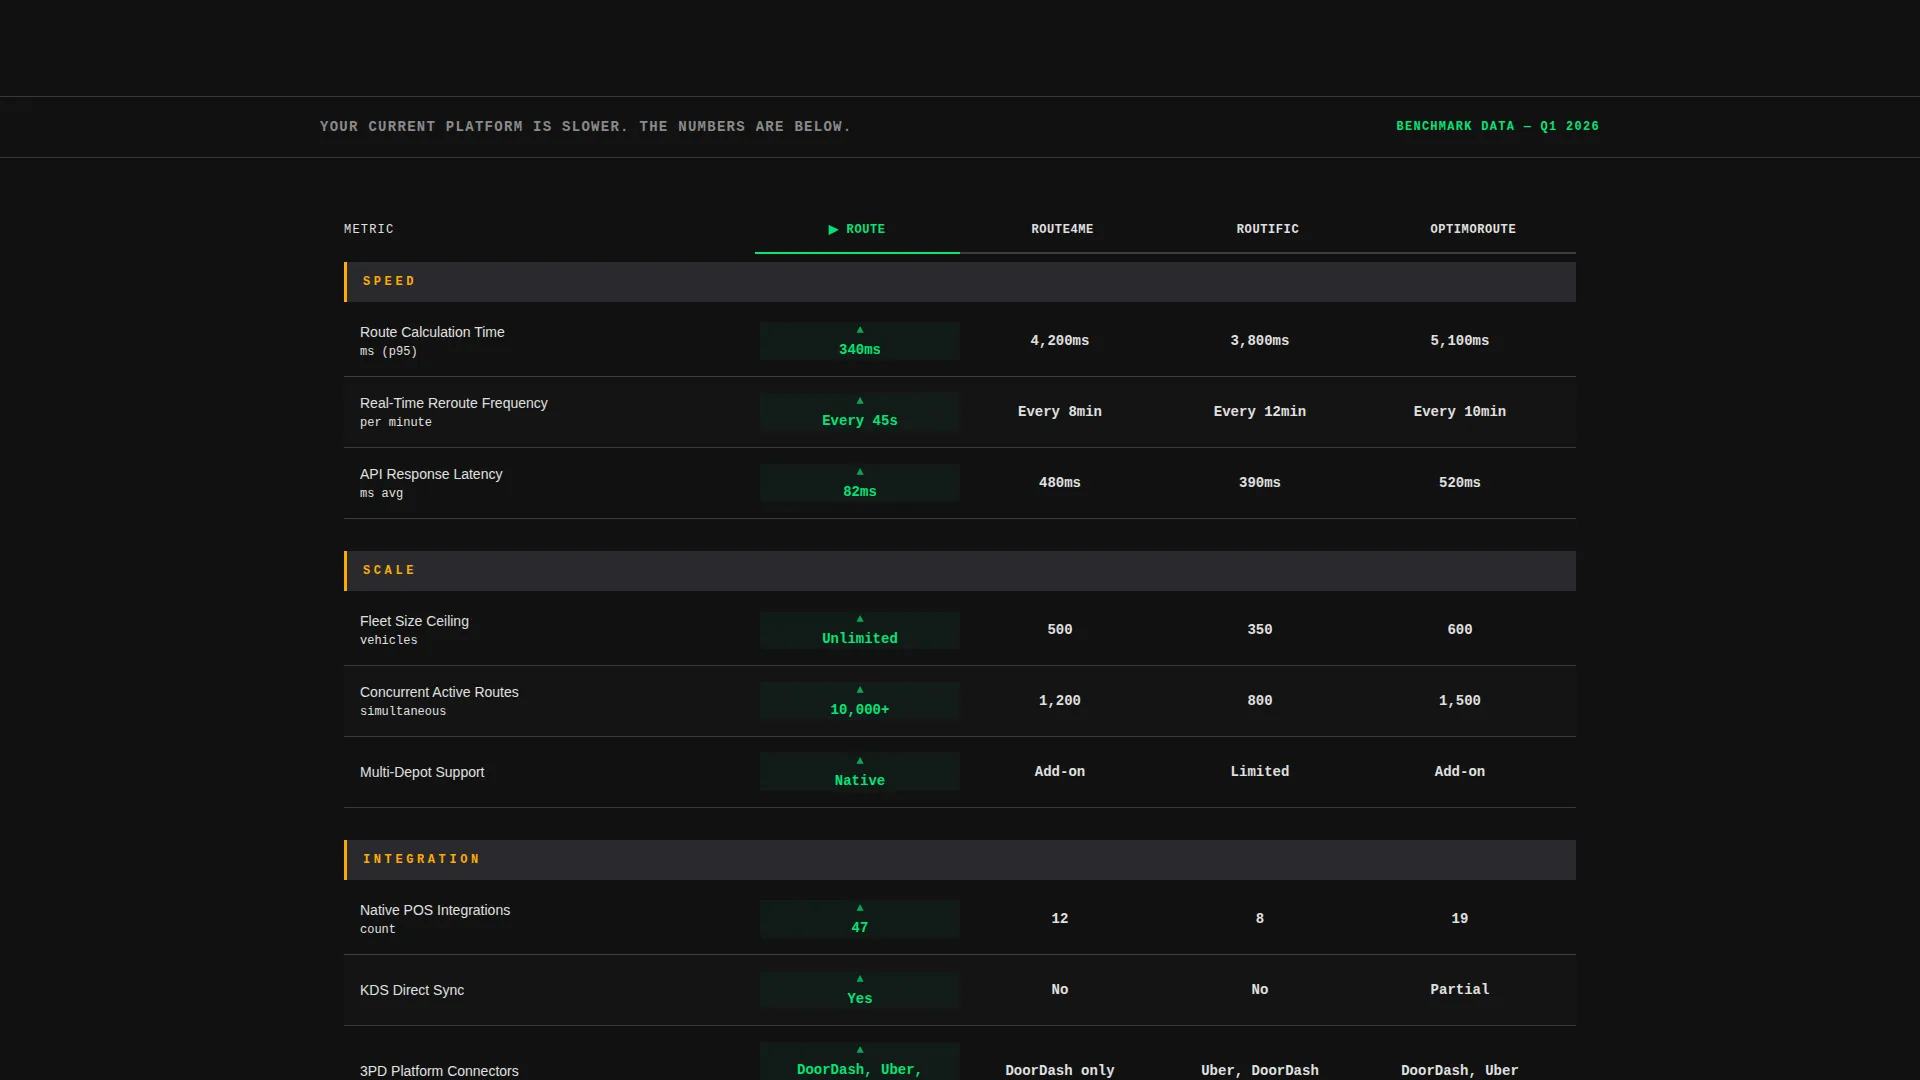
- Head-to-head data grids comparing your platform against current routing methods and competing tools across key metrics
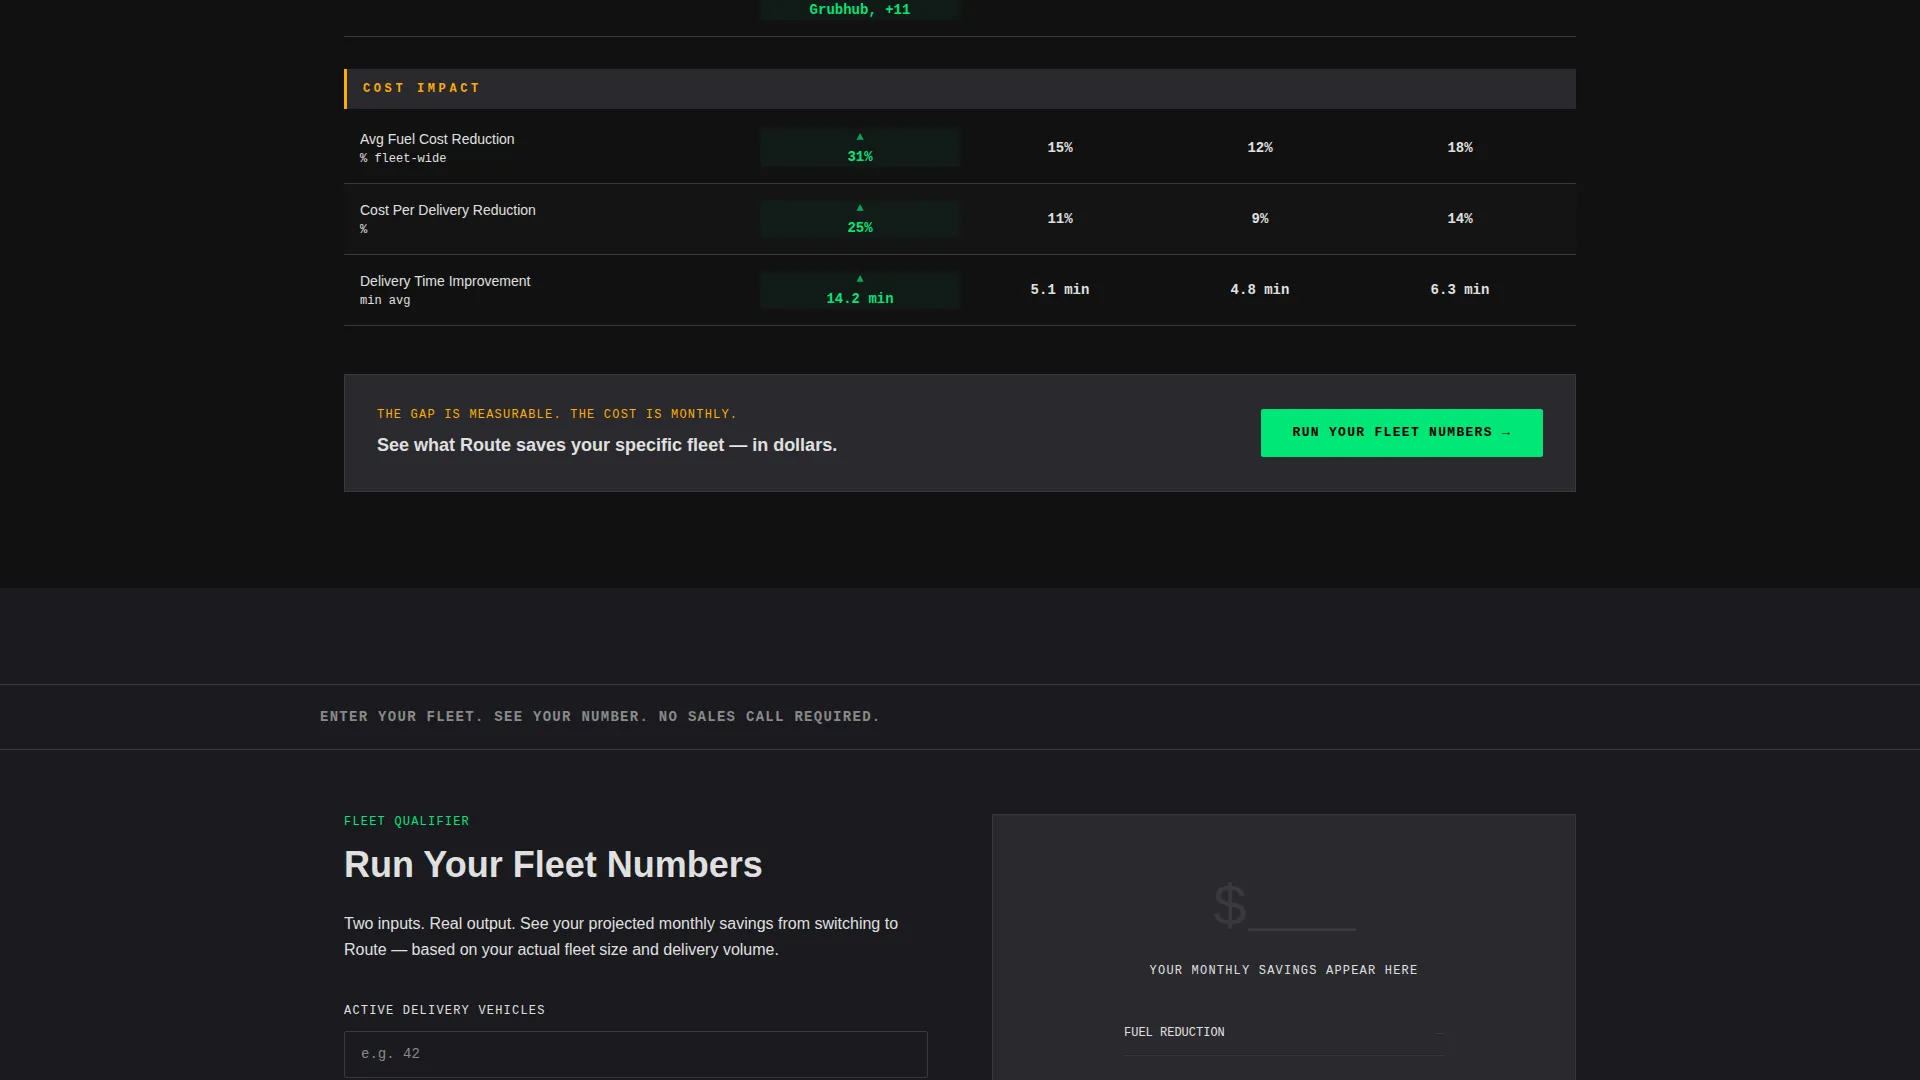
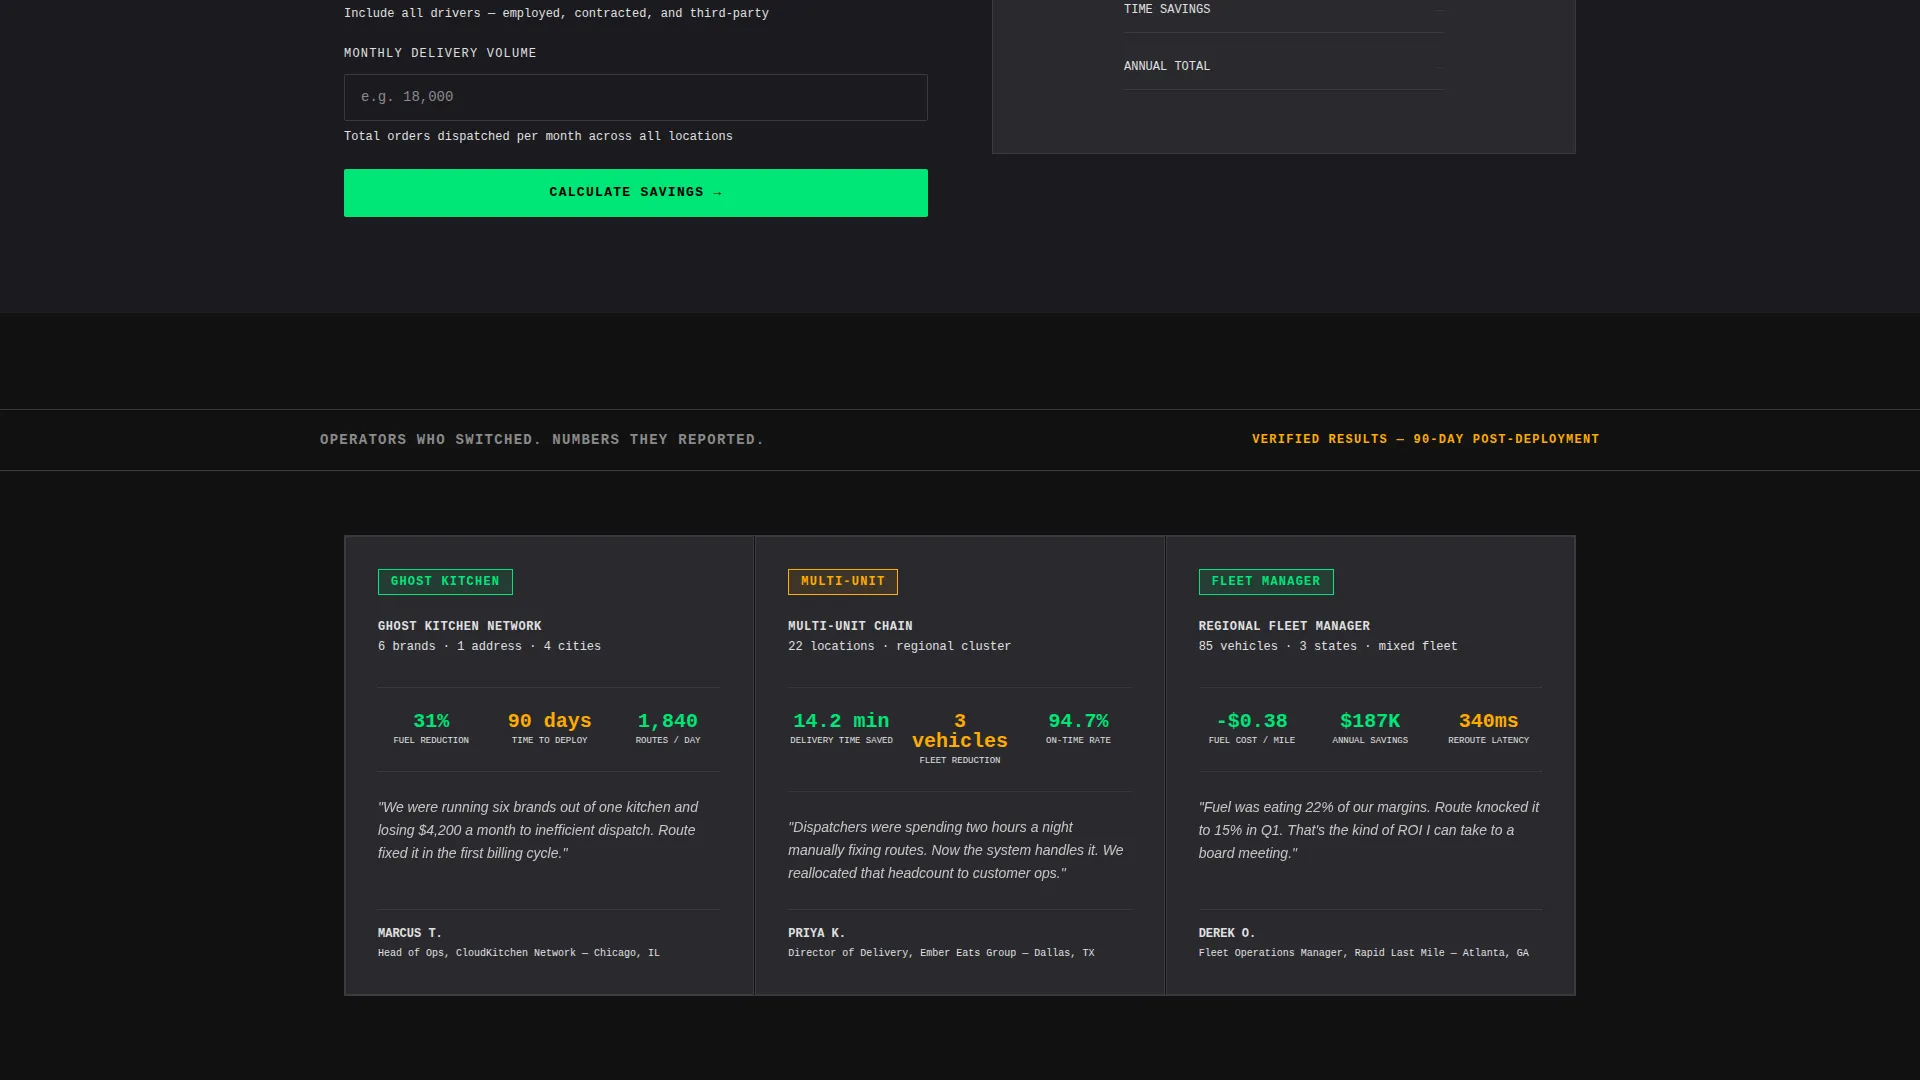
- A persistent bottom-bar call to action and a two-field qualifier form for fleet size and monthly delivery volume
- A gated secondary path offering a benchmark PDF download behind a business email field
Feature list
This template includes a focused set of components built specifically for high-stakes, data-forward conversion in the restaurant logistics space.
Live-Format Stats Wall Header
The header replaces a traditional hero section with a dense grid of oversized performance numbers. Metrics like average time saved per route, daily deliveries optimized, and fuel cost reduction per mile are typeset in monospaced type at billboard scale. An animated counter ticks upward in real time to reinforce platform activity.
Head-to-Head Comparison Data Grids
Two full-width data grid sections lay your platform's metrics against competitor platforms column by column. Metrics include route calculation speed, real-time reroute frequency, API latency, fleet size ceiling, and integration count. Numbers are color-coded in high-vis green for wins and warning amber for competitor gaps.
Brutalist Section Dividers
Between data grids, single-sentence callouts in all-caps function as section dividers. These act like chapter breaks in a technical document, keeping the scroll rhythm tight and the tone mechanical without adding decorative elements.
Persistent call to action Bar
A bottom-viewport call-to-action bar stays fixed as the visitor scrolls. The primary action, labeled "Run Your Fleet Numbers," opens a two-field qualifier asking for active vehicle count and monthly delivery volume. This keeps conversion intent visible at every scroll depth.
Gated Benchmark PDF Path
A secondary conversion path offers a downloadable benchmark PDF gated behind a business email field. This gives buyers who are not yet ready to commit a lower-friction way to engage with the platform's data.
Carbon Fiber Dashboard Color System
The full page uses a carbon fiber palette with matte black backgrounds, gunmetal panel cards, off-white text, high-vis green for positive metrics and primary actions, and warning amber for alerts and hover states. The system is visually consistent with the cockpit of a commercial vehicle at night.
Page sections overview
| Section | Purpose |
|---|---|
| Stats Wall Header | Opens with oversized live delivery metrics to establish platform credibility immediately |
| Callout Divider One | All-caps single-sentence break that frames the first comparison |
| First Data Grid | Side-by-side metric comparison of Route versus current routing methods |
| Primary call to action Bar | Persistent bottom bar with the "Run Your Fleet Numbers" qualifier form |
| Callout Divider Two | All-caps single-sentence break that frames the second comparison |
| Second Data Grid | Side-by-side metric comparison of Route versus competing platforms |
| Benchmark PDF Gate | Secondary conversion path offering downloadable data behind email capture |
Design & branding system
The design language is bold brutalism applied to a logistics dispatch context. Nothing on the page is decorative. Every visual choice reinforces the feeling of a live operations environment running at capacity.
- Carbon fiber palette: matte black (#121212) backgrounds, gunmetal panel gray (#2A2A2E) cards, off-white (#E0E0E0) body text, high-vis route green (#00E676) for positive metrics and primary actions, and warning amber (#FFAB00) for alerts and interactive hover states
- Monospaced typography at billboard scale for all headline metrics, maintaining the mechanical precision of a dispatch screen
- No hero images, no illustrations, and no decorative elements, layout density and data hierarchy carry all visual weight
Mobile & speed optimization
The template is structured for fast load performance given its content-first, image-free layout. Dark backgrounds and text-based components avoid the overhead of large media assets.
- No hero images or illustration files means the page stays lightweight and renders quickly on mobile browsers
- Data grid layouts are designed to reflow at smaller viewport widths so metric comparisons remain readable on phones and tablets
- The persistent call to action bar is sized for touch interaction and stays anchored at the bottom of the viewport across screen sizes
How this template helps you convert
Route is built around a comparison-first conversion model. The page earns the click by making the visitor's current solution look slow before asking for anything in return.
- The stats wall opens with hard delivery numbers at full-page scale, establishing immediate performance credibility before any product copy appears
- Two sequential data grids force a direct metric-by-metric comparison, so the visitor is already evaluating rather than just reading when the primary call to action appears
- The two-path conversion structure, one active qualifier form and one gated PDF download, captures both ready buyers and researchers in a single scroll
Other information about this template
This template is categorized under Technology, with a subcategory of Restaurant Software and a niche focus on restaurant route optimization. It is a strong fit for product teams building in the delivery dispatch and fleet management space.
- The template style is a dashboard and data grid layout, which suits any platform that leads with quantitative performance claims
- The spec sheet creative direction means content is structured like a technical document, making it easier for buyers to compare and decide
- The bold brutalist theme and carbon fiber color system differentiate this page sharply from standard SaaS landing page conventions
- This template supports use cases in last-mile delivery software, multi-location restaurant operations, and regional fleet management tools
Theme
Bold Brutalist
Creative direction
Spec Sheet
Color system
Carbon Fiber
Style
Dashboard/Data Grid
Direction
Comparison/Versus
Page Sections
Live-format Stats Wall Header
Head-to-head Comparison Data Grids
Persistent Bottom-bar Call to Action
Gated Benchmark PDF Download
Brutalist Callout Dividers
Carbon Fiber Color System
Related questions
Who is the Route template designed for?
Can I adapt the data grid sections to show my own metrics?
What conversion paths does this template include?
Does this template use images or illustrations?
Is this template suitable for a ghost kitchen network's marketing page?



