Fleet Optimization Bento Grid Landing Page Template
Route is a bento grid landing page template built for automotive route optimization platforms. It features an interactive map preview, animated route recalculation visuals, a live return-on-investment calculator, and a freemium trial conversion flow. The dark Midnight Blue design system makes fleet efficiency data feel urgent and credible, guiding logistics-focused visitors from problem awareness to a no-credit-card signup.
by Rocket studio
Quick summary
Route is a single-page bento grid landing page template designed for fleet optimization platforms. It opens with a live animated map showing routes resolving from chaos into clean dispatch paths. Data-driven sections build a case for change, and a built-in return-on-investment calculator closes the loop before the primary call-to-action.
Who this template is for
This template is built for technology companies and software startups operating in the automotive route optimization space. If your platform helps fleets run leaner, this page communicates that value instantly.
- Regional distribution managers running mid-size van fleets on tight margins
- Last-mile delivery startups looking to reduce redundant mileage and fuel spend
- Field service coordinators scheduling technician visits across large metro areas
What problem this template solves
Most fleet software landing pages lead with feature lists. Visitors do not feel the cost of inaction, so they leave. Route flips that dynamic by opening with live data and escalating toward a personalized savings estimate.
- Fleet operators cannot immediately see how much money poor routing is costing them
- Generic software pages fail to earn the trust of logistics managers who live by numbers
- Conversion paths for technical buyers are often too long and too vague to act on
What you get with this template
You get a fully structured bento grid landing page with every section, visual component, and conversion element already in place. Nothing needs to be built from scratch.
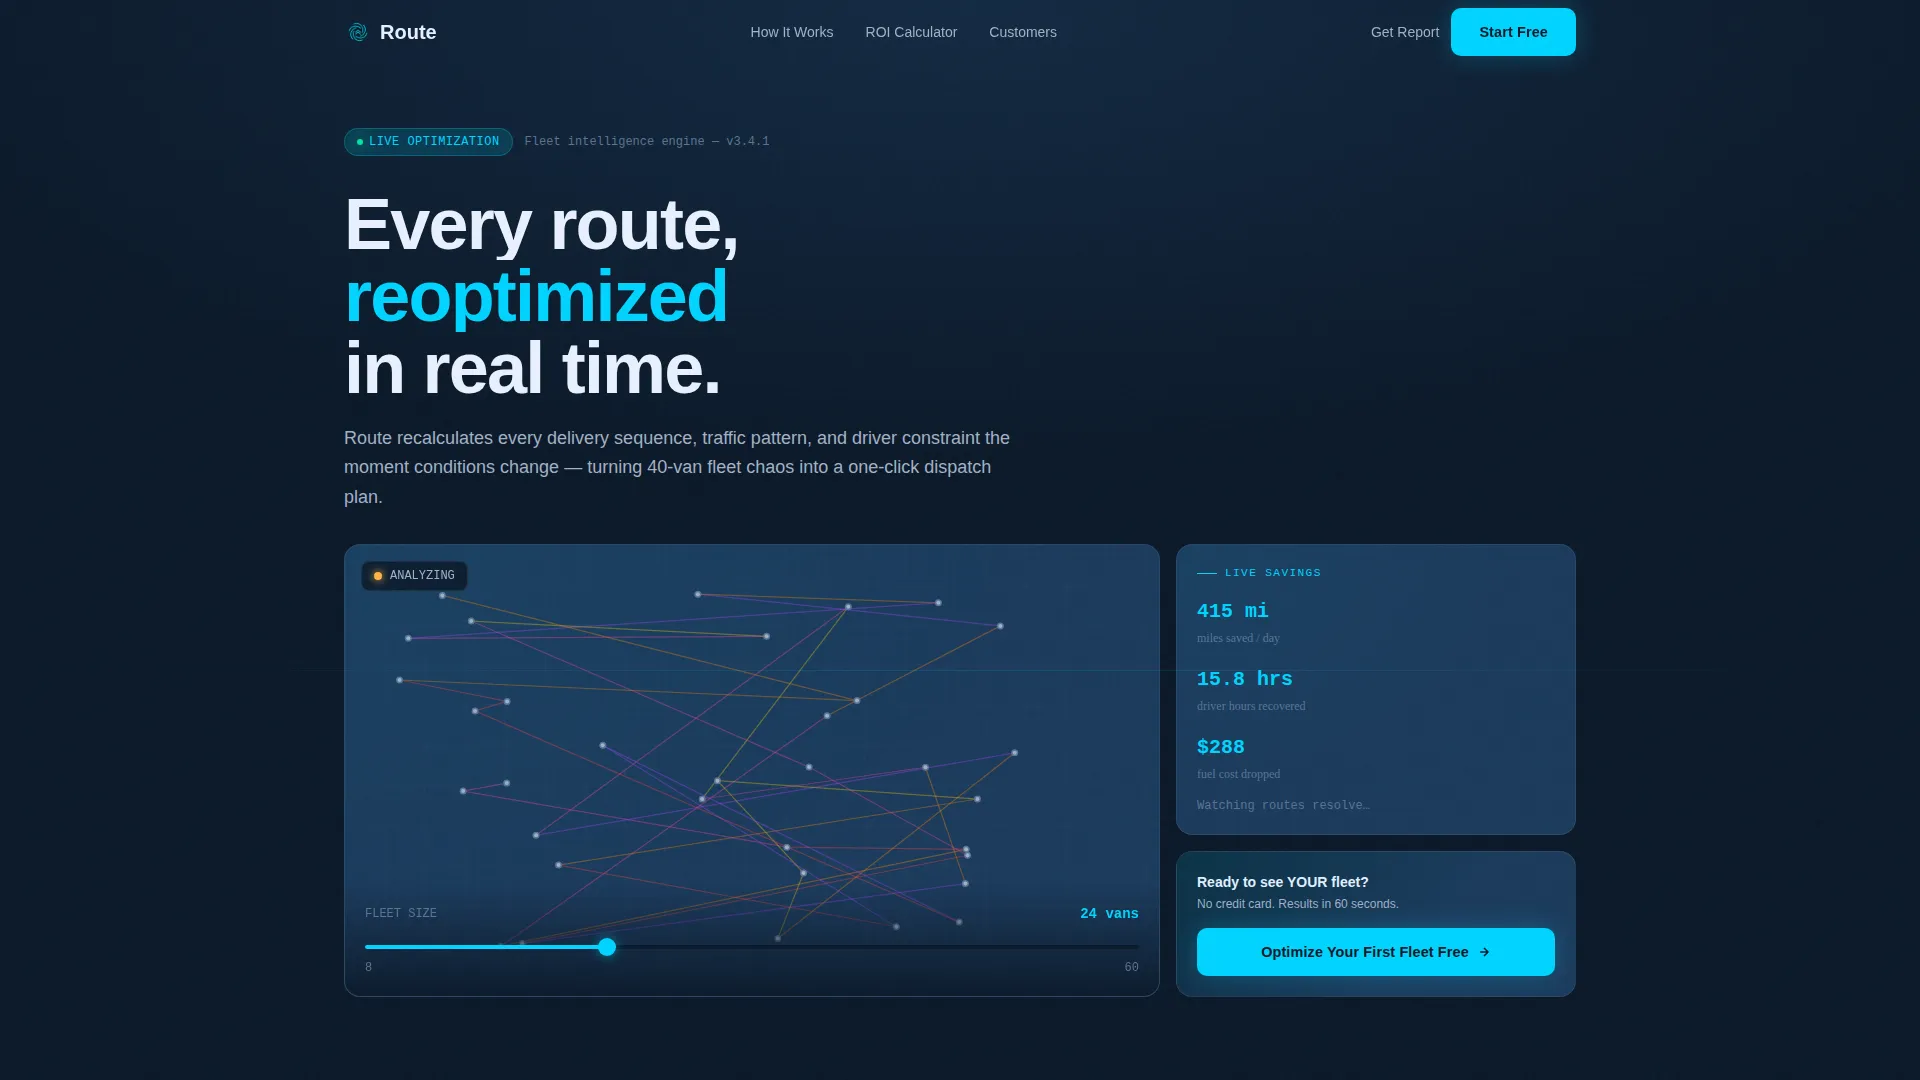
- An interactive header map with animated route recalculation and a draggable fleet-size slider
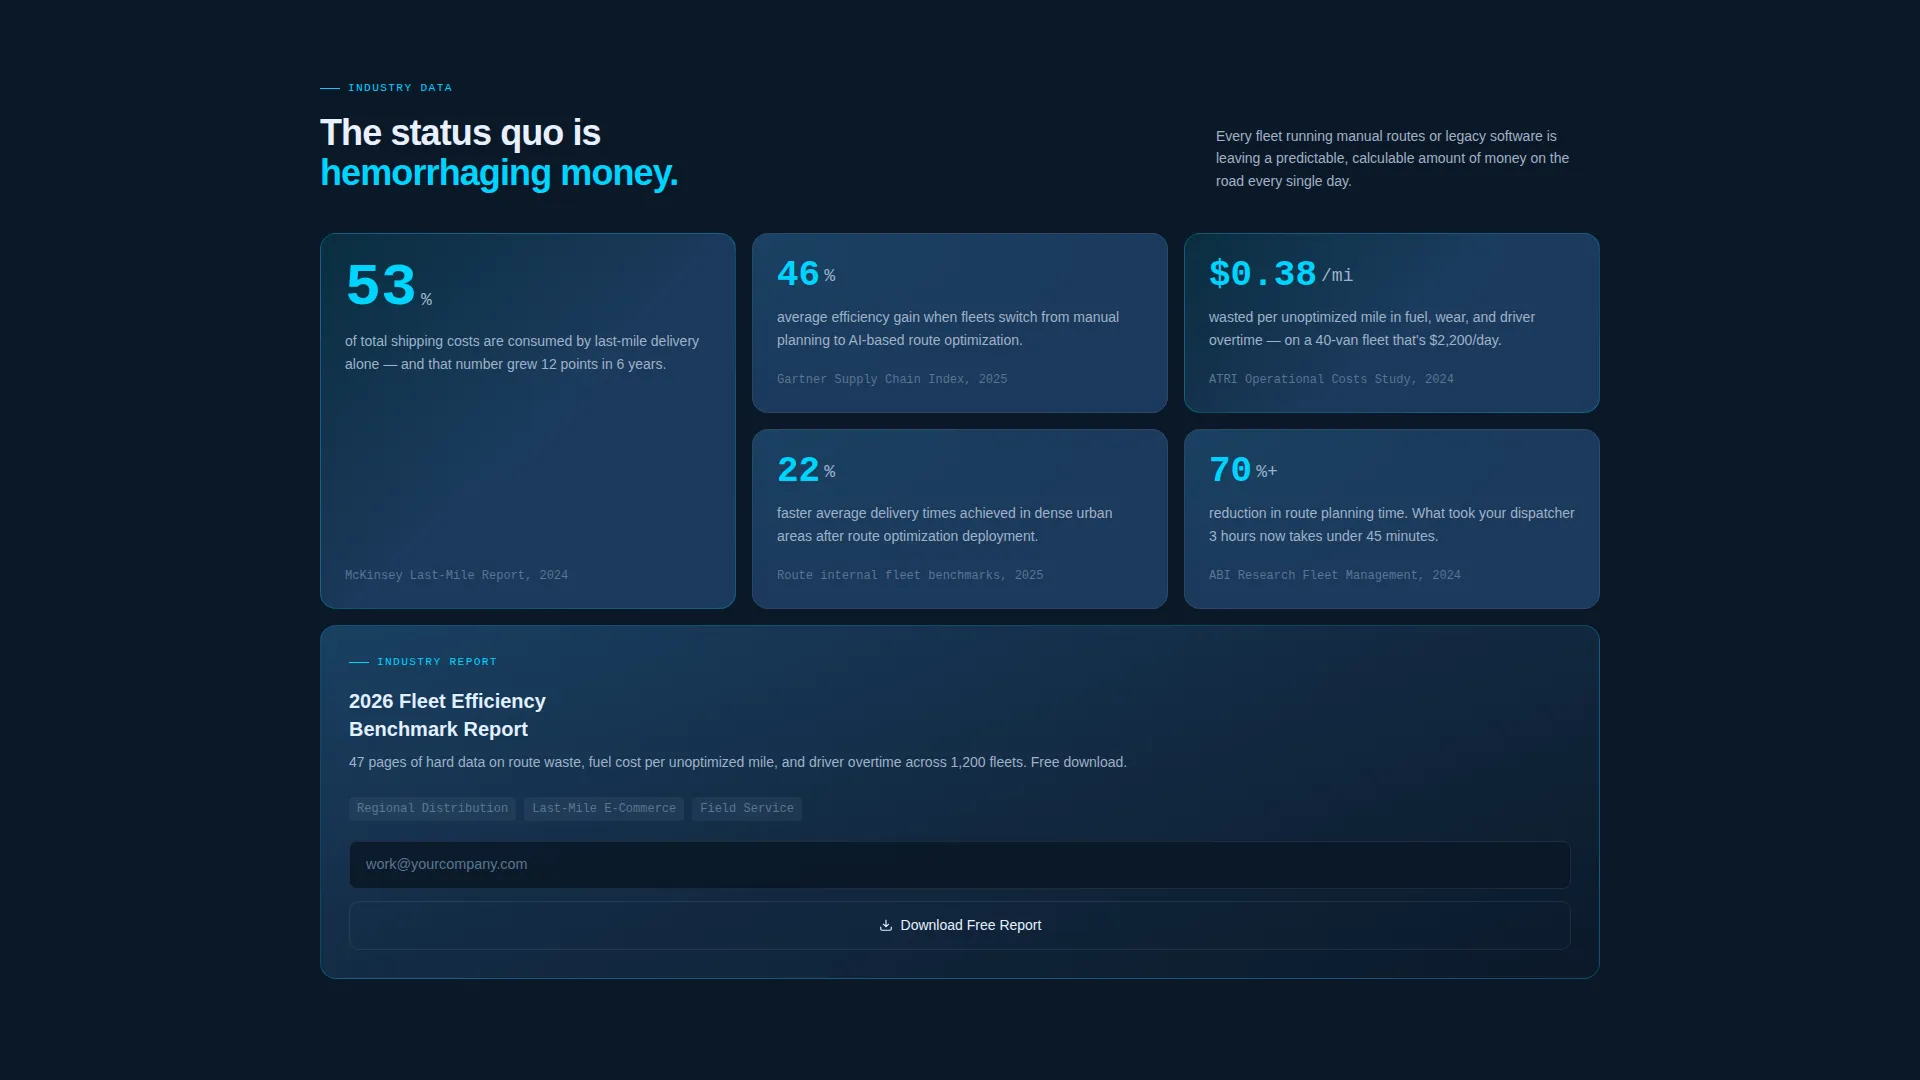
- Industry-report-style data cells showing route inefficiency stats, fuel waste figures, and driver overtime costs
- A live return-on-investment calculator and a dual-path conversion setup for trial signups and lead capture
Feature list
This template packages several purpose-built components that work together to move a skeptical logistics buyer from curiosity to commitment.
Interactive Map Header
The header renders a live-looking metro map viewport. Delivery pins scatter across the screen, then animated route lines redraw from tangled paths into clean, color-coded loops. A floating counter ticks upward showing miles saved, hours recovered, and fuel cost dropped in real time.
Draggable Fleet Size Slider
Visitors can drag a slider labeled "Fleet Size" directly inside the header. The route visualization recalculates on the spot, making the product's core value tangible before the visitor reads a single word of copy.
Bento Grid Data Sections
Scrolling past the header, individual bento grid cells present hard statistics framed as research findings. Each cell covers a distinct cost driver: average route inefficiency percentages, fuel waste per unoptimized mile, and driver overtime by fleet size.
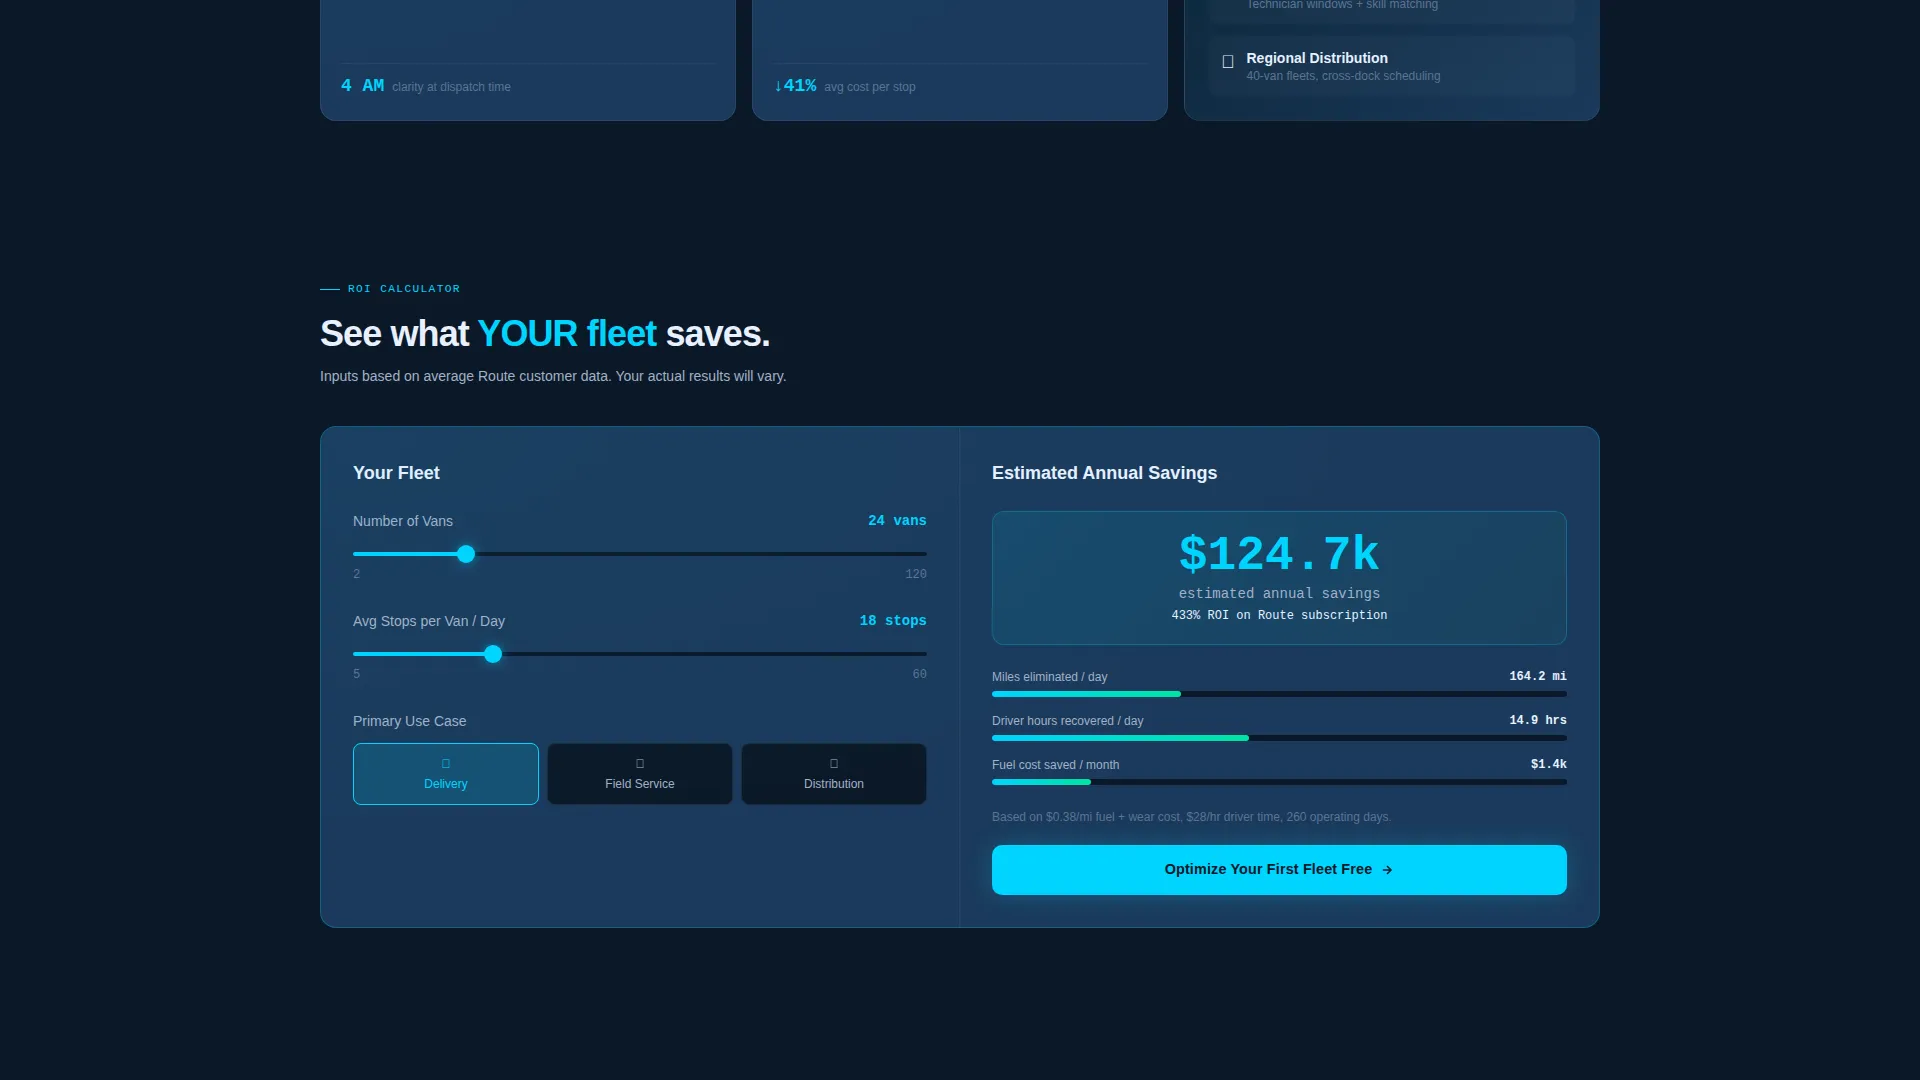
Live Return-on-Investment Calculator
Mid-page, visitors enter their van count and average daily stops. The calculator produces a personalized savings estimate, anchoring the decision to switch in their own fleet numbers rather than generic industry averages.
Dual-Path Conversion Flow
The primary call-to-action, "Optimize Your First Fleet Free," appears inside the header and again after the return-on-investment calculator. A secondary path offers a downloadable industry benchmark report for just an email address, capturing leads who are not ready to trial but are already convinced the problem is real.
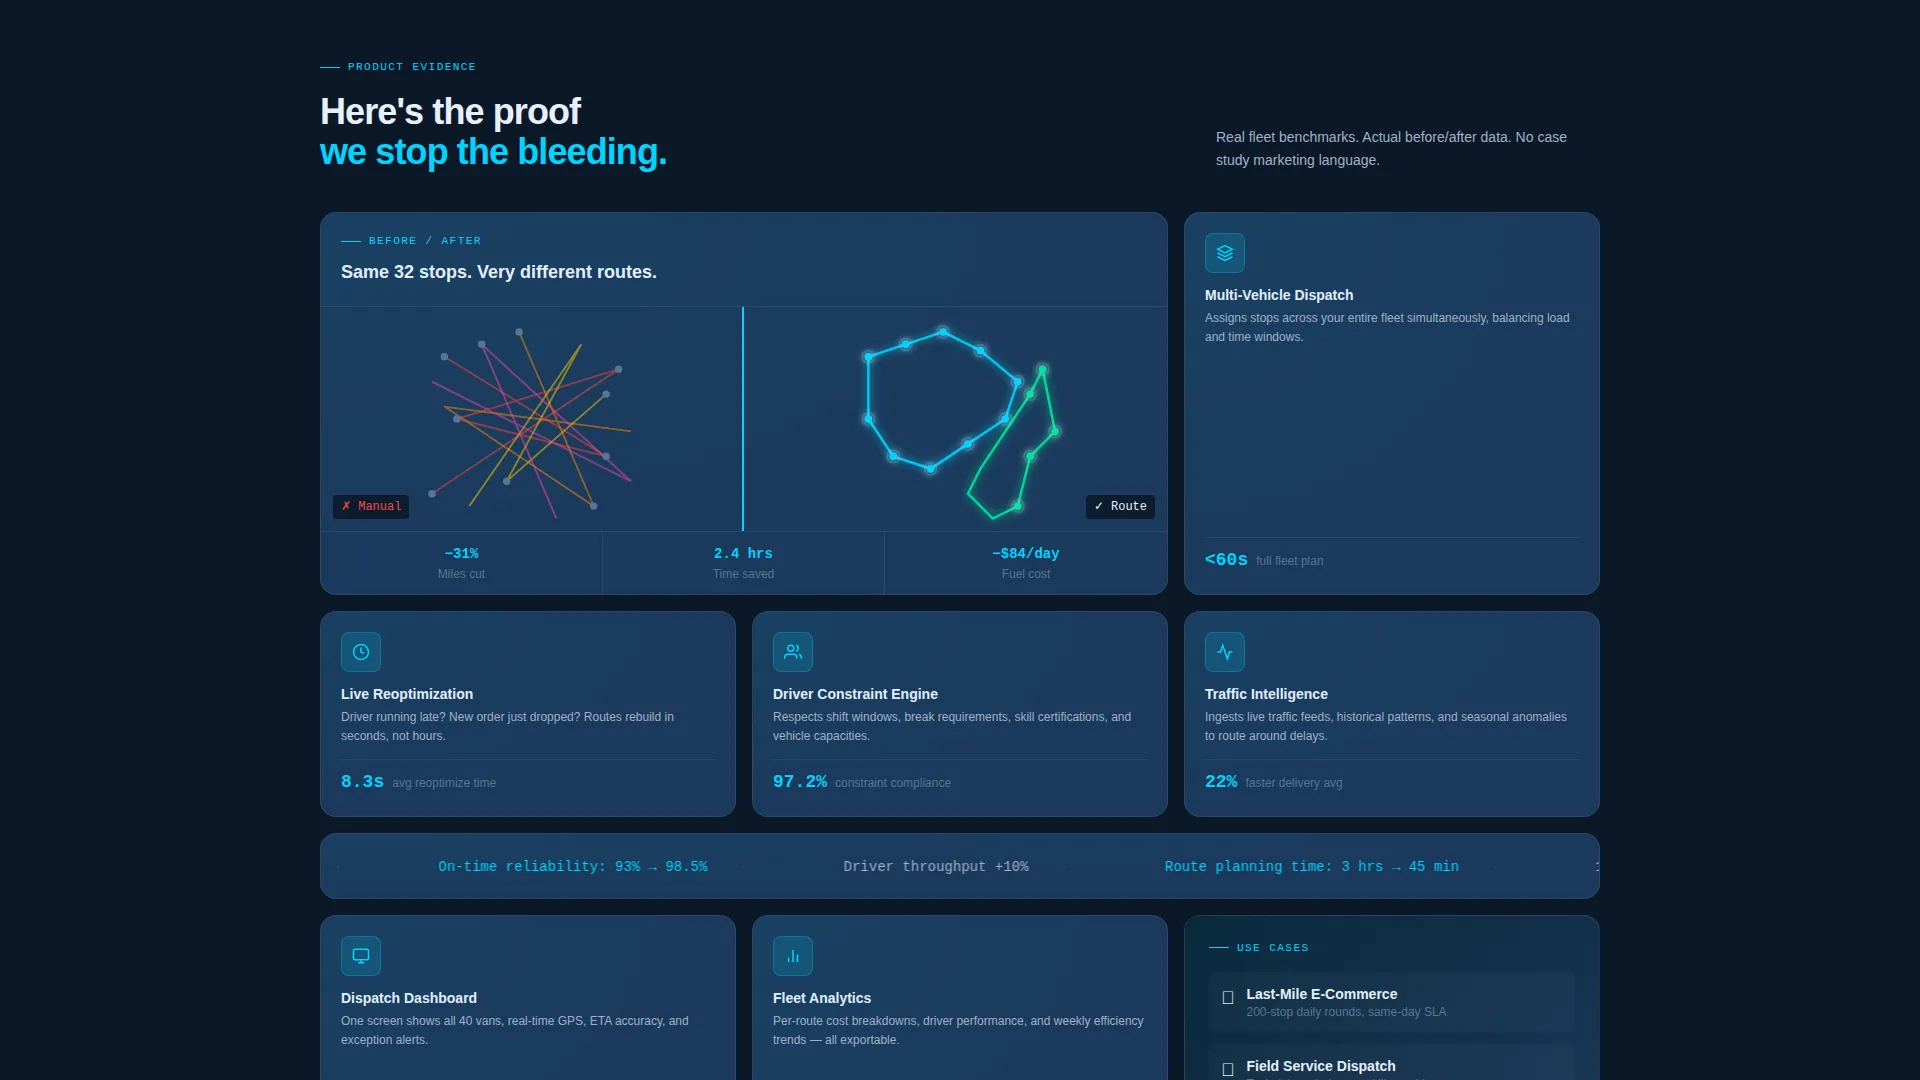
Before-and-After Route Comparisons
Customer fleet benchmark cells show side-by-side route comparisons. Visual evidence of improvement reinforces the data narrative and gives skeptical buyers a concrete reference point for performance claims.
Page sections overview
| Section | Purpose |
|---|---|
| Interactive Map Header | Animates route optimization live and anchors the primary call-to-action |
| Fleet Size Slider | Lets visitors personalize the route preview to their own fleet scale |
| Efficiency Counter | Ticks up miles saved and fuel cost dropped as optimization runs |
| Industry Data Grid | Presents hard statistics on fleet inefficiency framed as research findings |
| Problem Data Cells | Quantifies fuel waste, driver overtime, and unoptimized mileage costs |
| Before-After Comparisons | Shows real customer fleet benchmarks side by side |
| ROI Calculator | Produces a personalized savings figure from visitor-entered fleet data |
| Primary call to action Block | Drives freemium trial signups with a three-field, no-credit-card form |
| Benchmark Report Download | Captures early-stage leads with an email-only content offer |
Design & branding system
The template uses a Midnight Blue color system that feels like a live dispatch screen at 4 AM. Every color choice carries a functional signal rather than decorative intent.
- Deep terminal navy (#0B1929) as the primary background, satellite-map blue (#1B3A5C) for card surfaces, and electric route-line cyan (#00D4FF) for interactive accents and data highlights
- Cool asphalt gray (#A3B1C6) for secondary text, keeping data readable without competing with the accent layer
- Startup Velocity theme: high-contrast, data-forward visual language that communicates speed, precision, and technical credibility
Mobile & speed optimization
The bento grid layout is structured to reflow cleanly across screen sizes. Interactive elements are designed to remain functional and legible on smaller viewports.
- Grid cells stack vertically on mobile without losing the data-card visual hierarchy
- The map header and slider are built for touch interaction, not just mouse input
- Lightweight visual components keep the page feeling fast even with animated route elements on screen
How this template helps you convert
The page is designed as a staged argument. Each section builds on the last, moving the visitor from problem awareness to personal proof to action.
- The animated header creates immediate emotional buy-in by making the product's value visible before any copy is read, reducing early bounce.
- The return-on-investment calculator personalizes the value proposition, replacing abstract industry stats with the visitor's own fleet savings figure and shortening the decision gap.
- The dual-path conversion setup means visitors who are not ready to trial still leave a contact, so the freemium funnel captures both high-intent and research-phase buyers.
Other information about this template
This template is part of the Technology category within the Automotive Software subcategory, specifically targeting the automotive route optimization niche. It is built on the Bento Grid template style and follows the Startup Velocity visual theme.
- The creative direction follows an Industry Report format, where data builds the case section by section before the product evidence takes over
- The header concept is an Interactive Preview, designed to demonstrate the platform's core function without requiring a live product demo or separate explainer video
- The template supports a Freemium/Trial landing page direction, meaning the entire page structure is oriented around a low-friction first-use offer rather than a sales call or pricing inquiry
Theme
Startup Velocity
Creative direction
Industry Report
Color system
Midnight Blue
Style
Bento Grid
Direction
Freemium/Trial
Page Sections
Interactive Animated Map Header
Draggable Fleet Size Slider
Industry Report Data Grid
Live ROI Calculator
Dual-path Conversion Setup
Before-and-after Route Comparisons
Related questions
What type of business is this template designed for?
Can I adapt the return-on-investment calculator for my own fleet metrics?
Does the template include the animated map as a coded component?
How does the dual-path conversion flow work?
Is the bento grid layout suitable for mobile users?



