AI for Real Estate Booking Website Template
Schedule is a glassmorphic, stats-first landing page template built for real estate AI scheduling tools. It opens with a live calculator that turns a visitor's own data into a compelling case for action. From confirmed-appointment feeds to response-time charts, every section builds evidence before asking for a single click.
by Rocket studio
Quick summary
Schedule is a single-page, dashboard-style landing page template designed for real estate AI scheduling assistants. It leads with a live estimator widget that renders a visitor's own numbers into glowing data cards. The layout then flows through live grid views, comparison charts, and case-study cards, all styled in a deep glassmorphic palette built for credibility and conversion.
Who this template is for
This template speaks directly to real estate professionals who lose deals because response time is too slow. It suits teams running high volumes of inquiries across busy portfolios.
- Solo agents managing around forty or more active listings at once
- Mid-size brokerages losing deals to slow follow-up and response lag
- Property management firms coordinating hundreds of weekly viewings across scattered portfolios
What problem this template solves
Leads go cold fast in real estate. When buyers submit showing requests and nobody confirms within minutes, they move on. Most agents have no tool that communicates the true cost of that lag to prospective clients. This template solves that communication gap by making the cost of inaction visible before asking for anything in return.
- No way to show prospects exactly how many showings they are losing each month
- No credible proof that an AI scheduling tool outperforms a manual follow-up process
- No low-friction path from curiosity to a booked demo call
What you get with this template
You get a fully structured, single-page landing page built around a two-step conversion flow. Every visual section is purpose-built to escalate proof and reduce hesitation.
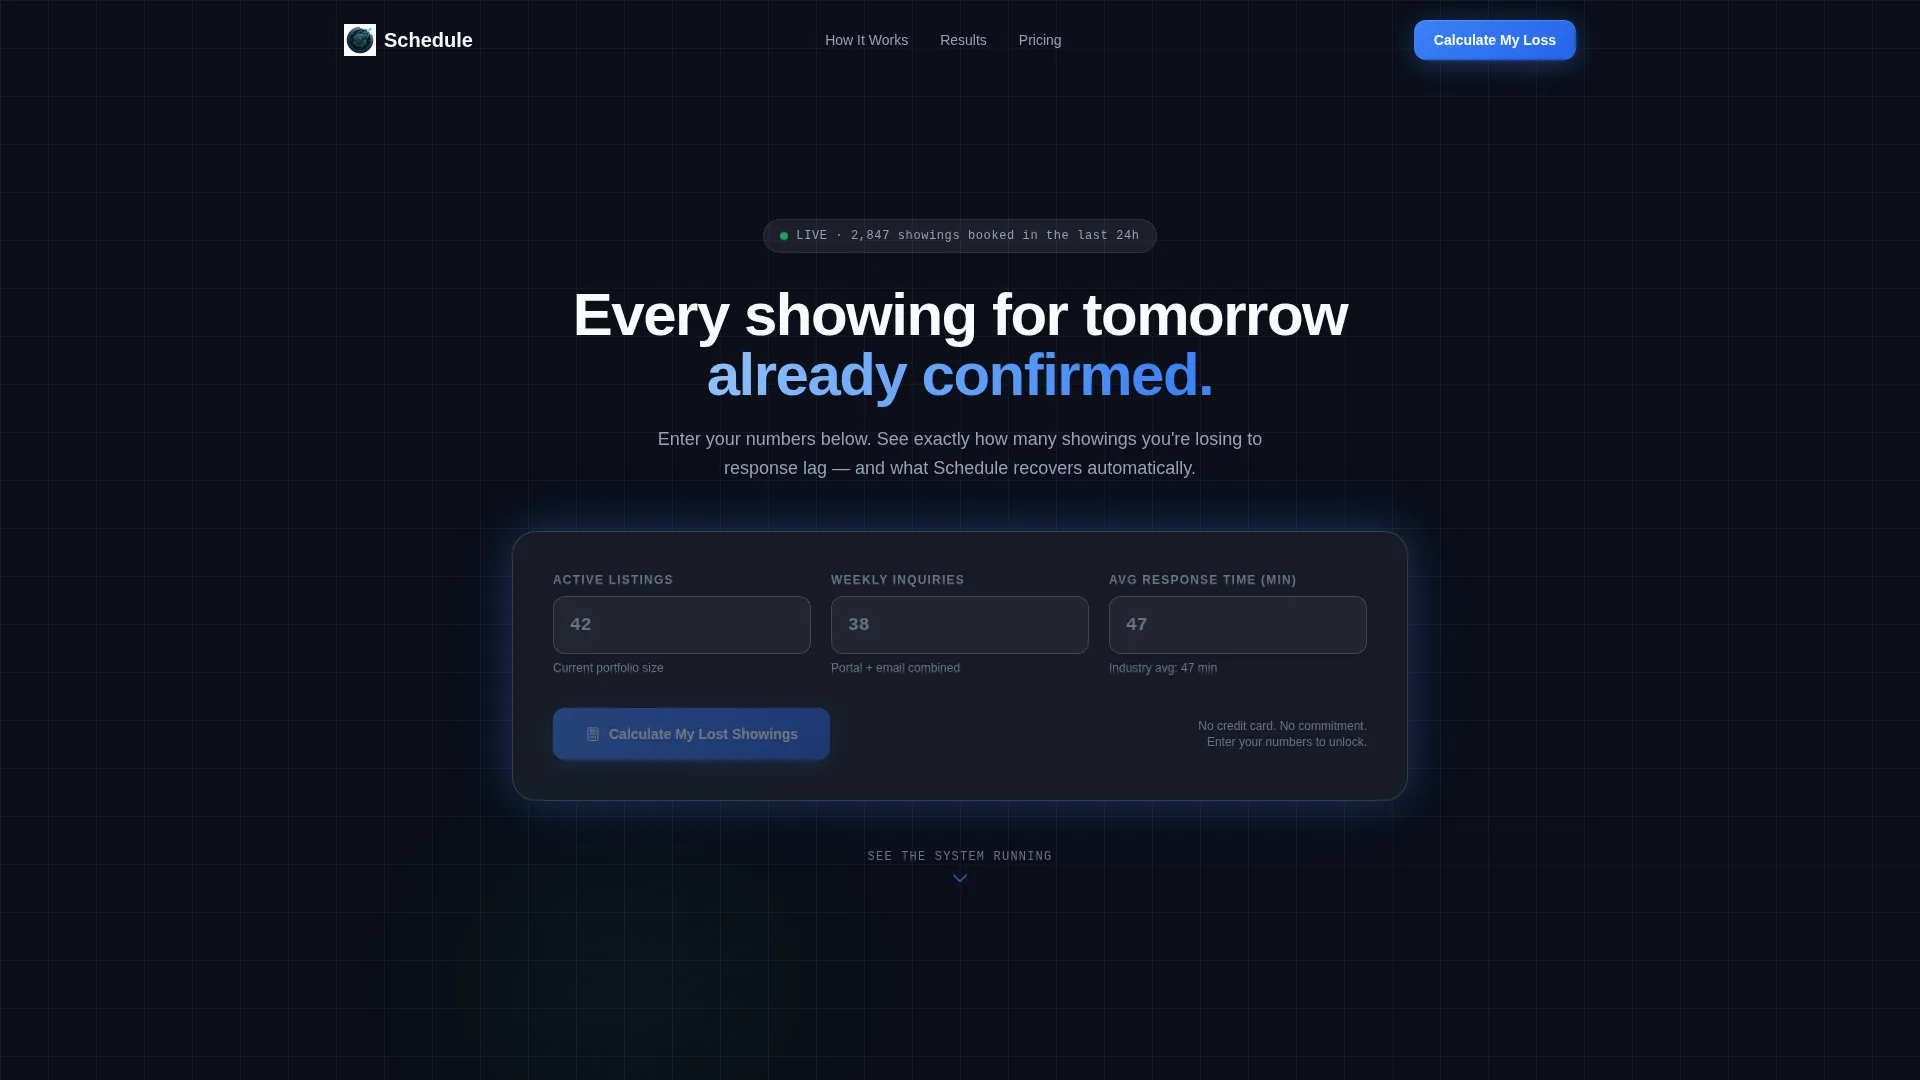
- A live calculator header that renders personalized data cards from visitor inputs
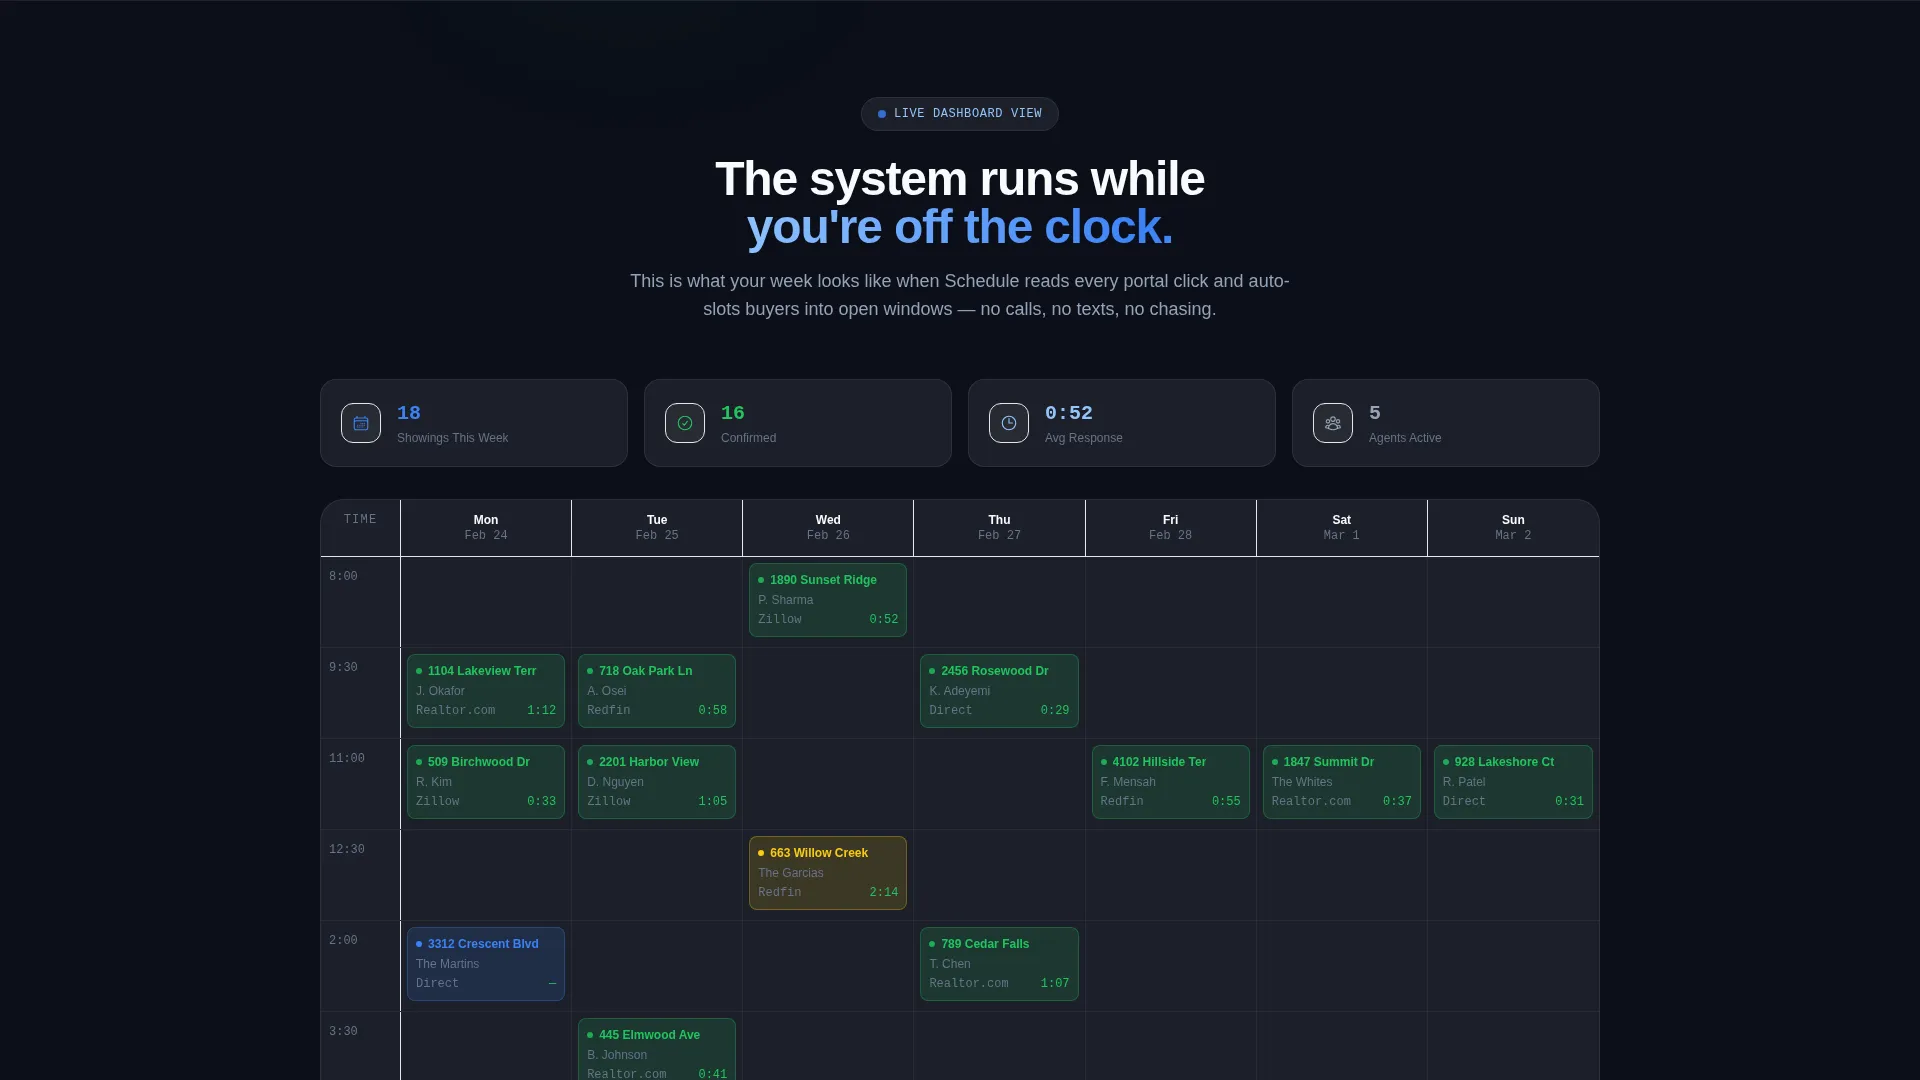
- A scrolling dashboard view with a weekly grid, a response-time bar chart, and a confirmed-appointment feed
- A two-step lead generation flow: an email-gated estimator result followed by a single-click calendar embed for demo booking
Feature list
This template includes six purpose-built sections that move the visitor from skepticism to commitment. Each one is grounded in data display rather than marketing copy.
Live Estimator Header Widget
A frosted-glass calculator sits front and center in the header. Visitors type their number of active listings, average weekly inquiries, and current response time. The widget instantly renders three animated data cards: showings rescued per month, hours saved weekly, and estimated revenue recovered. Numbers animate upward in electric blue, each referenced against industry benchmarks.
Personalized Data Card Output
The estimator output is not a generic result page. It is a glowing card that reflects the visitor's own inputs. This makes the value proposition feel immediate and specific rather than theoretical. The full results are gated behind an email address and brokerage name, turning curiosity into a qualified lead.
Live Weekly Scheduling Grid
Below the header, a dashboard grid view shows AI-scheduled showings populating in real time. The grid communicates the product's core promise visually: every slot filled, every window covered, every confirmation green. It works as a live proof-of-concept before any feature bullet is read.
Response-Time Comparison Chart
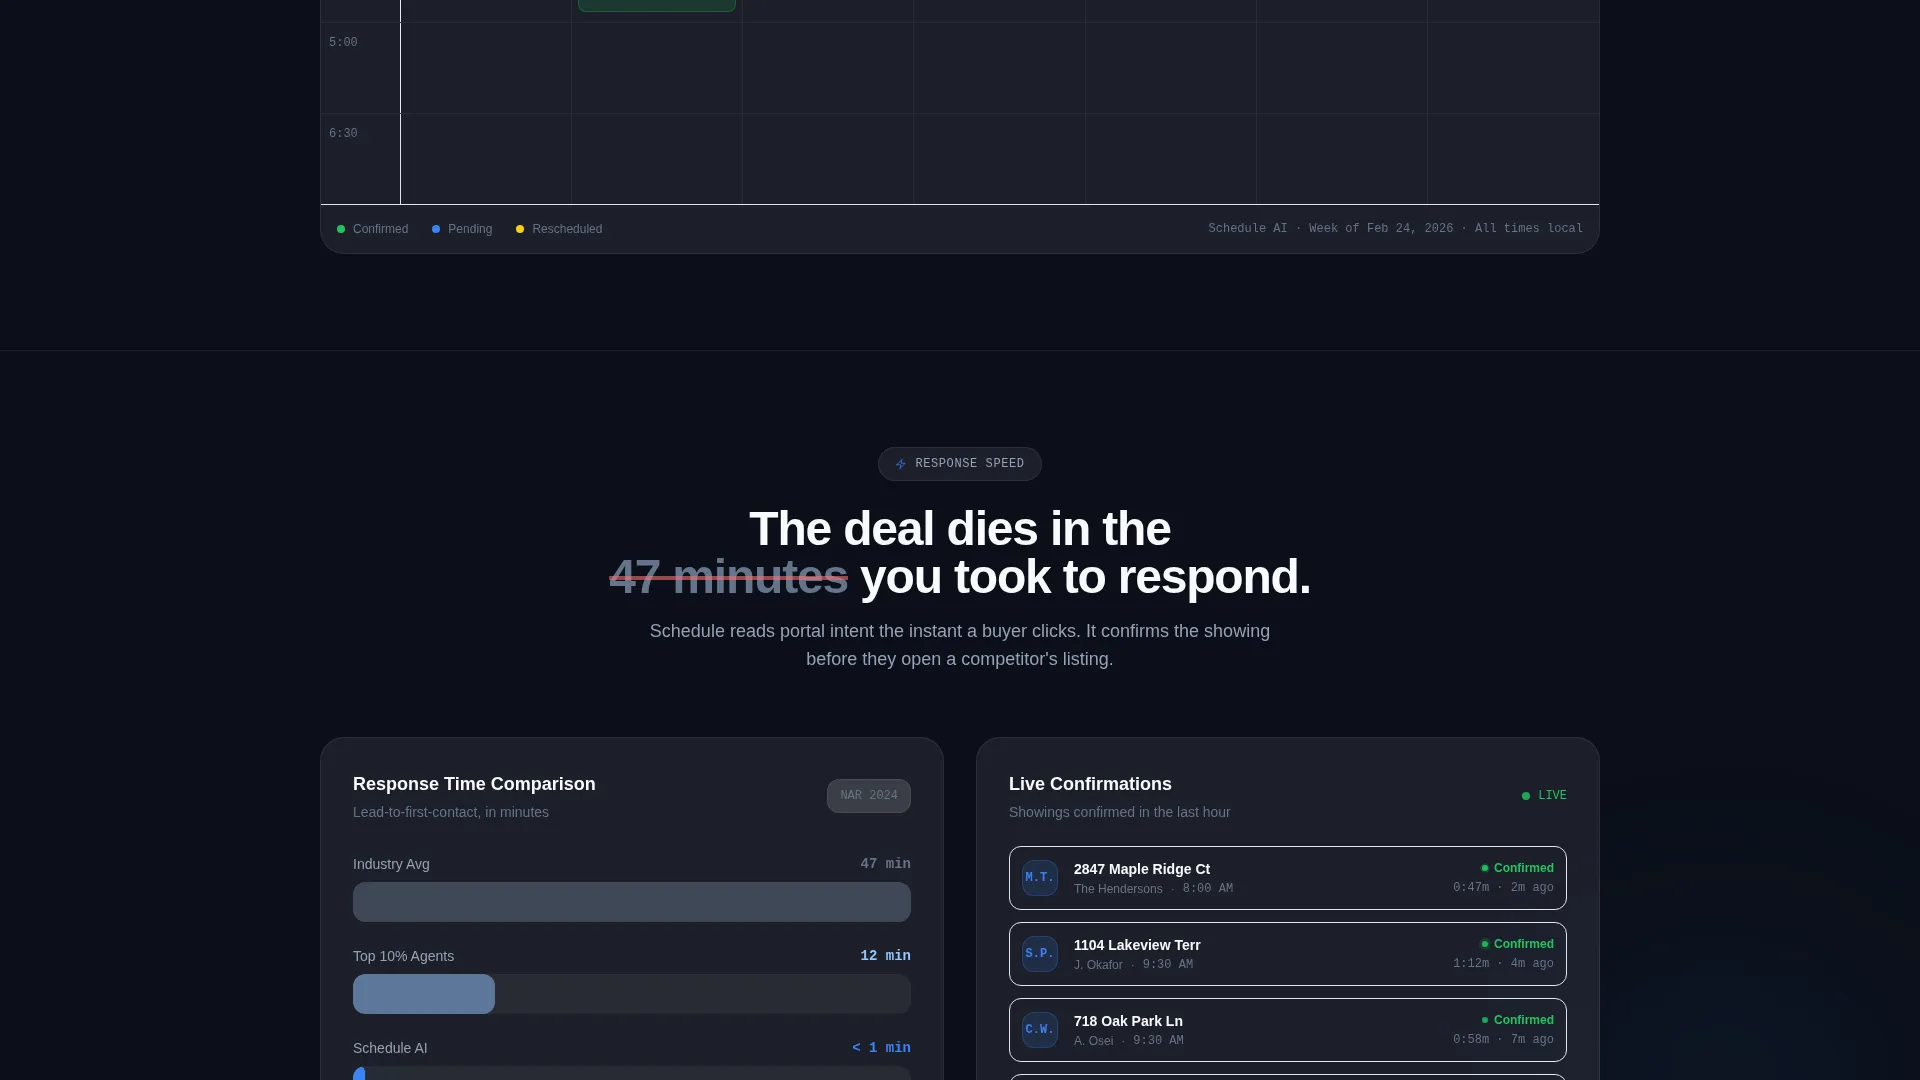
A horizontal bar chart places the industry average response time alongside the tool's automated response time. The gap is immediate and hard to ignore. This section anchors the "here's what you're losing" phase of the scroll journey.
Confirmed Appointment Feed
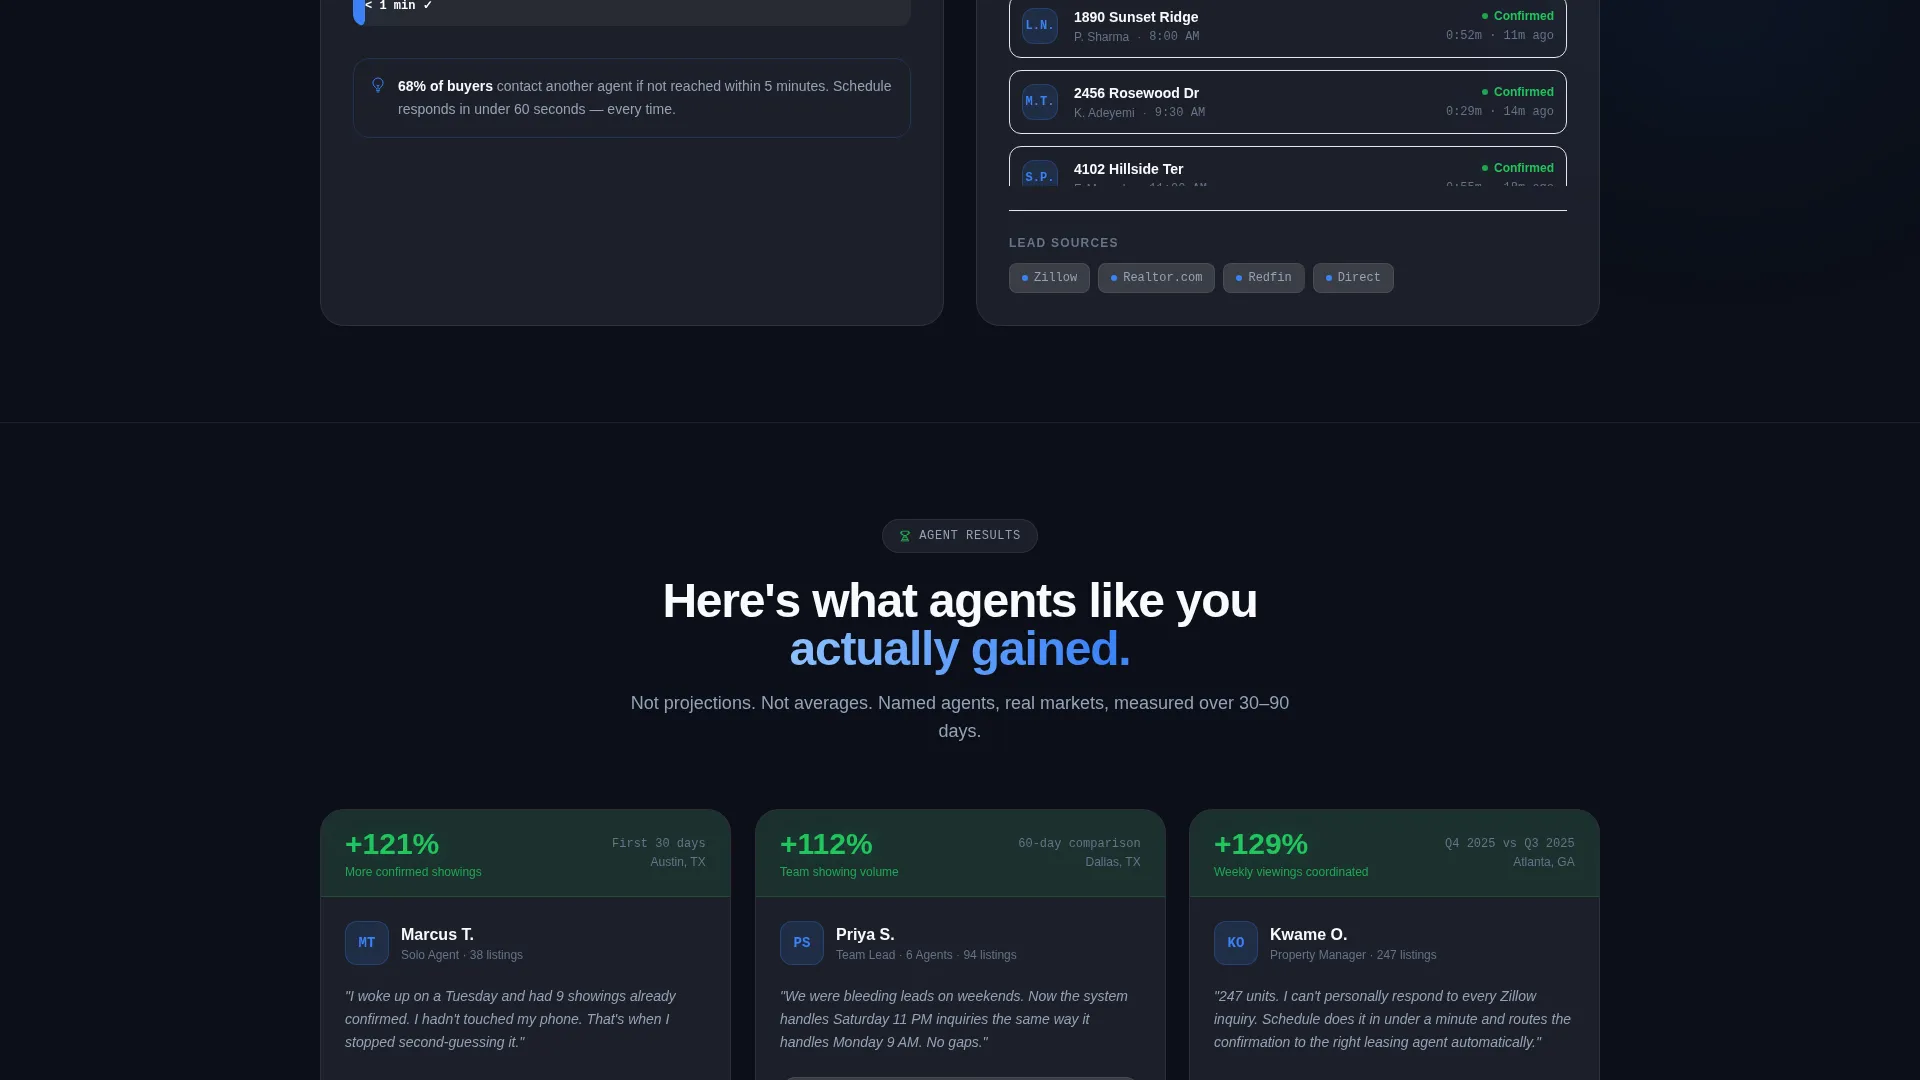
A cascading feed displays anonymized agent names, confirmed appointment times, and timestamps. The feed communicates scale and reliability. Seeing real-looking confirmations scroll past reinforces trust more effectively than a static testimonial.
Case Study Proof Cards
Named case-study cards show percentage lifts in showings booked and response rates for agents similar to the visitor. Cards slide from slight translucency to full opacity as they enter the viewport, mimicking app windows coming into focus. This section closes the evidence arc before the final conversion step.
Page sections overview
| Section | Purpose |
|---|---|
| Estimator header widget | Capture visitor data and render personalized showing-loss numbers |
| Personalized results card | Gate full estimator output behind email and brokerage name |
| Live scheduling grid | Show AI-slotted appointments populating across a weekly view |
| Response-time chart | Compare industry average lag against automated response speed |
| Confirmed appointment feed | Display anonymized live confirmations to build scale and trust |
| Case study cards | Present named agent proof with percentage lift metrics |
| Demo booking embed | Offer single-click calendar access to the next available slot |
Design & branding system
The visual language is Tech Glass: a dark, layered interface that feels like a control tower at midnight. Translucent panels float over subtle grid lines, and every glow carries meaning. Blue means active. Green means confirmed. Gray means context.
- Core palette: deep void black (#0B0F19) as the base, frosted panel white at 12% opacity (#FFFFFF1F) for cards, electric scheduling blue (#3B82F6) for calls to action and active data states, and confirmation green (#22C55E) pulsing on live-status indicators
- Typography: cool gray (#94A3B8) on card surfaces for readable context text, pure white on emphasis headings and key data figures
- Motion and depth: cards transition from slight translucency to full opacity on scroll entry, mimicking app windows coming into focus with no heavy animation overhead
Mobile & speed optimization
The template is structured for clarity at every screen size. Dashboard grids and data cards are designed to reflow gracefully on smaller viewports without losing the core visual hierarchy.
- The estimator widget and data card output are the priority above the fold on all screen sizes
- Chart and grid sections stack vertically on mobile so data remains readable without horizontal scrolling
- Viewport-triggered card animations are kept subtle and purposeful so the interface feels responsive rather than heavy
How this template helps you convert
This template earns the conversion before asking for it. The visitor's own numbers do the persuading, so the form feels like a natural next step rather than a barrier.
- The estimator header captures attention immediately by rendering personalized showing-loss data from the visitor's own inputs, making the cost of inaction tangible before any pitch is made
- The email gate on full results converts engaged visitors into qualified leads with minimal friction, using curiosity as the lever
- The post-submission calendar embed offers a single-click path to a 15-minute live dashboard demo, reducing the gap between interest and a real sales conversation
Other information about this template
This template is built within the Tech Glass theme family, using a Glassmorphic color system designed for data-heavy interfaces that need to feel premium without being cluttered. It is categorized under Technology and AI for Real Estate, making it a strong fit for any real estate AI scheduling assistant product that needs to communicate speed, reliability, and scale on a single page. The Stats-First Impact creative direction means the template leads with numbers rather than narrative. No stock photography is used anywhere in the layout.
- Template style: Dashboard and Data Grid layout within a single-page flow
- Header concept: Calculator and Estimator with animated data card output
- Landing page direction: Lead generation with a two-step conversion path
- Ideal for any real estate AI scheduling assistant positioned around response speed and booking automation
Theme
Tech Glass
Creative direction
Stats-First Impact
Color system
Glassmorphic
Style
Dashboard/Data Grid
Direction
Lead Generation
Page Sections
Live Estimator Header Widget
Email-gated Personalized Results
Live Weekly Scheduling Grid
Response-time Comparison Chart
Confirmed Appointment Feed
Single-click Demo Booking Embed
Related questions
Who is this landing page template designed for?
Do I need real live data to use the estimator section?
What is the two-step conversion flow in this template?
Can I update the color palette while keeping the glassmorphic style?
Is this template suitable for a brokerage with multiple agents?



