Precision Agri Landing Page Template
Cultivar is a Bold Brutalist precision agriculture landing page built for agronomists, cooperative extension officers, and ag consultants. It tracks plant health cases from first symptom to harvest, logs soil biopsies and pesticide schedules, and compares your platform against manual workflows using brutally honest comparison tables. A three-step lead capture form and downloadable spec sheet drive qualified conversions.
by Rocket studio
Quick summary
Cultivar is a single-page, data-forward precision agriculture landing page. It uses a Bold Brutalist design with iridescent color shifts to position a crop diagnostics platform against manual records, generic farm software, and legacy spreadsheets. Live metric panels, expandable comparison tables, and a progressive lead capture form make the case row by row.
Who this template is for
This template is built for teams selling or promoting sophisticated crop health and field diagnostics platforms. It speaks directly to technically literate buyers who need evidence before they commit.
- Agronomists managing multi-county crop portfolios who need airtight case records
- Cooperative extension officers triaging disease outbreaks across dozens of member farms
- Precision agriculture consultants who bill by the diagnosis and require exportable compliance documentation
What problem this template solves
Field diagnostics teams waste days on manual record-keeping that generic farm management software was never designed to handle. The gap between a slow diagnosis and a saved field is measured in yield loss, not hours. This template closes that gap visually and logically.
- No clear way to compare a platform's speed against the 3-day industry diagnosis standard
- Generic farm software pages fail to show feature-level precision that technical buyers demand
- Spreadsheet workflows and paper logs cannot demonstrate the scale of acres under active monitoring
What you get with this template
You get a fully structured, single-page landing page that reads like a technical data sheet. Every section is designed to build trust through transparency rather than marketing language.
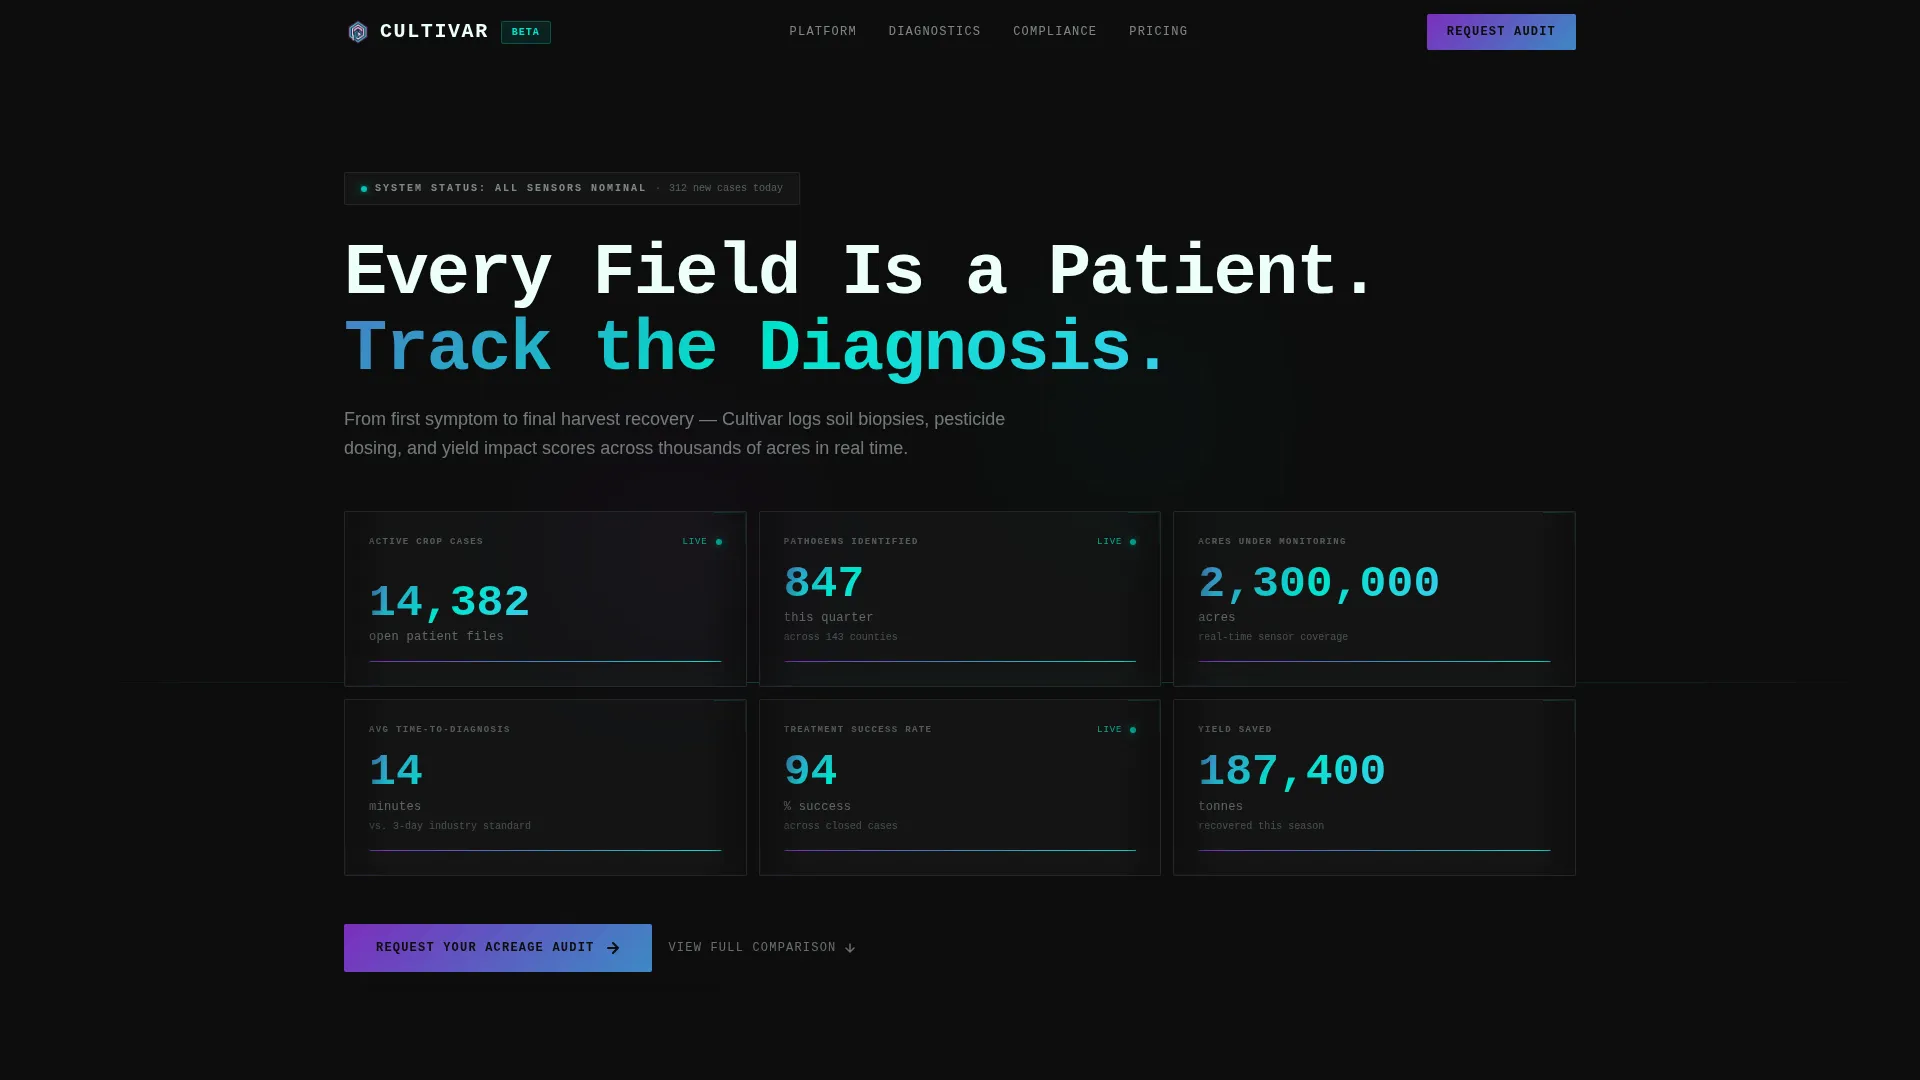
- A brutalist grid header with six live-updating metric panels showing active cases, pathogen counts, acres monitored, average diagnosis time, treatment success rate, and tonnes of yield saved
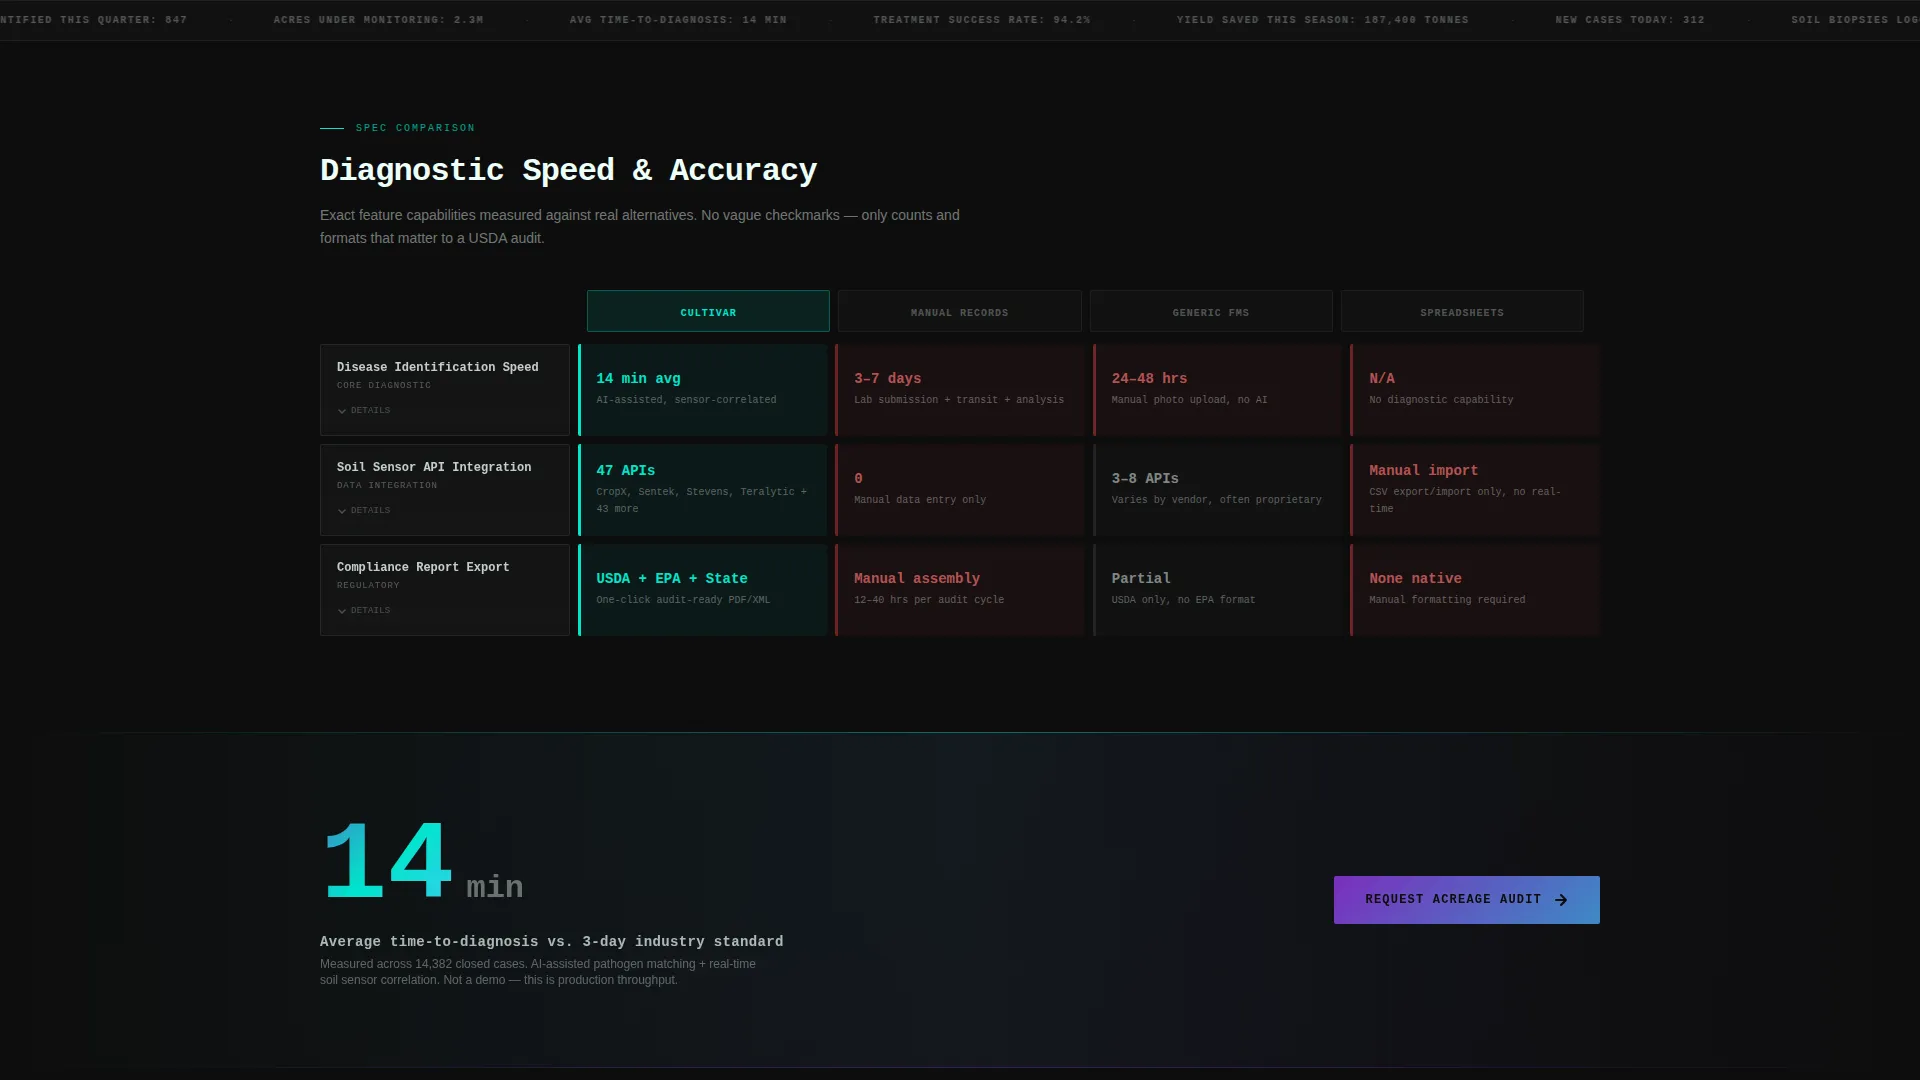
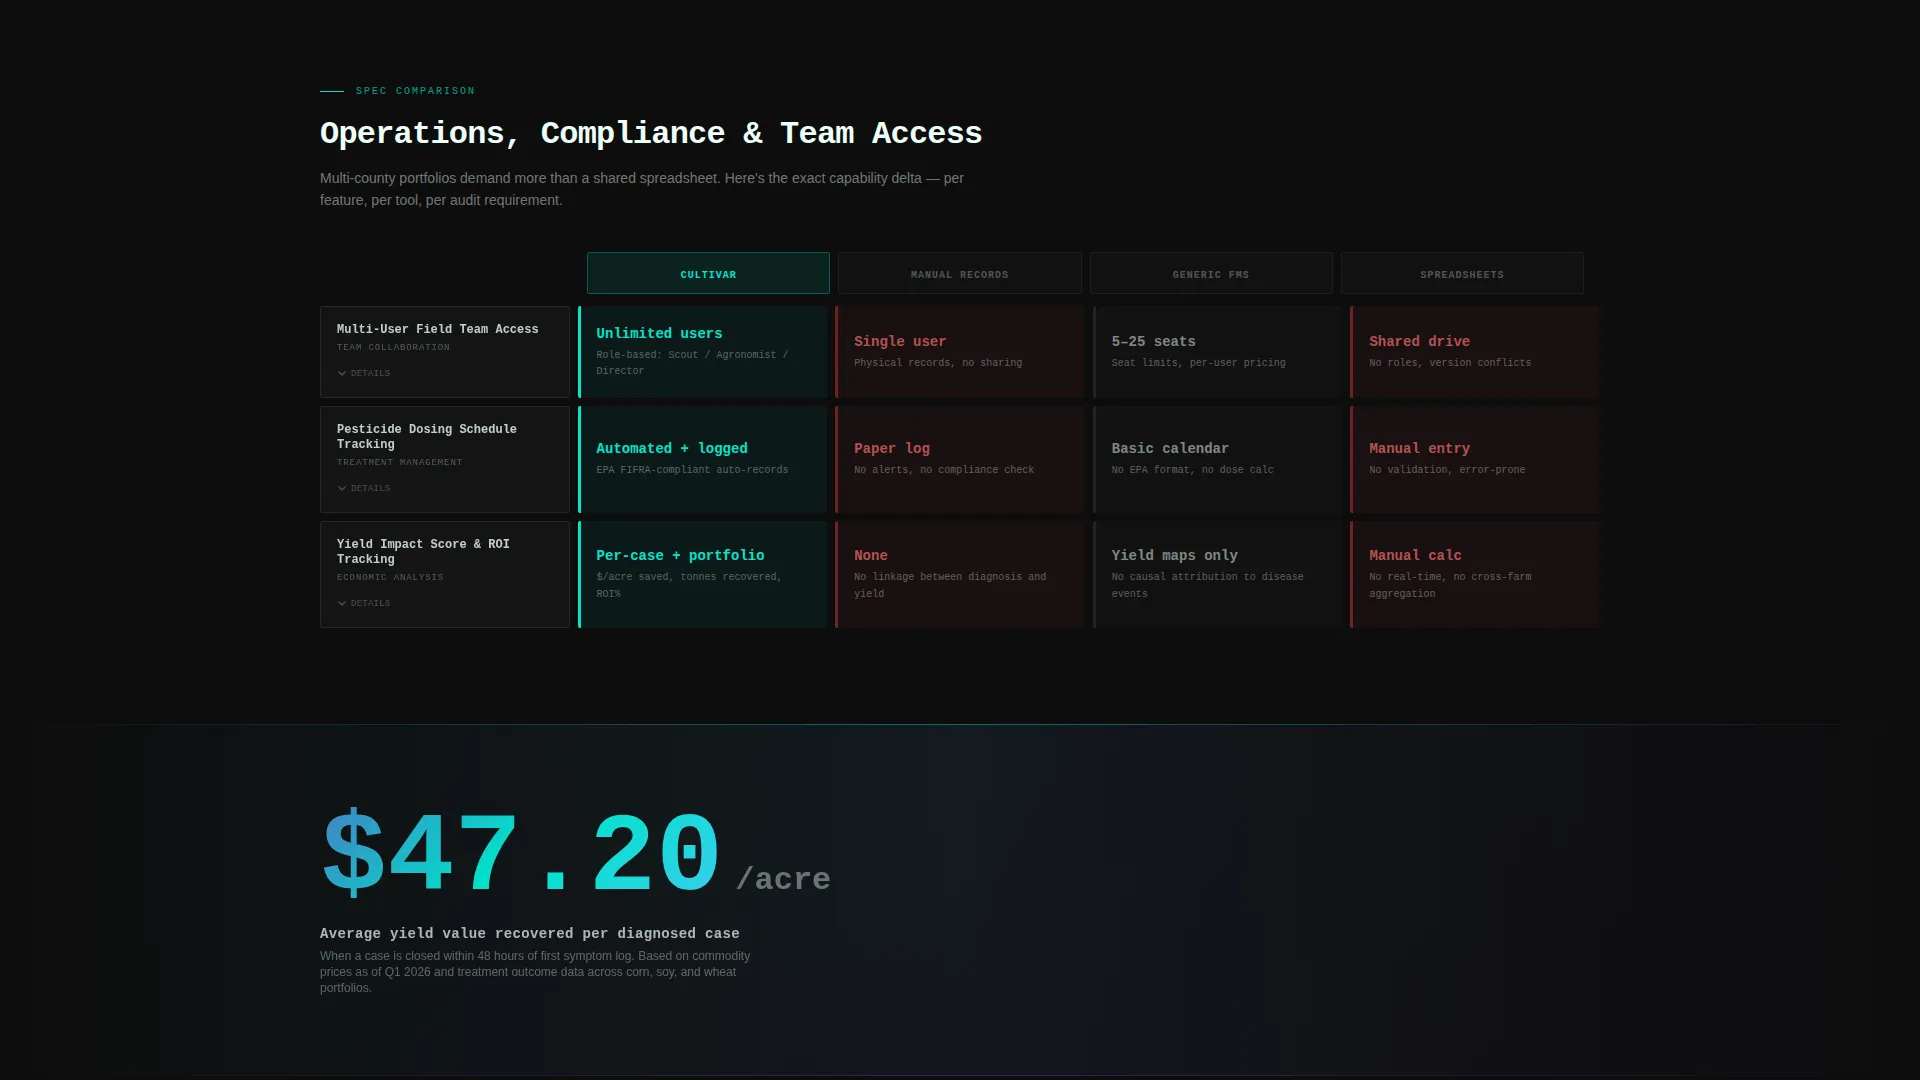
- A scrollable comparison table layout with expandable rows covering disease identification speed, soil sensor integration, exportable compliance reports, and multi-user field team access
- A three-step progressive lead capture form and a secondary email-gated PDF spec sheet download for internal decision-makers
Feature list
This template ships with purpose-built components that serve the precision agriculture diagnostics use case directly.
Six-Panel Live Metric Header
The header renders six dark glass panels in a brutalist grid. Each panel displays one live-updating field metric in iridescent type: active crop cases, pathogens identified this quarter, acres under monitoring, average time-to-diagnosis, treatment success rate, and yield saved in tonnes. No hero image. Pure data authority from the first scroll position.
Expandable Comparison Table Rows
Each scroll section is a comparison table row. Rows expand on click to reveal exact feature counts and hard limits across four alternatives: the platform, manual record-keeping, generic farm management software, and legacy spreadsheet workflows. Vague checkmarks are replaced with specific, auditable numbers.
Full-Width Iridescent Stat Callouts
Between table sections, single-stat callout blocks appear as full-width gradient bands in teal-to-violet. Each callout punches one number into the reader's attention, such as the 14-minute average diagnosis versus the 3-day industry standard, keeping the scroll rhythm from becoming monotonous.
Three-Step Progressive Lead Form
The primary call to action, "Request Your Acreage Audit," triggers a three-step progressive disclosure form. Step one collects total managed acreage and primary crop types. Step two asks for current record-keeping method and biggest diagnostic pain point. Step three captures name, email, and preferred callback window.
Email-Gated PDF Spec Sheet
A secondary conversion path offers a downloadable PDF spec sheet titled "Download Full Platform Specs." It is gated behind email entry only, capturing buyers who need to compare internally before committing to a discovery call.
Fixed Mobile Bottom Bar call to action
On mobile viewports, the primary call to action reappears as a fixed bottom bar. This keeps the "Request Your Acreage Audit" prompt visible throughout the entire scroll without interrupting the reading flow on smaller screens.
Page sections overview
| Section | Purpose |
|---|---|
| Dark Glass Header | Display six live field metrics in iridescent type to establish data authority immediately |
| Headline Block | Present the core positioning statement between the metric panels |
| Comparison Row 1 | Compare disease identification speed across all four workflow alternatives |
| Stat Callout Band | Reinforce the 14-minute versus. 3-day diagnosis gap with a full-width iridescent gradient block |
| Comparison Row 2 | Compare soil sensor integration and exportable compliance report capabilities |
| Primary call to action Block | Present the "Request Your Acreage Audit" form after the third comparison row |
| Comparison Row 3 | Compare multi-user field team access and per-acre cost transparency |
| Secondary call to action Block | Offer the email-gated PDF spec sheet download for internal evaluators |
| Progressive Lead Form | Collect acreage, crop types, pain points, and contact details in three steps |
Design & branding system
The visual identity draws from a lab environment: sterile surfaces, fluorescent light catching iridescent material at an angle. Every design choice reinforces clinical precision over decorative warmth.
- Color palette: deep loam black (#0D0D0D) backgrounds, shifting holographic violet (#7B2FBE) accents, iridescent teal (#00E5CC) interactive states, and clinical phosphor white (#EDFFF8) for text and table cells
- Typography is monospaced and oversized, stamped onto surfaces like specimen labels on a diagnostic tray
- Tables and data containers sit in frosted phosphor white with brutal 4-pixel borders, and hover states bloom in teal-to-violet gradients that shift like oil on water
Mobile & speed optimization
The template is structured to keep the most persuasive data visible on every screen size. Mobile layout choices are deliberate, not an afterthought.
- The fixed bottom bar keeps the primary call to action persistent throughout the full mobile scroll
- Comparison table rows are designed to expand on tap, keeping the initial mobile view clean while preserving full detail on demand
- Full-width stat callout bands reflow naturally to single-column layouts without losing their visual impact
How this template helps you convert
Every design and copy decision in this template is built to reduce hesitation and move a technically literate buyer toward a qualified action.
- The six live metric panels in the header replace introductory copy with raw proof, establishing authority before a single marketing claim appears on screen
- The expandable comparison table format forces honest, row-by-row evaluation, making every alternative look slower, less precise, and more expensive per acre by comparison
- The dual conversion paths, a three-step audit request form and an email-only PDF download, capture buyers at two different stages of readiness without sending either group to a dead end
Other information about this template
This template is built on a Bold Brutalist theme with an AI Iridescent color system. It is designed specifically for the agriculture patient management niche, where data credibility directly influences buying decisions.
- The Spec Sheet creative direction is intentional: the scroll mimics a printed technical data sheet, a format that agricultural professionals and compliance-focused buyers already trust
- The Dark Glass Panels header concept is a core structural element, not a decorative choice. It signals that the platform runs on real data, not marketing estimates
- The Comparison Table template style means the page earns its argument through side-by-side evidence rather than narrative persuasion
- The Lead Generation direction is built into the page architecture: every scroll section moves the reader closer to the audit form or the spec sheet download
- This template suits precision agriculture software vendors, agri-tech startups, and field diagnostics platform teams who need a credible, data-dense first impression with qualified buyers

Theme
Bold Brutalist
Creative direction
Spec Sheet
Color system
AI Iridescent
Style
Comparison Table
Direction
Lead Generation
Page Sections
Six-panel Live Metric Header
Expandable Comparison Table Rows
Full-width Iridescent Stat Callouts
Three-step Progressive Lead Form
Email-gated PDF Spec Sheet
Fixed Mobile Bottom Bar Call to Action
Related questions
Who is the primary audience for this landing page template?
Can I customize the comparison table rows for my platform's features?
How does the three-step lead capture form work?
What is the secondary conversion path in this template?
Does this template work for teams outside pure crop diagnostics?



