Micro-SaaS & Developer Tools Professional Website Template
Speed is a hub-and-spoke landing page template built for developer tools that diagnose core web vitals in real time. It opens with an animated terminal showing live performance metrics, guides visitors through five anchor-navigated diagnostic sections, and converts on a freemium model, first scan free, full report behind a one-field email capture. No signup friction before value is delivered.
by Rocket studio
Quick summary
Speed is a single-page, anchor-navigated template designed for web vitals diagnostic tools. It combines a Tech Glass visual identity with a Spec Sheet creative direction to simulate the feeling of cracking open DevTools on a clean monitor. The page earns conversion by showing real core web vitals data before asking for anything, the visitor pastes a URL, sees the numbers, then decides.
Who this template is for
This template is built for founders and teams shipping developer tools that test core web vitals, measure page load performance, or surface field data to real users who need actionable numbers fast.
- Frontend developers who need to debug performance issues and diagnose performance problems at the metric level, not just read a summary score
- Agency owners who need a proof-of-value narrative showing that a rebuild delivered measurable gains across core web vitals metrics
- SEO leads who track competitor core web vitals data and need a tool that surfaces crux data alongside lab data in one view
What problem this template solves
Most performance tool pages bury the product behind marketing copy. Visitors arrive, read three paragraphs of promises, and leave without understanding what the tool actually produces. The result is low trial conversion and high bounce rates, especially for technically sophisticated audiences who can tell the difference between a real output and a screenshot of one.
- The template solves the trust gap by making the product the hero: a typewriter-animated terminal in the header shows an actual API response with real core web vitals metrics before the visitor scrolls an inch
- It resolves navigation friction for long diagnostic pages by using a sticky anchor nav that keeps each hub section, core web vitals, waterfall analysis, competitor benchmarking, historical tracking, one click away
- It addresses the conversion problem of asking for commitment too early by giving the first scan free, then gating the full core web vitals report behind a single email field
What you get with this template
You get a fully structured, single-page template with five diagnostic hub sections, sticky navigation, and a freemium conversion flow baked in from the first pixel. Every section is designed to escalate diagnostic depth while keeping the visitor oriented and moving forward.
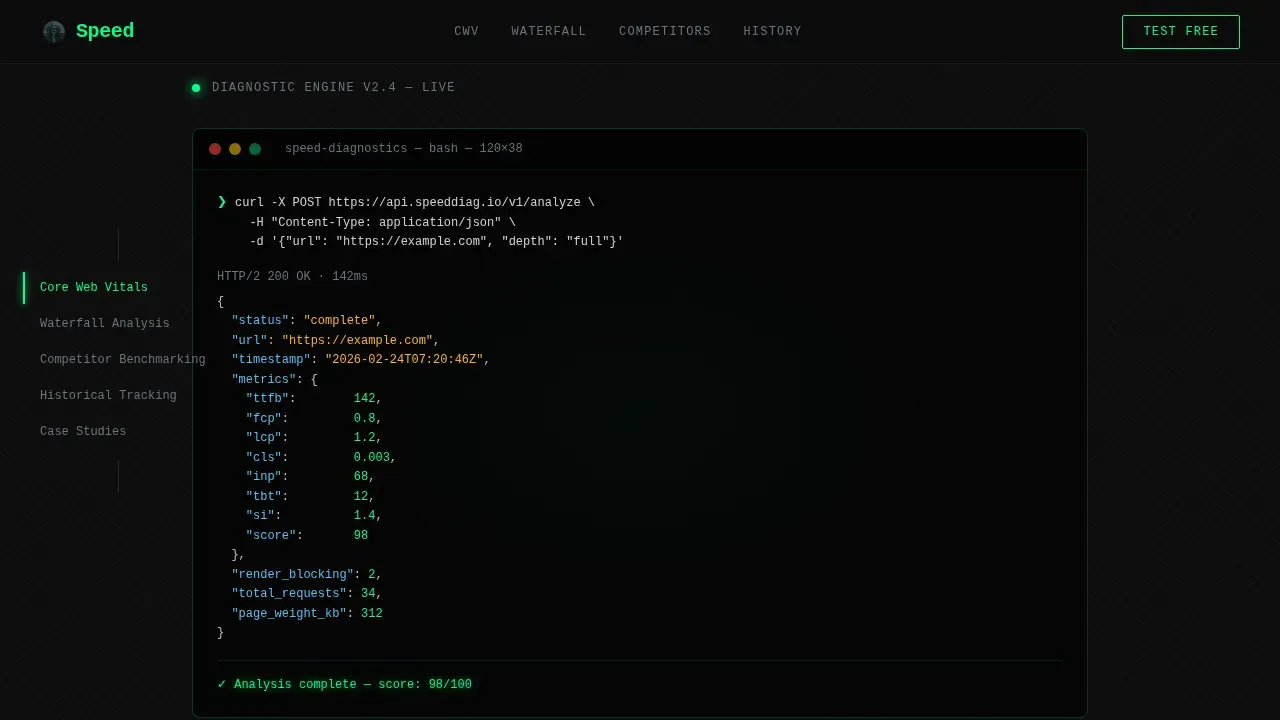
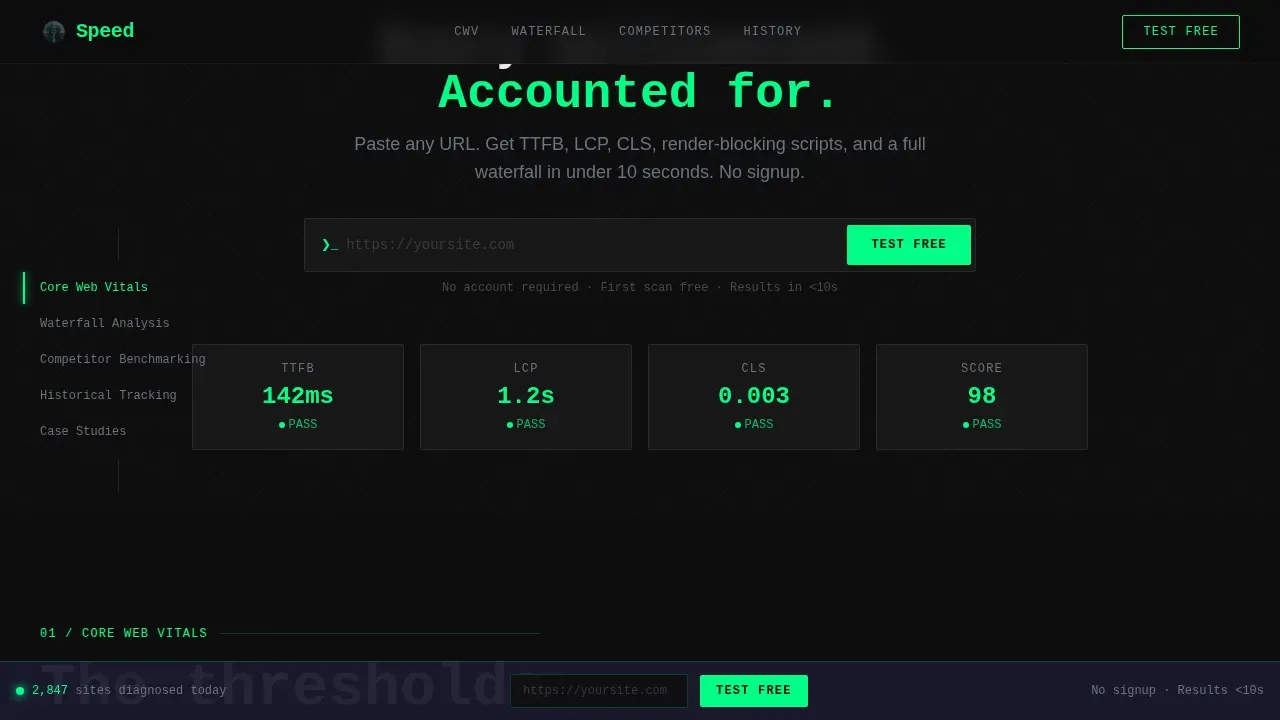
- A hero section with an animated curl command and JSON response block, plus a URL input field with a blinking cursor ready for the visitor's first scan
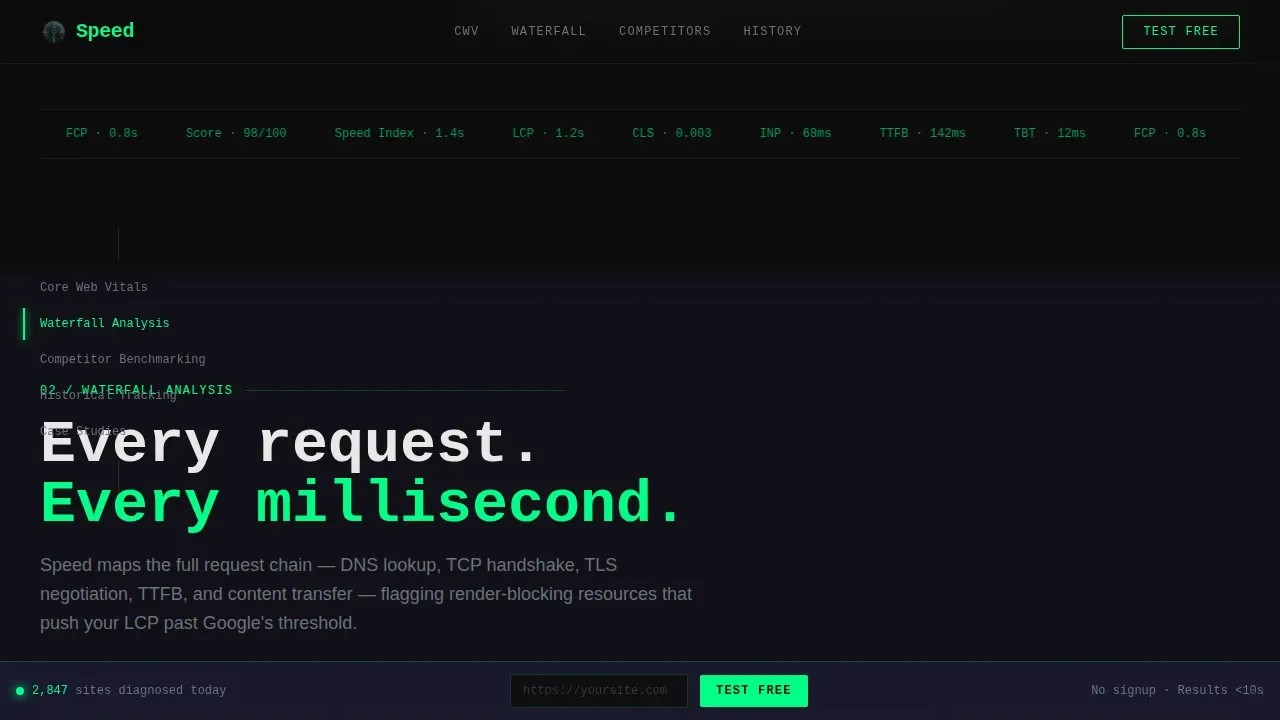
- Five anchor-linked hub sections covering core web vitals, waterfall analysis, competitor benchmarking, historical tracking, and social proof, each opening with a display-scale metric before breaking into methodology and sample output
- A sticky bottom call-to-action bar that appears after the first scroll and repeats the primary action without interrupting the reading flow
Feature list
This template ships with the following built-in capabilities, each grounded in the source brief.
Animated Terminal Header
The header opens with a syntax-highlighted curl command that types out character by character against a carbon black background. The JSON response block populates in sequence, showing metrics including Time to First Byte at 142ms, Largest Contentful Paint (LCP) at 1.2s, cumulative layout shift at 0.003, and a performance score of 98. The green text pulses once on completion, signaling a passing core web vitals assessment to the visitor immediately.
Hub and Spoke Anchor Navigation
A sticky side navigation links to each of the five core diagnostic sections. Each hub is independently scrollable and anchored, so visitors can jump directly to the core web vitals section, the waterfall analysis, or the competitor benchmarking panel without losing their place. The nav highlights the active section as the visitor scrolls, providing orientation across a long, data-dense page.
Freemium Conversion Flow
The primary call to action, "Test Your Site Free", lives inside the header URL input and repeats in a sticky bottom bar after the first scroll. No account creation is required for the first scan. The results page gates historical tracking and competitor comparison behind a one-field email capture, so the visitor experiences real user data before being asked for anything.
Spec Sheet Section Structure
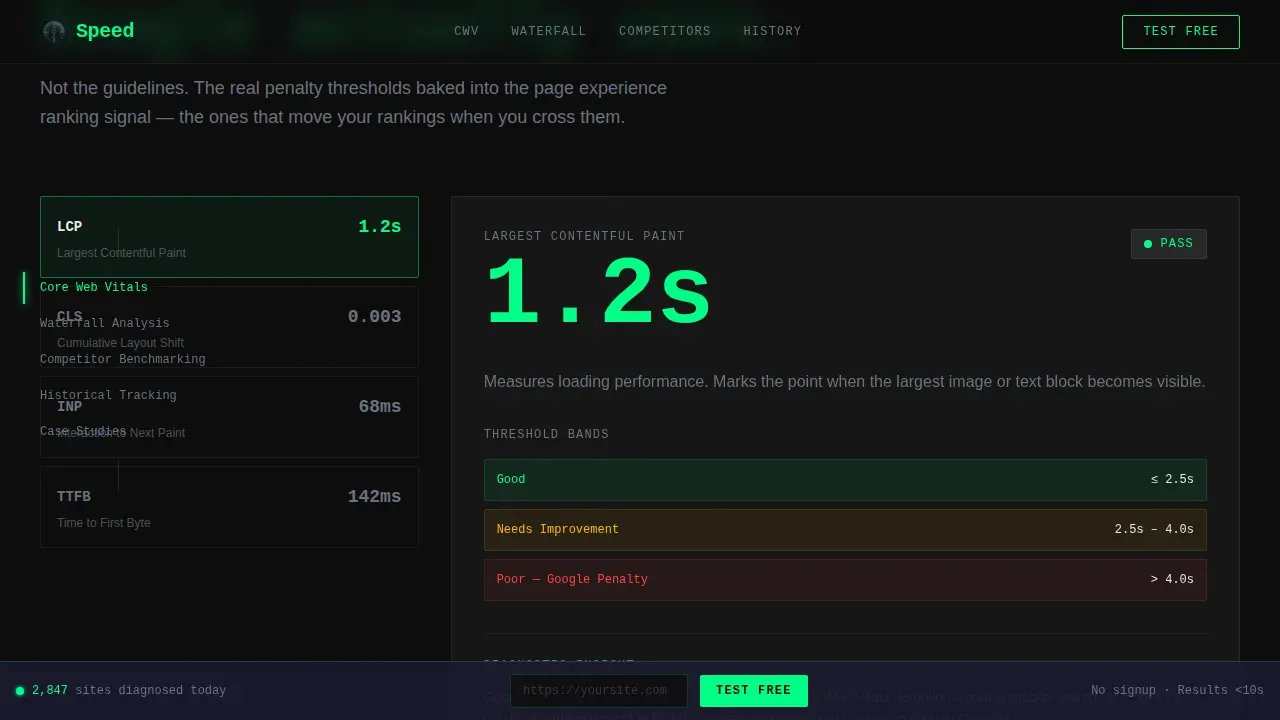
Each hub section opens with a single core web vitals metric rendered at display scale, then breaks into methodology, threshold tables, and sample output screenshots. This Spec Sheet creative direction escalates diagnostic depth across five sections: Speed Index, core web vitals, waterfall analysis, competitor benchmarking, and historical tracking. The structure mirrors the way engineers read technical datasheets, keeping skimmers and deep readers both engaged.
Tech Glass Visual System
The template uses a Carbon Fiber color system: deep carbon black (#0D0D0D) for backgrounds, woven graphite (#1A1A2E) for surface panels, translucent frosted glass overlays (#FFFFFF0A) for card depth, and electric diagnostic green (#00FF88) for live data, pass states, and calls to action. The palette is engineered to reduce visual noise so the core web vitals numbers hit harder against the dark surfaces.
Dual Typography Stack
JetBrains Mono handles all code blocks, metric values, and performance panel outputs. DM Sans handles body text, labels, and section introductions. The combination keeps technical data readable and precise while preventing the page from feeling like a raw terminal dump. The monospaced metrics reinforce the diagnostic credibility of the tool being presented.
Page sections overview
| Section | Purpose |
|---|---|
| Hero Terminal | Animate curl command, show JSON core web vitals output, capture URL input |
| Core Web Vitals | Display LCP, Interaction to Next Paint (INP), cumulative layout shift thresholds and pass/fail states |
| Waterfall Analysis | Render CSS mock waterfall chart with render-blocking callouts and timing breakdown |
| Competitor Benchmarking | Side-by-side core web vitals data comparison, escalating to hidden competitor insights |
| Historical Tracking | Sparkline chart of core web vitals trends, agency social proof with specific metric numbers |
| Footer | GitHub Developer Minimal pattern with secondary links and minimal branding |
Design & branding system
The visual identity follows a Tech Glass theme built on a Carbon Fiber color system. Every design decision prioritizes legibility of core web vitals data over decoration. Matte dark surfaces catch thin strips of electric green status light, and frosted glass panels create depth without adding visual clutter.
- Color palette: deep carbon black (#0D0D0D) backgrounds, woven graphite (#1A1A2E) surface panels, translucent frosted glass (#FFFFFF0A) overlays, and electric diagnostic green (#00FF88) for all active states, pass indicators, and calls to action
- Typography: JetBrains Mono for all performance metrics, code outputs, and performance panel displays; DM Sans for all body copy, labels, and instructional text
- Animation approach: high-motion typewriter terminal in the header, CSS waterfall bars, scroll-triggered section reveals, a blinking cursor in the URL input field, and a marquee for social proof, all scoped to client-only components to keep static rendering fast
Mobile & speed optimization
The template is built desktop-first, reflecting the DevTools audience it serves. Frontend developers and agency teams doing diagnostic work almost always work on large screens. That said, the layout is fully responsive and adapts for smaller viewports without breaking the core navigation or conversion flow.
- Animations are scoped to client-only components so server-rendered static sections load without waiting for JavaScript hydration, keeping initial page load fast across network conditions
- The sticky bottom call-to-action bar and sticky side navigation are both optimized for both mobile and desktop viewports, maintaining conversion access regardless of device
How this template helps you convert
The conversion strategy in this template is built on earned trust, not pressure. The visitor sees real core web vitals data in the first five seconds. Every subsequent section adds diagnostic depth that makes the free tier feel increasingly valuable.
- The animated terminal header shows a completed core web vitals scan before the visitor does anything, establishing immediate credibility and setting the expectation that the tool produces real, formatted output
- The freemium flow removes all friction from the first action: no account, no credit card, no form, just a URL input that returns a live core web vitals report, with the full report gated behind one email field after the visitor has already seen what the tool produces
Other information about this template
This template is built for the niche where diagnostic depth and conversion clarity have to coexist. The sections below cover additional context relevant to how the template fits into the broader landscape of core web vitals testing tools and best practices.
- Core web vitals are a set of three website performance metrics evaluated at the 75th percentile of real user experiences, meaning the slowest 25% of visitors determine the score, this template's threshold tables reflect that framing directly
- The three core web vitals metrics are Largest Contentful Paint (LCP), Interaction to Next Paint (INP), and cumulative layout shift (CLS); LCP measures how quickly the main content renders, INP measures how quickly a page responds to user interactions, and CLS measures how much page elements move after first render
- Core web vitals are part of Google's ranking algorithm and have been a ranking factor since June 2021; site owners who improve core web vitals scores can see a gradual ranking boost, and when core web vitals are good, users are 24% less likely to leave a web page before it finishes loading
- Core web vitals account for 70% of the pagespeed score calculation, making them the dominant factor in any pagespeed insights report
- Core web vitals data comes from two distinct source types: lab data, which is useful for debugging and testing performance changes under simulated conditions, and field data, which reflects how real users actually experience the site across varying network conditions and device capabilities; this template's design makes both types of data legible at a glance
- The Chrome User Experience Report (CrUX) is how Google collects real user data from actual users browsing real sites; crux data powers the field data shown in tools like pagespeed insights and the core web vitals report inside search console
- Google Search Console provides a core web vitals report that groups many pages by performance status; however, search console surfaces only indexed URLs and may show insufficient data for newer sites or those with low traffic, which is why combining search console with a dedicated testing tool gives a more complete picture
- Real User Monitoring (RUM) provides real-time reporting on core web vitals data as actual users interact with the site, covering user interactions that lab data cannot simulate
- Layout shifts are often caused by web font loading without font-display: swap, by images or ads missing explicit width and height attributes, or by third party scripts injecting content after the initial render; the waterfall section in this template visualizes exactly these causes
- To improve core web vitals, common steps include: deferring or asynchronously loading javascript files that are not critical to first render, optimizing images by switching to modern image formats like WebP or AVIF, avoiding lazy loading for the LCP element, and ensuring the html document structure does not trigger unnecessary layout shifts through late-loading page elements
- System fonts and web font preloading both affect cumulative layout shift scores; using system fonts eliminates the font-swap shift entirely, while a properly preloaded web font with font-display: swap keeps shifts minimal
- Desktop devices and mobile devices often produce different core web vitals scores because mobile devices have slower processors and less stable network conditions; testing on both mobile and desktop is recommended when using any testing tool
- Different testing tools may report varying scores for the same URL because they use different methodologies, simulated conditions, and data sources; a pagespeed insights test combines lighthouse lab data with real chrome users' field data from CrUX, while a standalone lab tool shows only synthetic results
- To get enough data for a meaningful core web vitals assessment, test multiple URLs within the same page type rather than relying only on the homepage; monitor similar web pages in the same group to spot patterns across templates, not just individual URLs
- The performance panel inside Chrome DevTools allows developers to capture a profile of all page activity during page load, making it one of the most precise ways to debug performance issues and diagnose performance problems at the network-request level
- Integrating performance monitoring into the development workflow helps teams address performance issues before they reach production, rather than discovering slow pages after deployment
- Breaking up long-running javascript tasks improves how quickly the site responds to user input, reducing input delay and improving Interaction to Next Paint scores
- To run a core web vitals assessment across an entire site rather than one URL at a time, use search console's core web vitals report alongside a dedicated monitoring tool that can test core web vitals across many pages in a scheduled crawl
Theme
Tech Glass
Creative direction
Spec Sheet
Color system
Carbon Fiber
Style
Hub & Spoke (Anchor Nav)
Direction
Freemium/Trial
Page Sections
Animated Terminal Hero with Live Metrics
Hub and Spoke Anchor Navigation
Freemium Conversion Flow
Spec Sheet Section Architecture
Tech Glass Carbon Fiber Visual System
Dual Typography Stack for Diagnostic Clarity
Related questions
What core web vitals metrics does the template showcase?
Does a visitor need to sign up before running a scan?
Is this template desktop-first or mobile-first?
What is the difference between lab data and field data in this template's context?
Can the freemium conversion flow be customized for a different gating strategy?


