E-Commerce Portfolio & Conversion Architecture Website Template
Storefront is a bold brutalist e-commerce portfolio landing page built for conversion architects who let data do the talking. It features a tab-switching header, a benchmark comparison table, annotated screenshots, and a free-audit funnel. Every section is designed to show real performance numbers, build trust fast, and move visitors toward action.
by Rocket studio
Quick summary
Storefront is a single-page brutalist portfolio template for e-commerce builders and performance-focused agencies. It stacks client store case studies into a data-dense, report-style layout. Three header tabs showcase speed, conversion, and revenue results. A comparison table, pull-quote callouts, and annotated screenshots turn raw metrics into a compelling proof-of-work document.
Who this template is for
This template is built for people who sell e-commerce results, not just aesthetics. It speaks directly to practitioners who need their work to speak for itself through numbers.
- Freelance e-commerce designers and developers who want a portfolio that proves business impact
- Performance-focused agencies showing measurable lift to Shopify merchants and direct-to-consumer brand founders
- Marketing directors and consultants pitching store rebuilds with hard data as the primary argument
What problem this template solves
Most portfolio pages show pretty screenshots. Clients who've been burned by agencies that ship beautiful but underperforming stores need more than visuals. They need evidence.
- It replaces generic case study layouts with a benchmark-report structure that puts real metrics front and center
- It makes the gap between a visitor's current store performance and industry averages feel impossible to ignore
- It gives e-commerce practitioners a professional proof point that earns trust before a single sales call
What you get with this template
You get a fully structured, single-page portfolio layout with every section designed around conversion evidence. The template is built on a Carbon Fiber visual identity and ships with purpose-built components throughout.
- A three-tab header switcher showing speed scores, checkout flow comparisons, and a revenue graph
- A multi-column comparison table, pull-quote callout blocks, annotated screenshot panels, and a persistent bottom-bar call to action
- A dual-funnel conversion system: a free store audit form and an email-capture path for a downloadable benchmark report
Feature list
This template ships with six core components, each built to support a specific part of the portfolio-to-conversion flow.
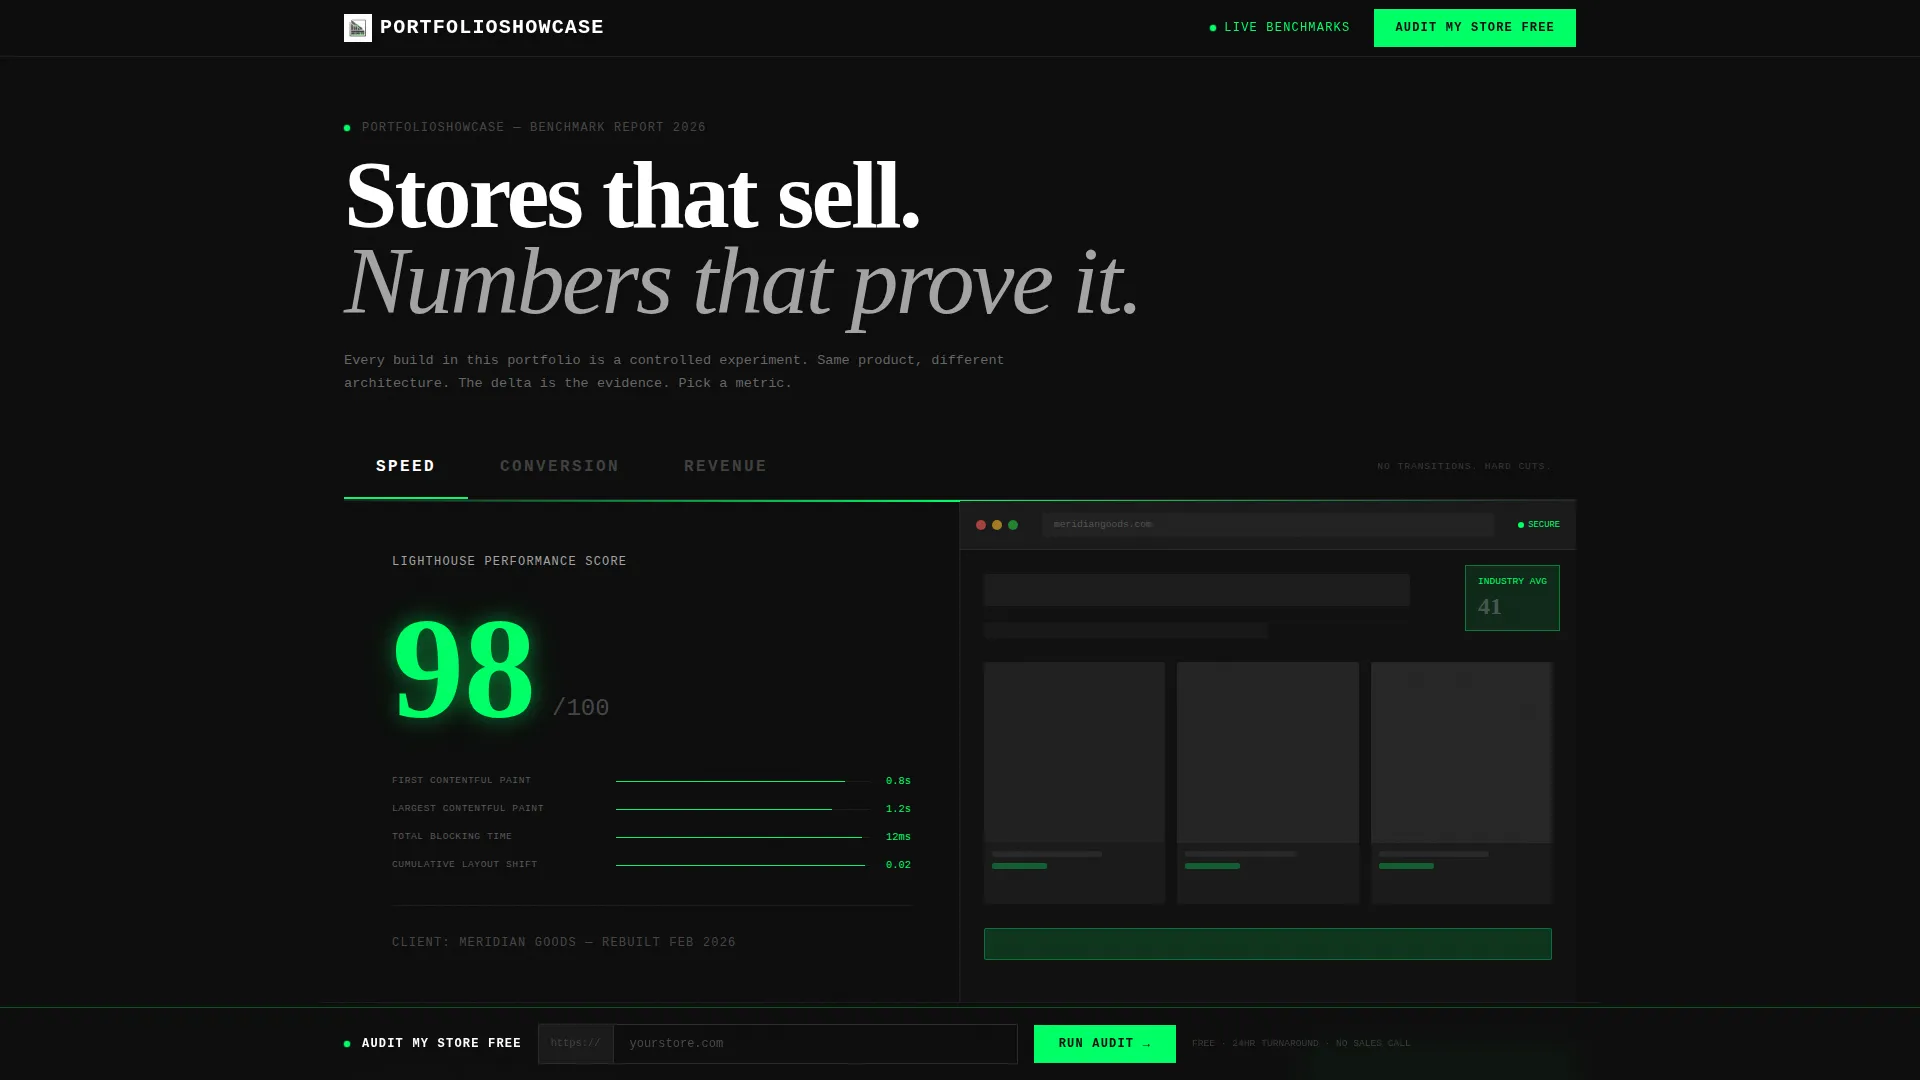
Feature Tab Switcher Header
Three oversized monospaced tabs labeled SPEED, CONVERSION, and REVENUE span the full viewport width. Each tab hard-cuts to a different portfolio proof panel: a Lighthouse score animation, a before-and-after checkout flow with average order value lift data, and a twelve-month revenue graph. The active tab receives a signal green underline. No transitions, just clean cuts.
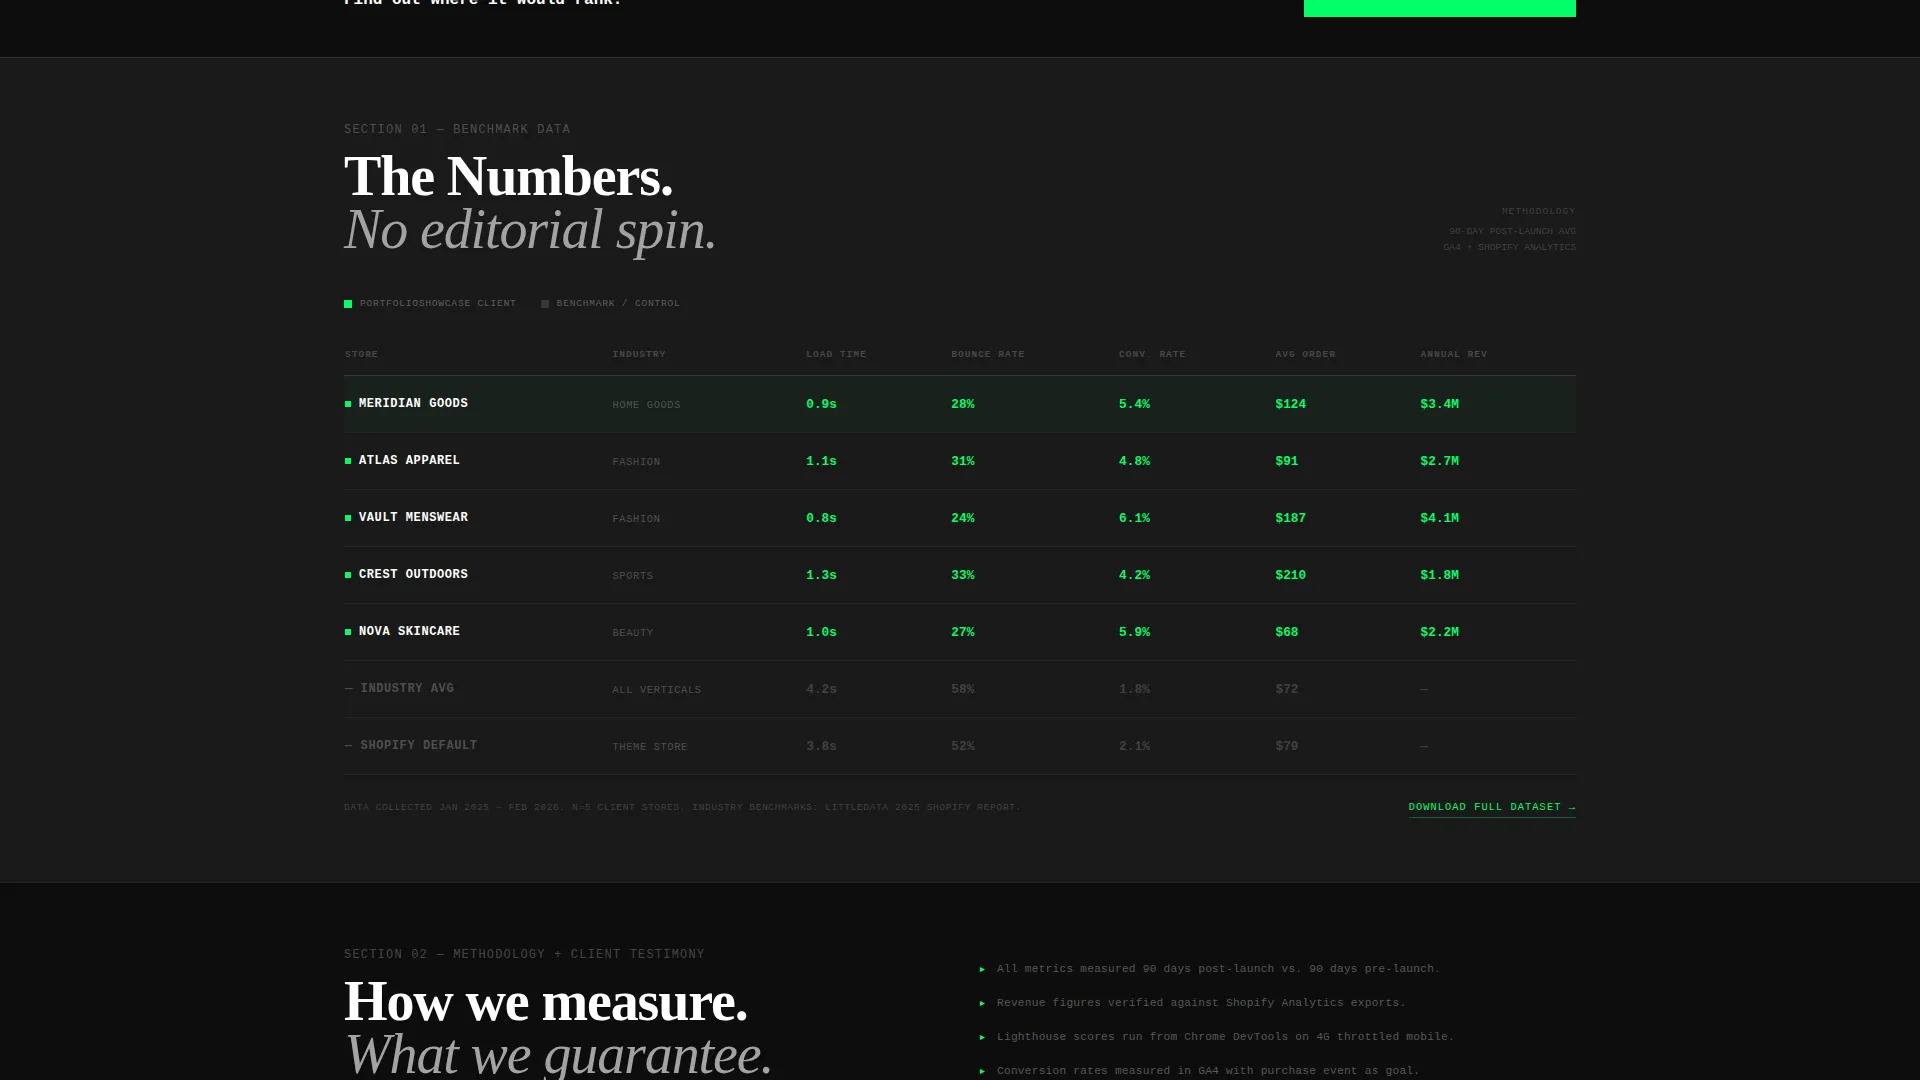
Benchmark Comparison Table
The centerpiece of the page is a multi-row comparison table. Client store metrics sit alongside industry averages across load time, bounce rate, conversion rate, and average order value. Every cell uses tabular numerals for precise typographic alignment. The table is formatted as the kind of data display you would find in a published industry report.
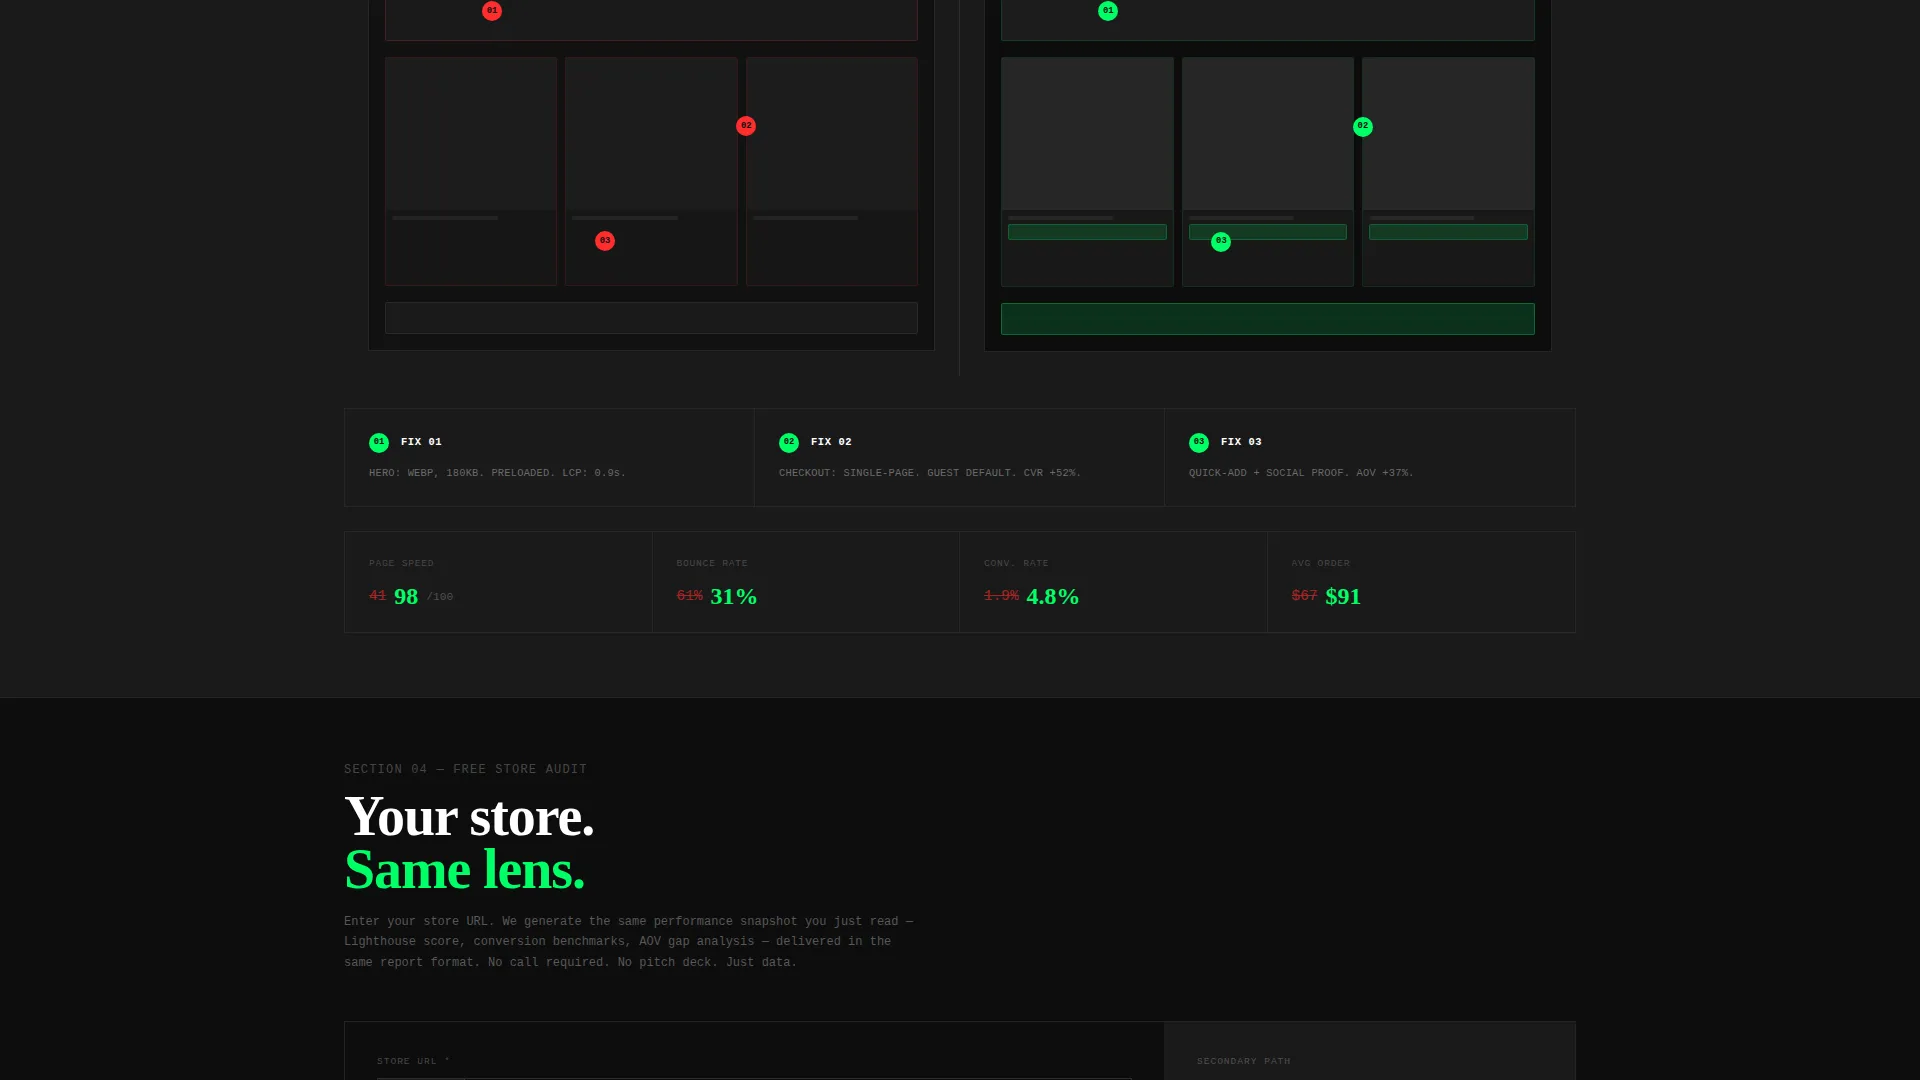
Annotated Screenshot Panels
Portfolio case studies include full-page store screenshots with brutalist red-line markup overlaid. Each annotation points to a specific change and connects it to a measurable outcome. This turns screenshots into evidence rather than decoration.
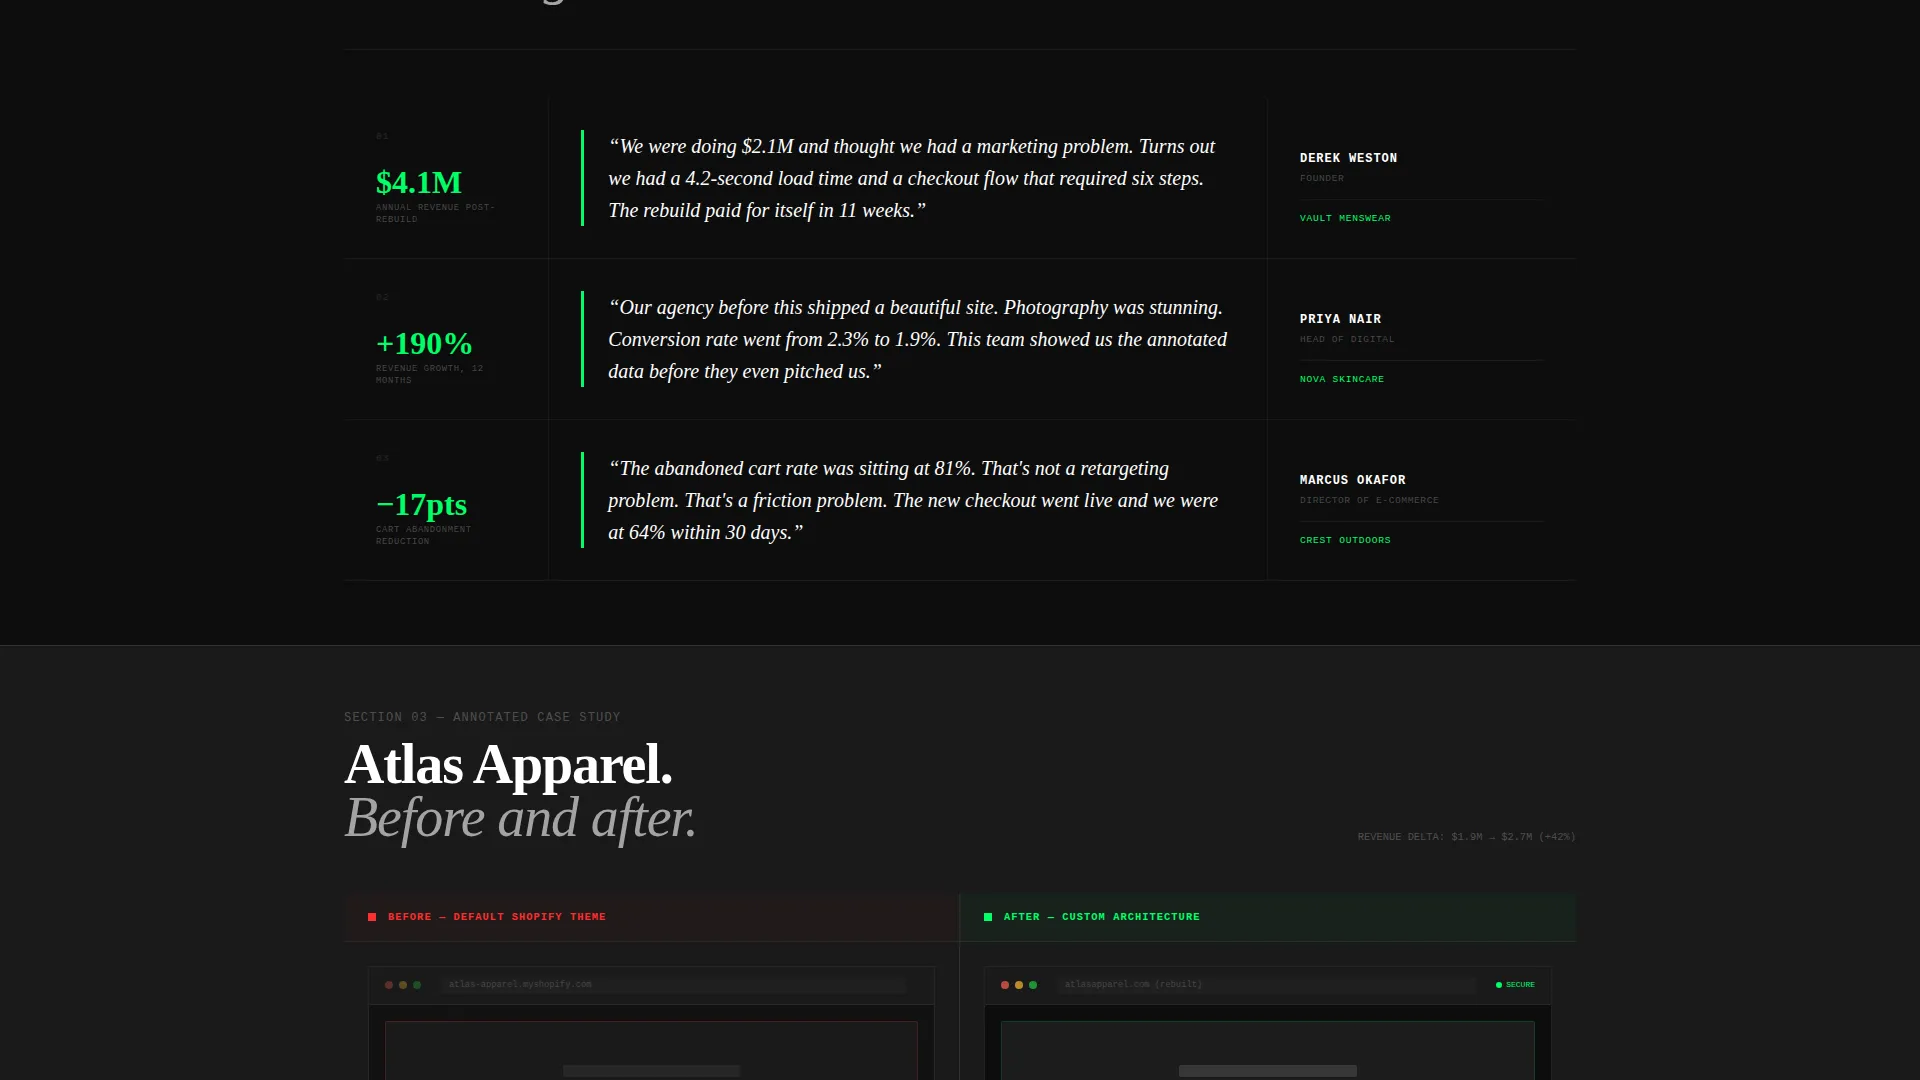
Pull-Quote Callout Blocks
Store owner quotes are displayed with their actual revenue numbers visible in the callout. These blocks are typeset with aggressive hierarchy to separate the quote from the supporting metric. They function as inline social proof woven into the report scroll.
Free Audit Conversion Funnel
The primary call to action, "Audit My Store Free," appears first inside the header and again as a persistent bottom bar after the second scroll. Clicking it opens a single-field URL input, a monthly revenue bracket dropdown, and a checkbox for competitor comparison. The audit output mirrors the report aesthetic, making visitors see their own store through the same benchmark lens.
Email Capture Secondary Path
A secondary conversion path labeled "Download the Full Benchmark Report" captures an email address for nurture. This gives visitors who are not yet ready for an audit a lower-commitment entry point. Both paths serve the same goal: moving a browser into a qualified lead.
Page sections overview
| Section | Purpose |
|---|---|
| Tab Switcher Header | Showcases speed, conversion, and revenue proof panels |
| Benchmark Comparison Table | Stacks client metrics against industry averages |
| Methodology Section | Explains how performance data was collected and measured |
| Pull-Quote Callouts | Surfaces real store owner results as inline social proof |
| Annotated Screenshots | Visualizes specific changes tied to measurable outcomes |
| Free Audit Form | Captures store URL and revenue bracket for lead generation |
| Persistent Bottom Bar | Keeps the primary call to action visible after second scroll |
| Email Capture Path | Offers benchmark report download in exchange for email |
Design & branding system
The visual identity is Bold Brutalist, built around a Carbon Fiber color system. The palette is intentionally severe: it treats the grid as the decoration and lets data carry the visual weight.
- Core colors are deep carbon black (#0D0D0D), exposed-grid charcoal (#1A1A1A), and machined aluminum (#A3A3A3); backgrounds alternate between the two dark tones to create depth without introducing color
- Signal green (#00FF66) is reserved exclusively for call-to-action elements and live data points, functioning like a single glowing indicator on an otherwise dark instrument panel
- Typography is monospaced and uppercase in key user interface elements; borders are 1px solid throughout, making the structural grid permanently visible as a design statement
Mobile & speed optimization
The template's layout is structured for performance across screen sizes. The brutalist grid system translates cleanly to narrower viewports without sacrificing the data-dense aesthetic.
- The comparison table and tab switcher are built to reflow on mobile without breaking the typographic hierarchy
- Hard-cut tab transitions and the absence of decorative animations keep the page lean and fast-loading by default
- The persistent bottom bar is designed to remain functional and unobtrusive on smaller screens throughout the scroll
How this template helps you convert
The entire page is architected around one goal: making a visitor feel that not knowing their own store's performance is no longer acceptable.
- The comparison table puts a visitor's implied metrics next to real client data and industry benchmarks, creating a visible performance gap that the free audit offer then closes
- Pull-quote callouts and annotated screenshots build compounding credibility as the user scrolls, so by the time they reach the audit form they have seen multiple receipts-on-the-table proof points
- The dual-path funnel captures both action-ready leads through the audit form and research-stage visitors through the email download, maximizing the value of every visit
Other information about this template
This template fits naturally within the e-commerce store website templates category and is purpose-built for the e-commerce store portfolio page niche. It is designed for a Technology category context where performance credibility is the primary sales asset.
- The Freemium/Trial conversion model built into this template is well-suited to practitioners who want to demonstrate value before asking for a commitment
- The Industry Report creative direction differentiates this page from typical agency portfolio formats by framing work as structured benchmark evidence
- The template style is a Comparison Table layout, making it especially effective for positioning against competitor stores or industry averages
Theme
Bold Brutalist
Creative direction
Industry Report
Color system
Carbon Fiber
Style
Comparison Table
Direction
Freemium/Trial
Page Sections
Feature Tab Switcher Header
Benchmark Comparison Table
Annotated Screenshot Panels
Pull-quote Callout Blocks
Free Audit Conversion Funnel
Email Capture Secondary Path
Related questions
Can I customize the metrics shown in the comparison table?
Do I need a live data source for the revenue graph?
Is the free audit form connected to any specific tool?
Who is the ideal user of this template?
Can I use this template without showing real client numbers?


