Stream — Data Processing Landing Page Template
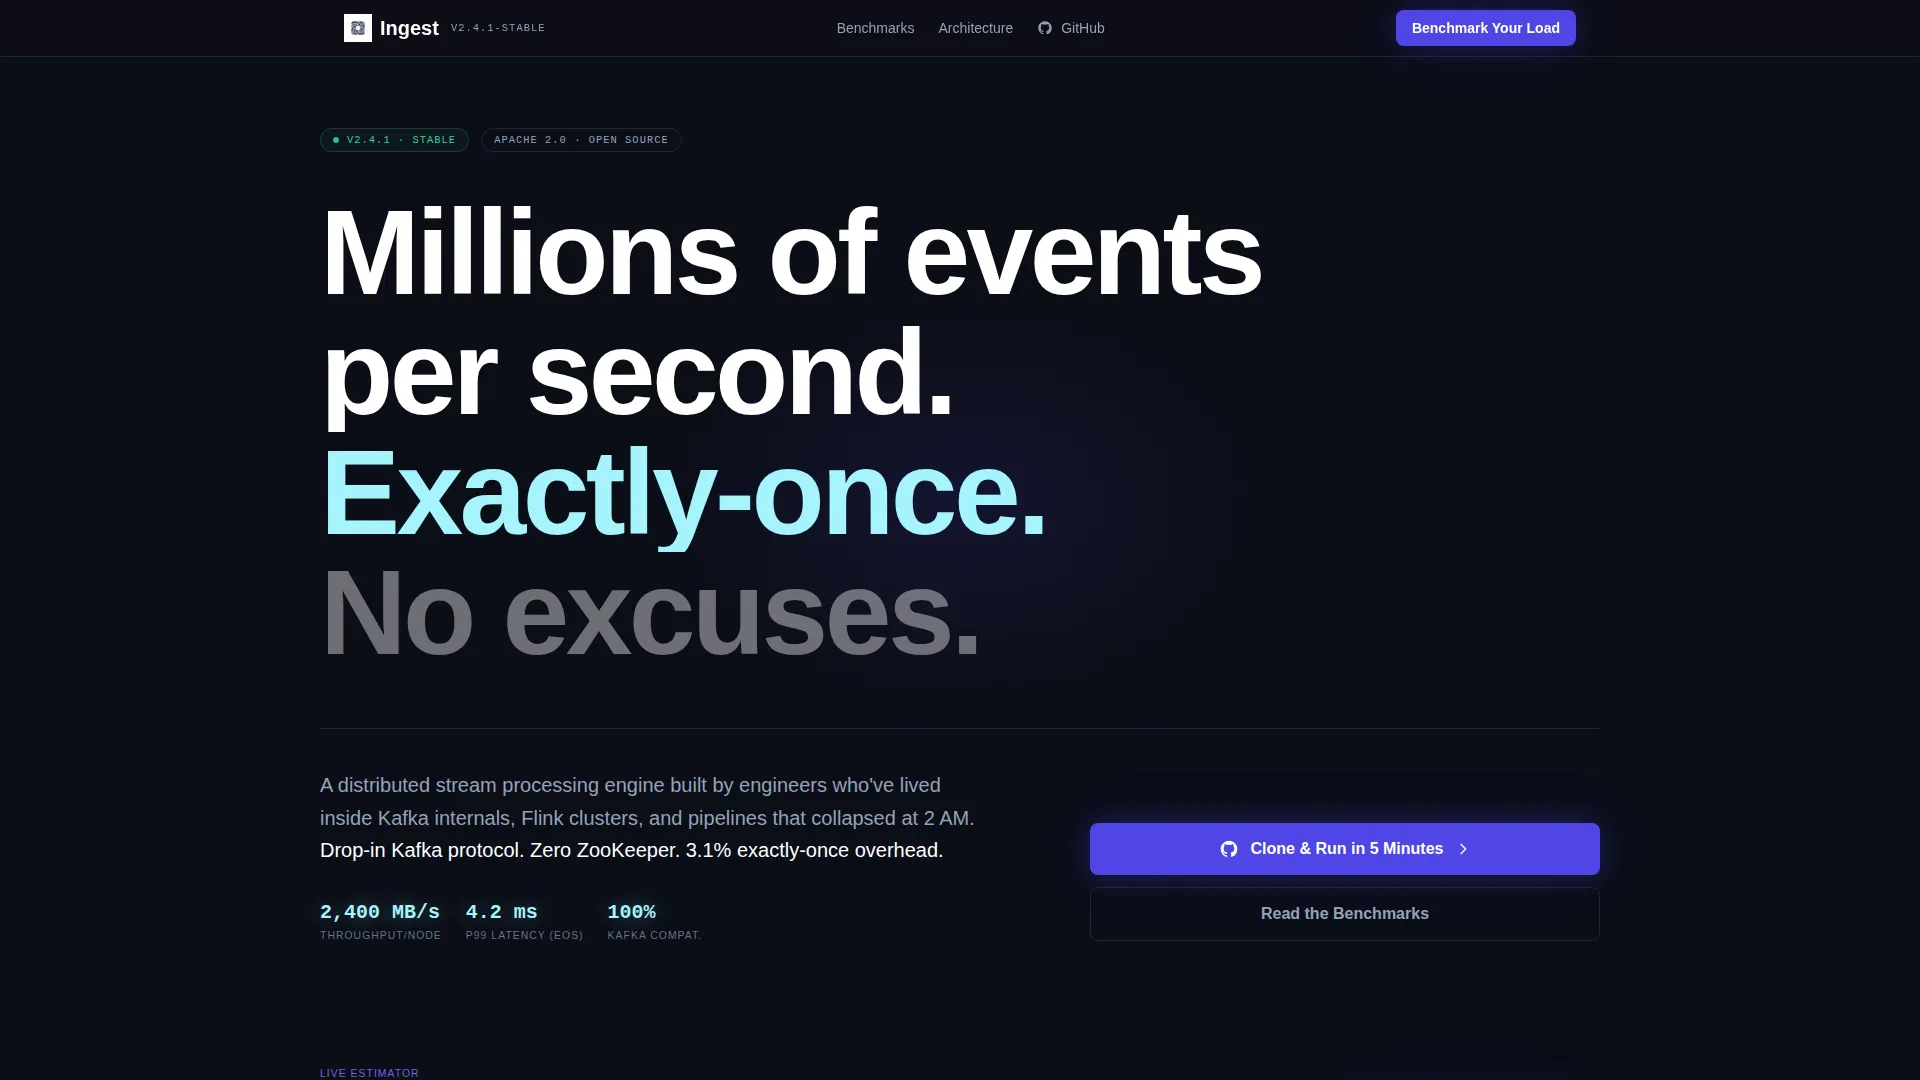
Ingest is a landing page template built for distributed stream processing open source projects. It features an interactive throughput estimator, head-to-head comparison tables with hard benchmark numbers, and a dark production-dashboard visual identity. The layout is designed to earn developer trust through auditable data and drive visitors toward a GitHub repository and quickstart documentation.
by Rocket studio
Quick summary
Ingest is a single-page template built for stream processing open source projects that need to earn developer trust fast. It leads with an interactive throughput estimator, moves through spec-sheet comparison tables, and closes with a persistent call-to-action bar. Every section is structured to show hard numbers before asking for a click.
Who this template is for
This template is built for technically sophisticated audiences who evaluate infrastructure tools by reading benchmarks, not marketing copy. If your project needs to speak directly to engineers making high-stakes infrastructure decisions, this page structure fits that conversation precisely.
- Platform engineers who monitor real-time pipelines and respond to backpressure alerts
- Data infrastructure leads evaluating whether to replace an existing messaging layer
- Startup technical leaders who need real-time analytics without the overhead of expensive managed services
What problem this template solves
Most open source infrastructure projects struggle to communicate their value to the engineers who matter most. A generic readme or a marketing-flavored homepage fails when the visitor is a senior engineer who can smell vague claims from a mile away. This template solves the credibility gap.
- It replaces "up to" asterisks with a comparison table format that shows exact numbers per metric
- It lets visitors benchmark their own workload before they read a single claim from the project team
- It connects every performance assertion to a linked methodology, removing the most common reason engineers bounce
What you get with this template
You get a complete, single-page landing page layout structured around a spec-sheet creative direction. The design, interactive components, and content sections are all defined and ready to customize for your stream processing project.
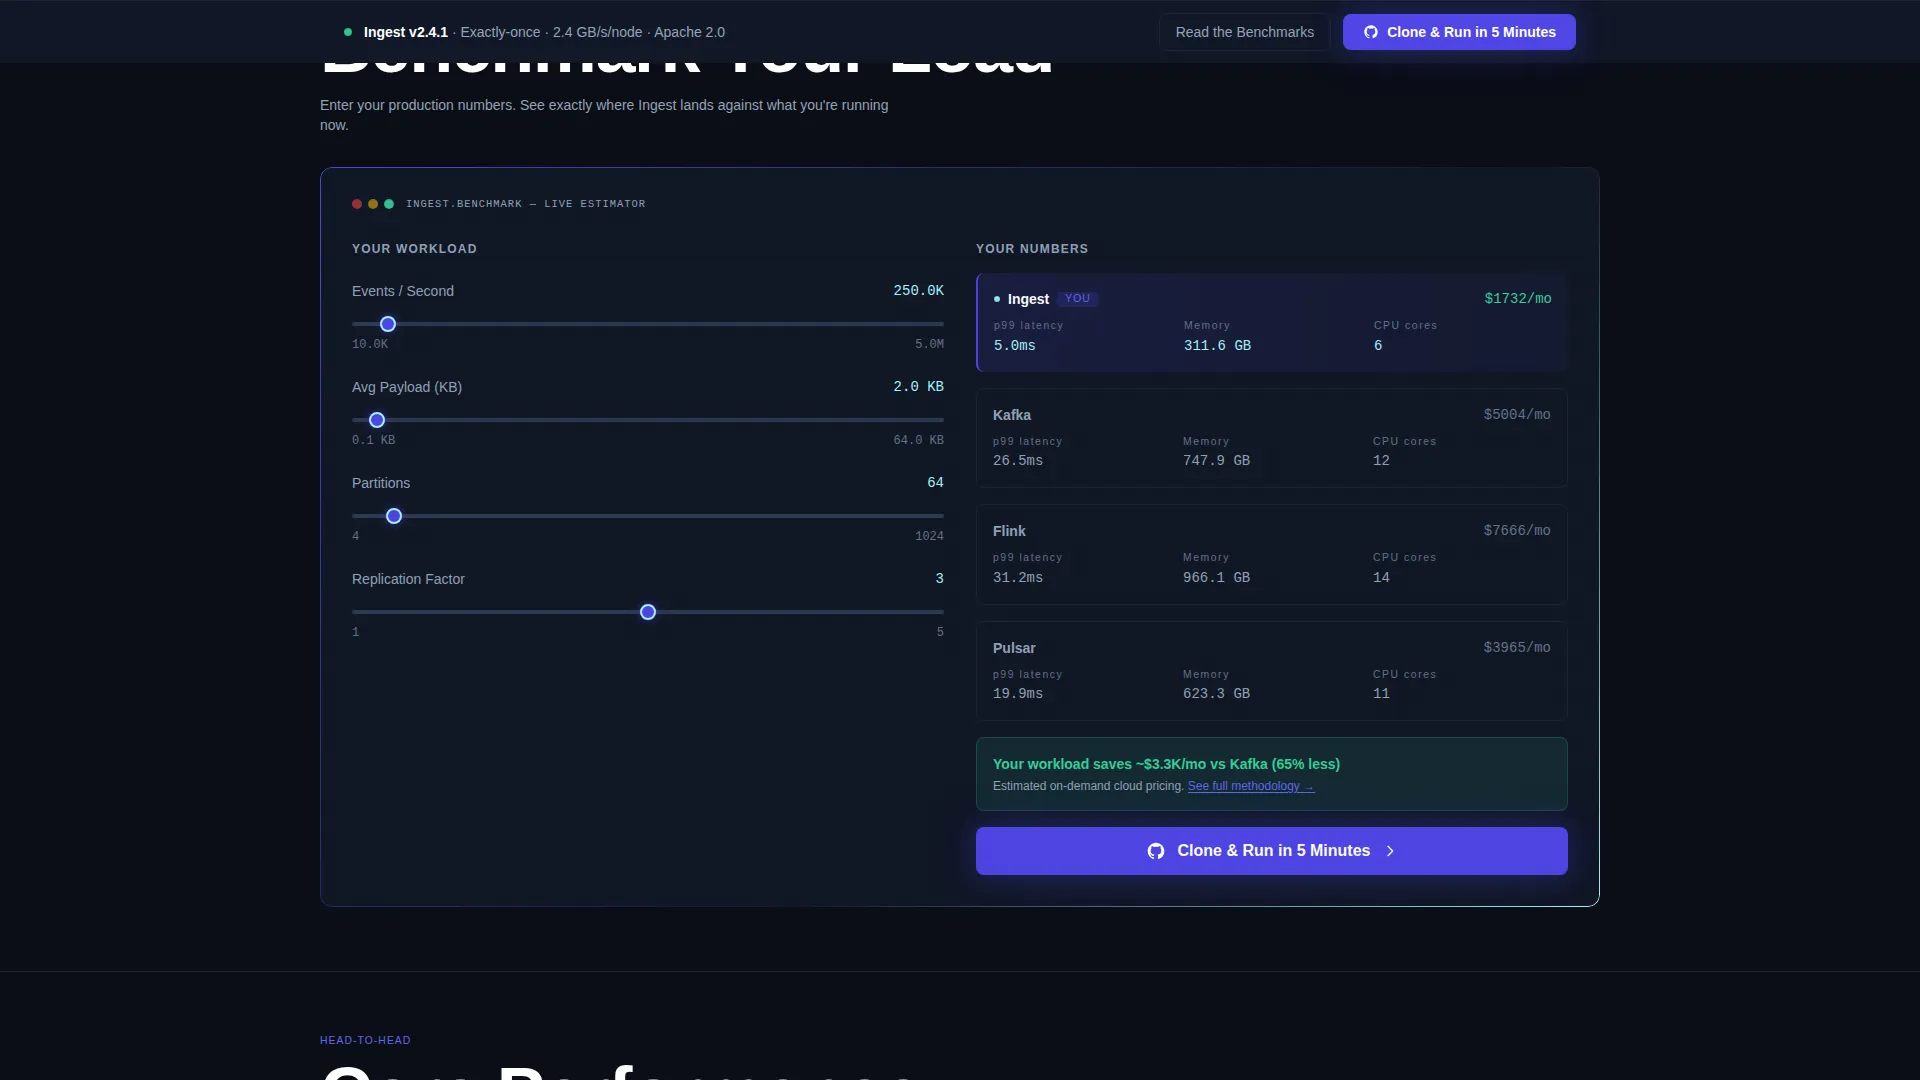
- An interactive throughput estimator in the header that calculates latency, cluster footprint, and cost estimates as visitors adjust input sliders
- Multiple head-to-head comparison tables with highlighted winning rows, honest tie rows, and a dependency diagram section
- A persistent bottom call-to-action bar and inline call-to-action placement inside calculator results
Feature list
This template includes the following purpose-built components and layout features.
Interactive Throughput Estimator
The header section contains a calculator where visitors input events per second, average payload size, number of partitions, and replication factor. The tool instantly calculates estimated latency at the 99th percentile, cluster resource footprint, and a cost comparison. Numbers animate as sliders move, so the visitor sees their own workload benchmarked in real time.
Head-to-Head Comparison Tables
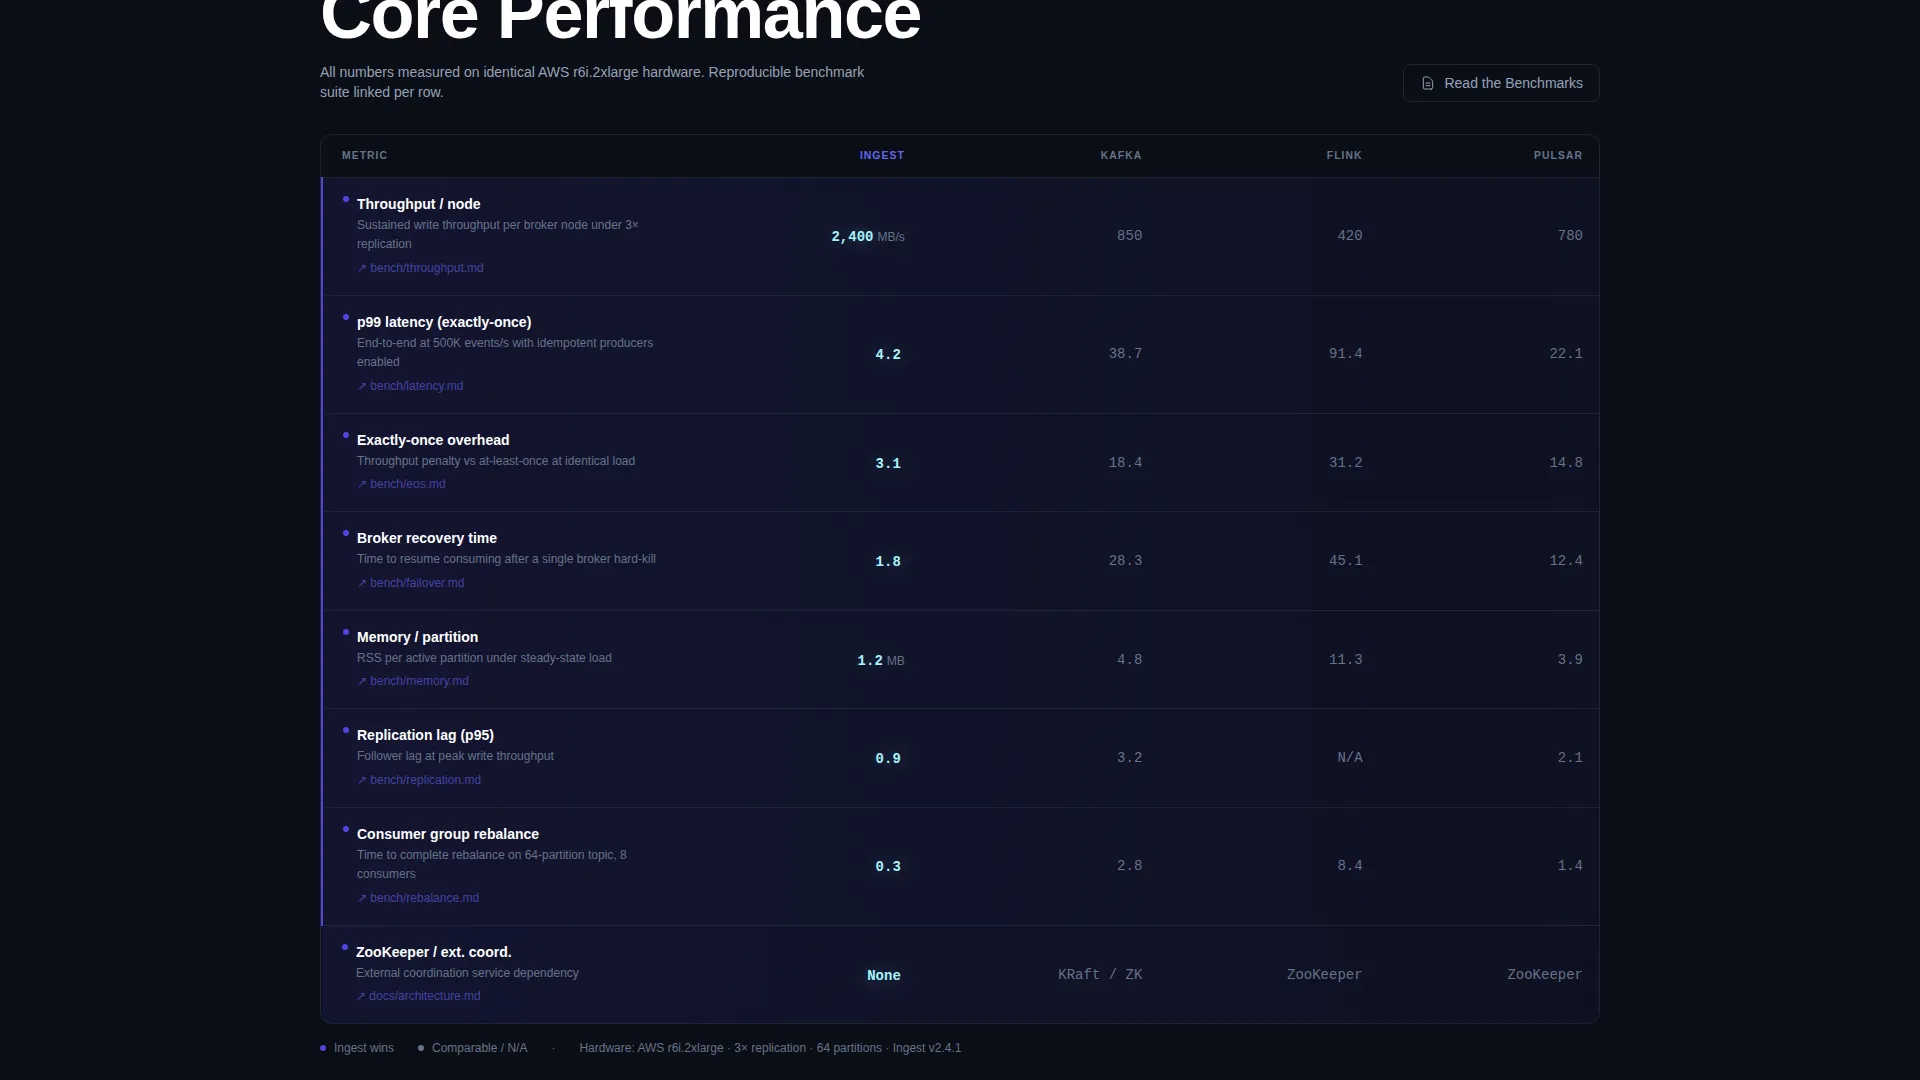
Each scrollable section presents a structured comparison table with hard numbers across key metrics. Metrics include throughput per node, exactly-once overhead, recovery time from broker failure, and memory footprint per partition. The electric indigo highlight row marks where the project wins. An honest gray row marks where it matches a competitor, with no exaggerated claims.
Dependency Diagram Section
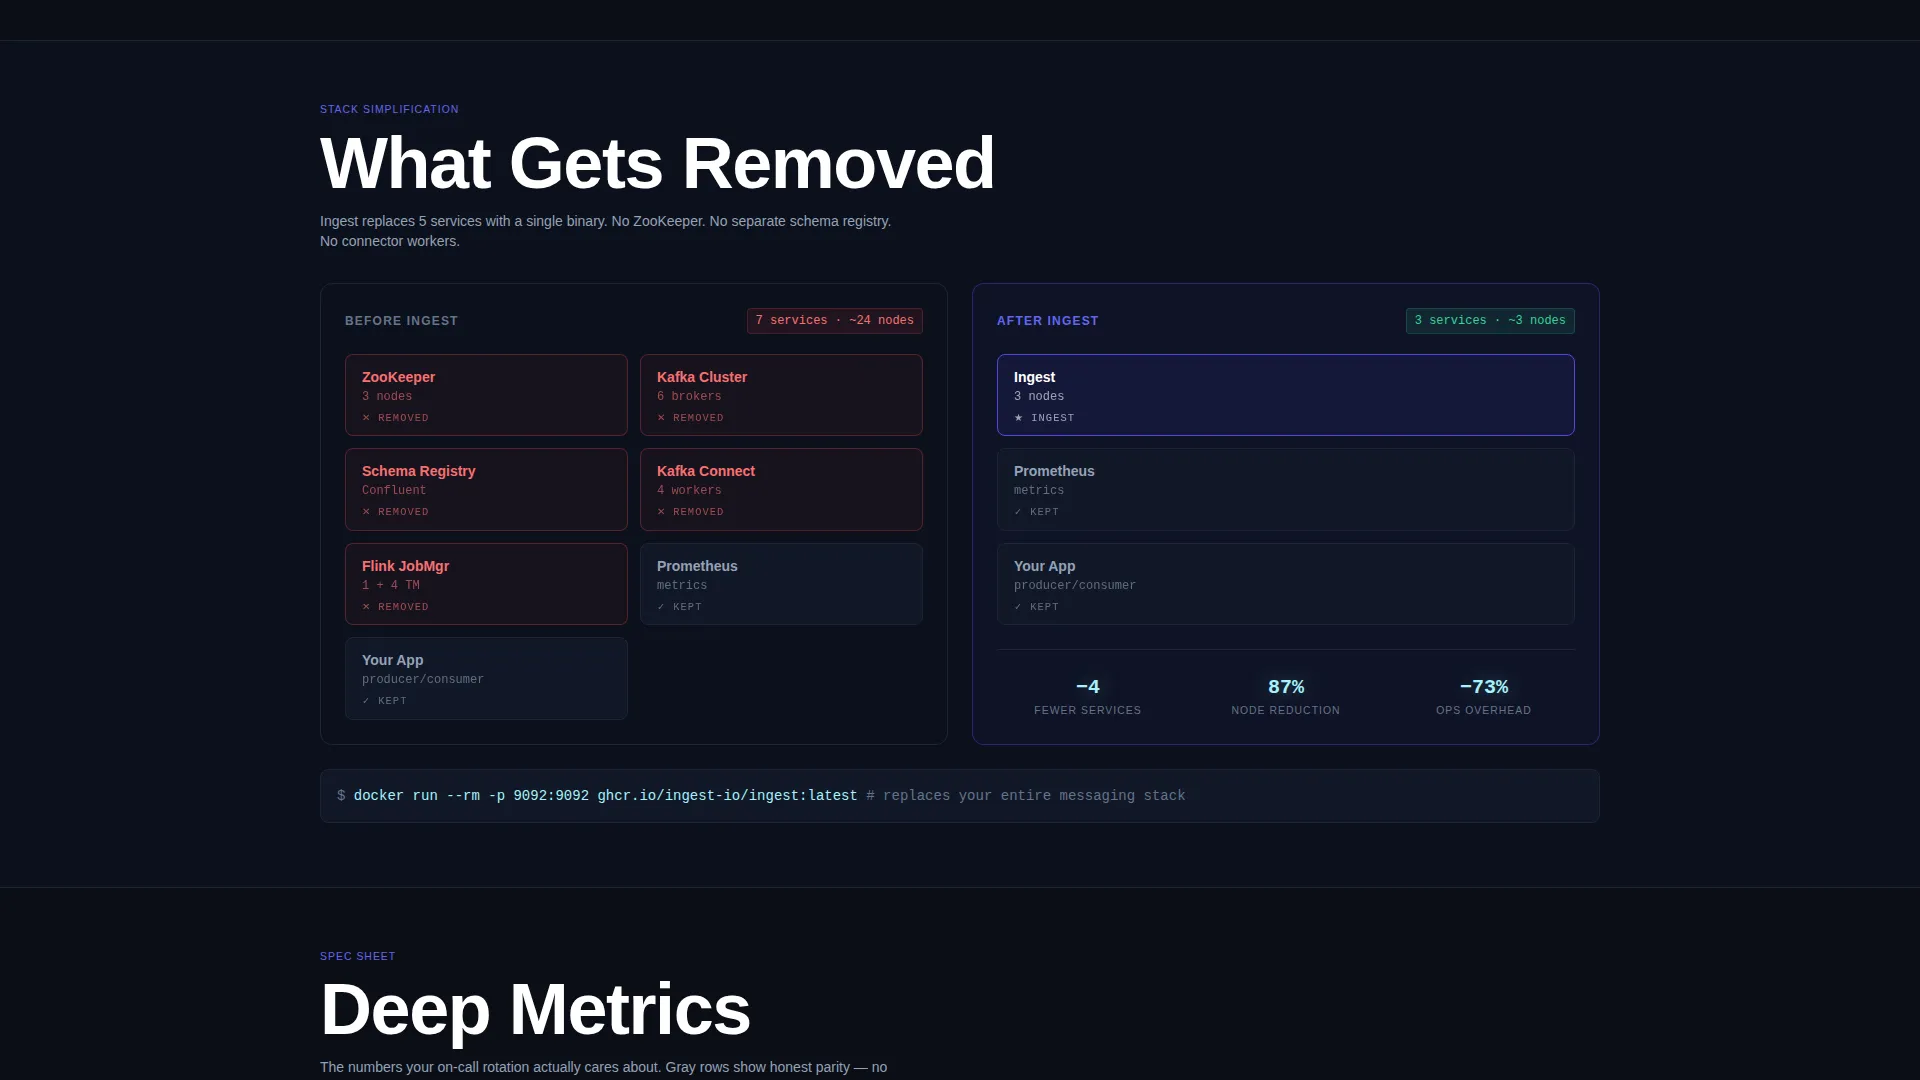
Midway through the page, a visual dependency diagram shows which components get removed from the infrastructure stack when using this project. This section communicates architectural simplification without requiring prose explanation, which resonates strongly with engineers evaluating migration complexity.
Persistent Call-to-Action Bar
After the first comparison table, a persistent bottom bar appears and stays visible as the visitor scrolls. The primary call-to-action, "Clone and Run in 5 Minutes," links to a one-command Docker setup. A secondary call-to-action, "Read the Benchmarks," links to the full reproducible benchmark suite.
Production Dashboard Visual Identity
The entire page uses a dark color system built around void black, electric indigo, terminal phosphor, and muted slate. The aesthetic feels like a production monitoring dashboard, which immediately signals competence to engineers who spend time in terminal environments and observability tools.
Spec Sheet Content Structure
Every scroll section is structured as a data-first benchmark report, not a feature list. This creative direction respects the reader's technical intelligence and eliminates the credibility friction that generic marketing pages create with infrastructure-focused audiences.
Page sections overview
| Section | Purpose |
|---|---|
| Throughput Estimator Header | Lets visitors input their own workload and see real-time latency, resource, and cost estimates |
| Estimator Results Line | Displays the visitor's benchmarked workload against three alternatives in a single summary line |
| Comparison Table Block | Shows head-to-head metrics with indigo highlights for wins and gray rows for matched results |
| Dependency Diagram | Visualizes which stack components are eliminated when adopting the project |
| Benchmark Methodology Links | Connects every data claim to a linked, reproducible benchmark suite |
| Persistent call to action Bar | Stays visible after the first table with primary and secondary action links |
Design & branding system
The visual identity follows a Directory and Discovery theme built around the Electric Indigo color system. The overall feeling is a production monitoring dashboard at 2 AM: dark, precise, and purposeful.
- Void black (#0B0E17) as the primary background, electric indigo (#4F46E5) for interactive elements and table highlights, terminal phosphor (#A5F3FC) for metric values and data points, and muted slate (#94A3B8) for secondary text and table borders
- Typography and layout follow a Spec Sheet creative direction where every section reads like a benchmark report rather than promotional copy
- Animated number transitions inside the estimator reinforce the dashboard aesthetic and keep the interaction tactile and responsive
Mobile & speed optimization
The template is designed with a layout structure that supports clean rendering across device sizes. The comparison table format and estimator component are built to remain readable and functional at smaller viewport widths.
- Comparison tables are structured for horizontal scrollability on smaller screens so no metric data is hidden or truncated
- The persistent call-to-action bar is sized and positioned to remain visible and tappable without obscuring content on mobile viewports
- Slider-driven estimator inputs are designed to work with both mouse and touch interaction patterns
How this template helps you convert
The page is built as a click-through landing page with a clear conversion path toward the GitHub repository and quickstart documentation. The conversion logic is sequenced deliberately.
- The estimator in the header creates personal relevance first. Visitors see their own numbers before they read any claim from the project, which builds immediate trust.
- The comparison tables substantiate every claim with measurable data and linked methodology, so the visitor arrives at the call-to-action already convinced rather than still skeptical.
- The persistent bottom bar and inline call-to-action placement inside calculator results ensure the primary action is always one click away, reducing friction at the moment of decision.
Other information about this template
This template is categorized under Technology, specifically within the Stream Processing Technology subcategory and the Stream Processing Open Source Project niche. It is designed for projects that position themselves against established tools in the distributed data infrastructure space.
- The template style is Comparison Table, making it well suited for projects that can back their positioning with reproducible benchmark data
- The header concept is Calculator and Estimator, a format that performs well for technical audiences because it delivers immediate, personalized value before asking for any commitment
- The landing page direction is Click-Through, optimized to move visitors from curiosity to a specific action without requiring intermediate steps such as form fills or email capture
- The intersection match score for this template against its niche and subcategory context is 13, indicating strong alignment between the template design system and the target use case
Theme
Directory & Discovery
Creative direction
Spec Sheet
Color system
Electric Indigo
Style
Comparison Table
Direction
Click-Through
Page Sections
Interactive Throughput Estimator
Head-to-head Comparison Tables
Dependency Diagram Section
Persistent Call-to-action Bar
Production Dashboard Visual Identity
Benchmark Methodology Links
Related questions
What kind of project is this template designed for?
Can I customize the metrics shown in the comparison tables?
How does the throughput estimator work in this template?
What calls-to-action are included in this template?
Is this template suited for commercial products or only open source projects?



