Stream Processing Technology Professional Website Template
Stream is a scroll-reveal landing page template built for stream processing platforms. It opens with a live, interactive dataflow canvas and unfolds like an industry report through progressive sections. The design uses a high-contrast Acid Digital palette, void black, phosphor green, and electric violet, to give every data-in-motion state its own visual weight.
by Rocket studio
Quick summary
Stream is a single-page, scroll-reveal landing page template designed for real-time data processing platforms. It opens with an interactive dataflow header and progressively reveals content in report-style chapters. The visual system uses a dark, high-contrast Acid Digital palette, and every primary call to action points toward a CLI install or browser sandbox.
Who this template is for
This template is built for technical teams and infrastructure-focused businesses that need to communicate the value of a stream processing platform quickly and credibly.
- Backend engineers and data platform leads who need a page that speaks their language without dumbing things down.
- Startup CTOs who want to attract early adopters without dedicating weeks to custom web development.
- Developer tool companies or platform teams launching a real-time event processing product to a technical audience.
What problem this template solves
Most developer product pages fail because they look like marketing brochures. They use static screenshots, generic claims, and a single wall of text. Stream processing technology is fundamentally about motion and throughput, and a static page cannot communicate that.
- Backend engineers distrust platforms that cannot show real performance evidence upfront.
- Data platform leads need credibility content, like benchmark comparisons and architecture diagrams, to justify infrastructure investment internally.
- Without a clear, guided scroll experience, technical visitors leave before they reach the install step.
What you get with this template
You get a complete, structured landing page that moves the visitor from curiosity to confidence to action. Every section is deliberate, and each one earns the next through scroll-triggered reveals.
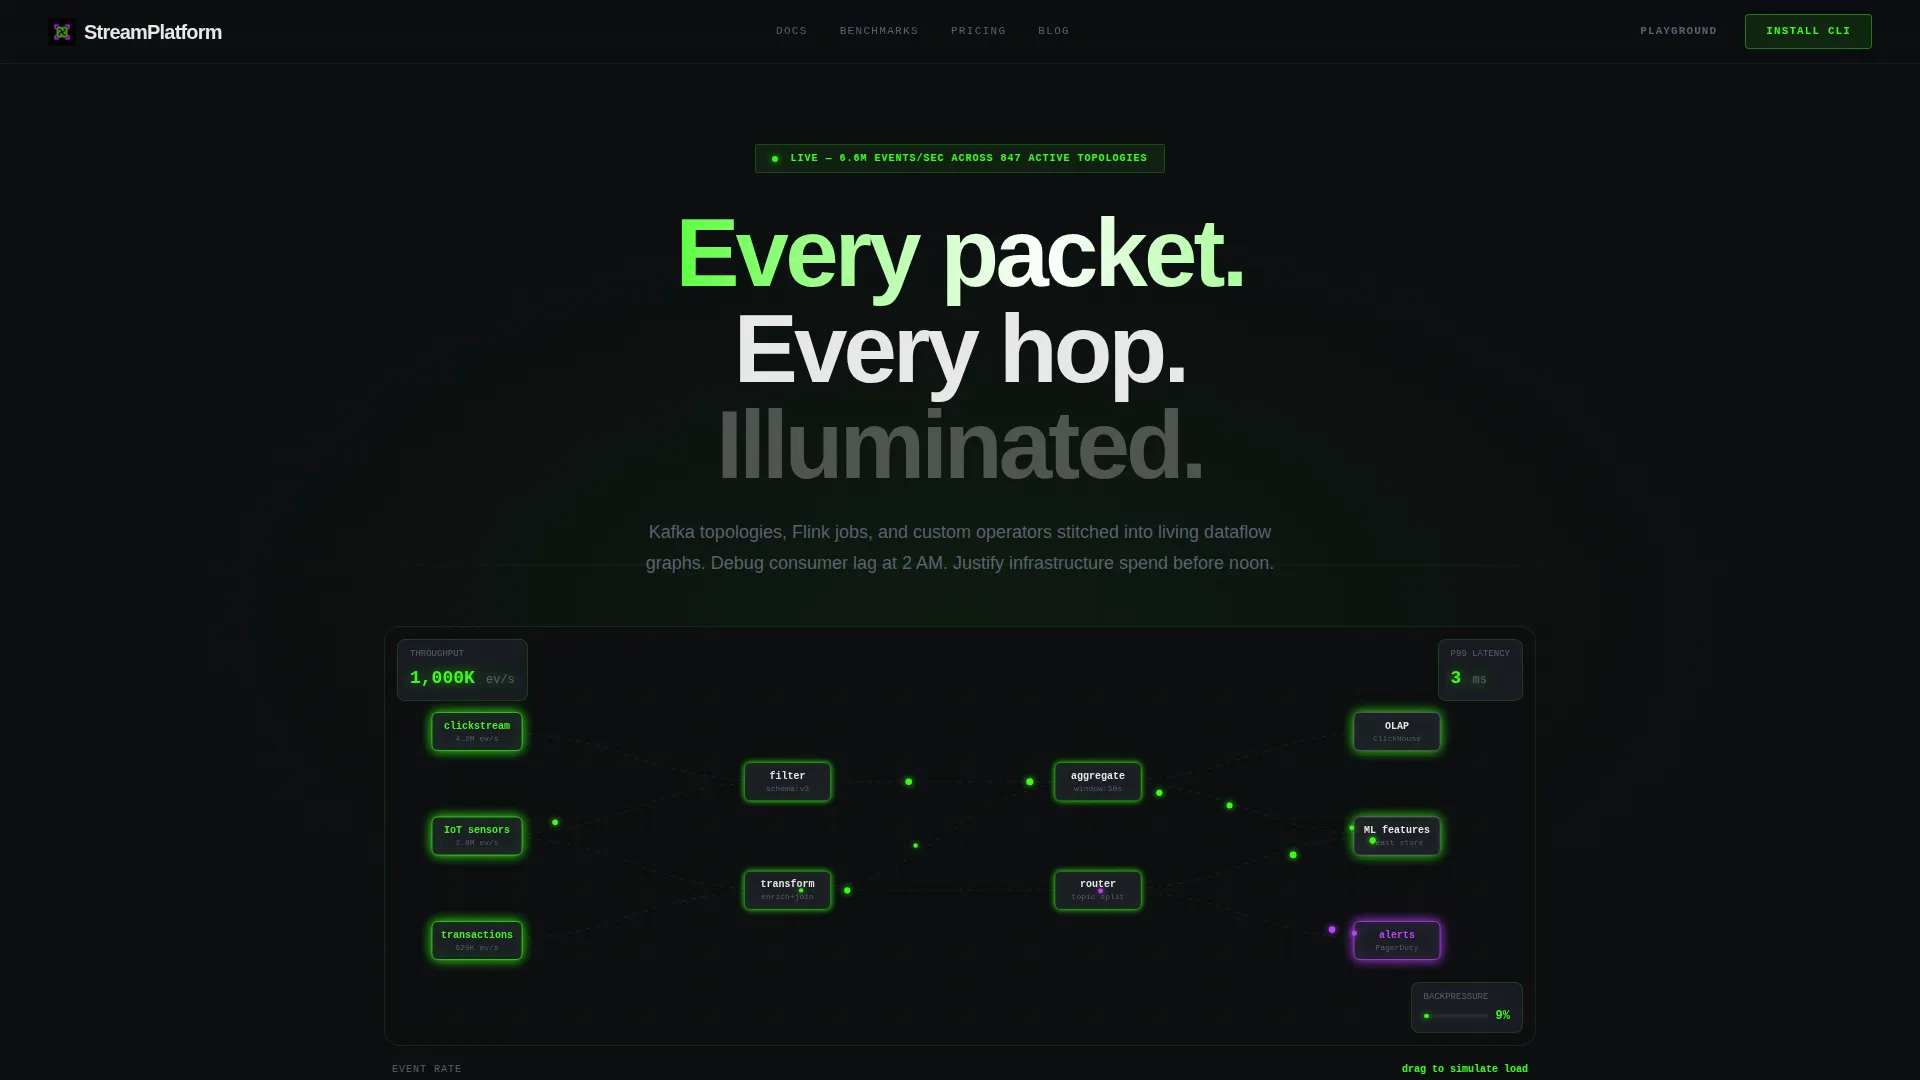
- An interactive header with a live dataflow canvas, animated particle flows, and a draggable throughput slider ranging from 1K to 10M events per second.
- Four progressive report-style content chapters covering latency cost arguments, architecture diagrams, benchmark comparisons, and a filterable company directory.
- Two conversion paths: a primary CLI install block with a copyable terminal command and OS auto-detection, and a secondary sandbox link requiring only a GitHub sign-in.
Feature list
This template ships with purpose-built components that reflect how stream processing platforms actually work and what technical buyers actually need to see.
Interactive Dataflow Header Canvas
A functioning miniature dataflow canvas sits at the top of the page. Three labeled source nodes, including clickstream, IoT sensors, and transactions, emit animated particles that travel through filter and transform operators. Nodes split and merge visibly in real time, making the product's core behavior the first thing a visitor experiences.
Throughput Slider with Live Counters
Visitors can drag a slider from 1K to 10M events per second and watch particle density shift, latency counters tick, and backpressure indicators change color from phosphor green to electric violet. This single interaction demonstrates product scale without requiring any signup.
Progressive Scroll-Reveal Chapters
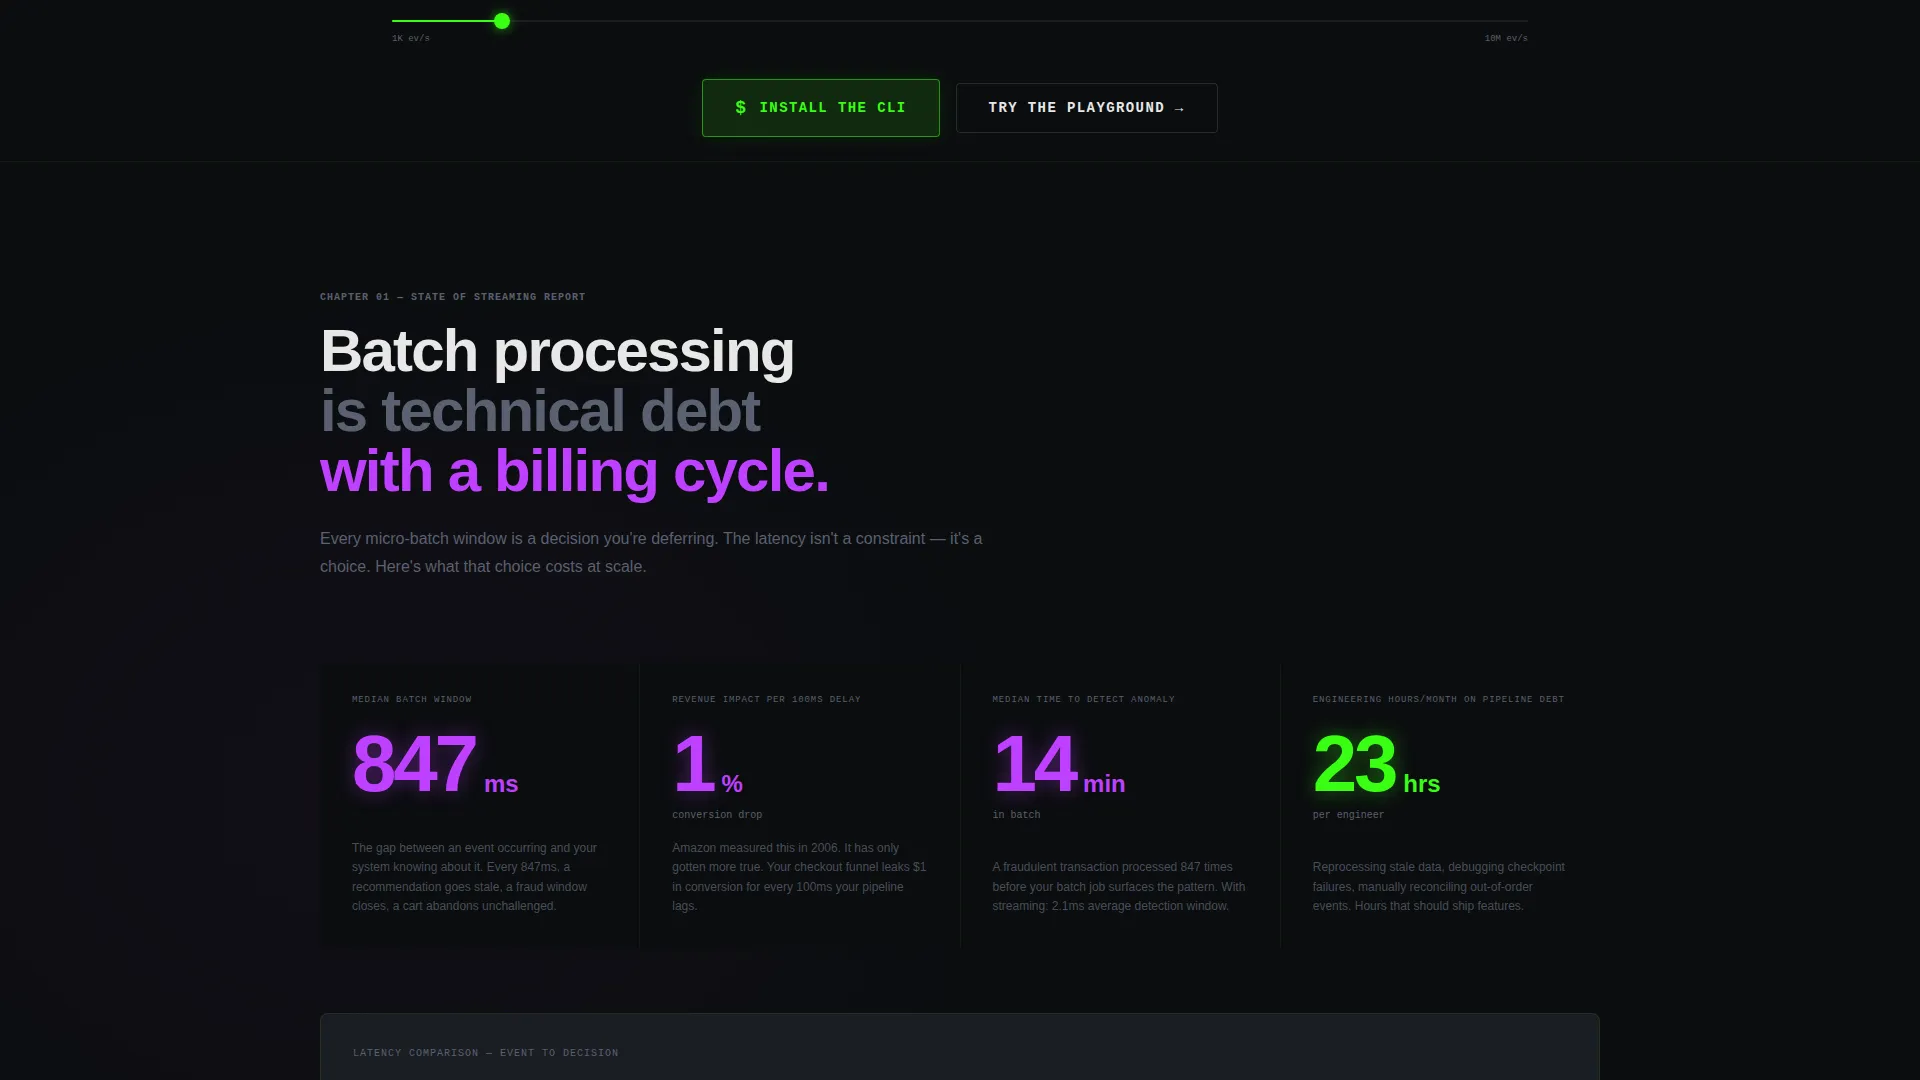
Content loads only as the visitor scrolls to each section. The four chapters, covering batch latency debt, topology architecture, benchmark data, and a live company directory, each reveal independently, so the page feels earned rather than dumped.
Comparative Benchmark Section
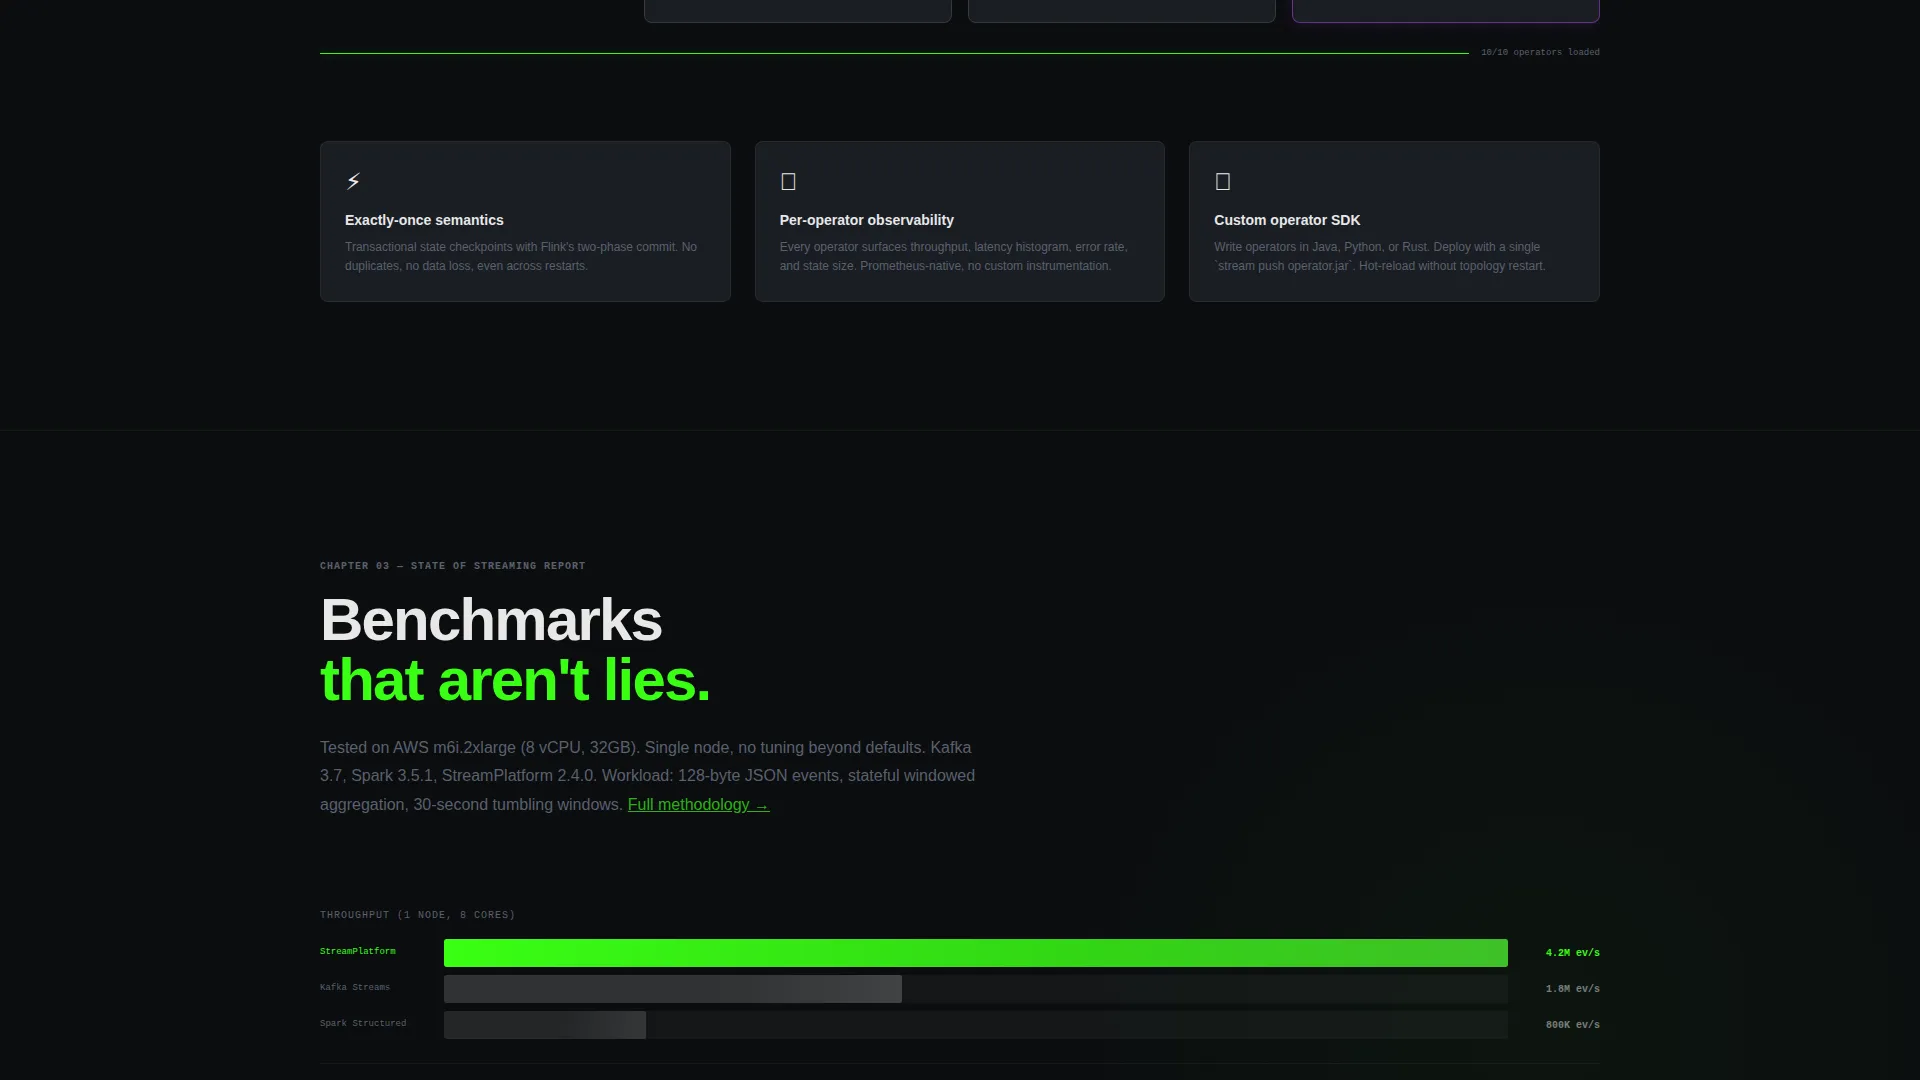
A dedicated section slides in throughput comparison charts with methodology footnotes. This gives data platform leads and infrastructure decision-makers the evidence they need to defend a purchasing decision internally.
Filterable Company Directory
A living directory of companies and use cases is embedded in the page and filterable by industry. This social-proof layer lets visitors quickly find relevant examples without scrolling through unrelated content.
Dual-Path Conversion Block
The primary call to action presents a one-line terminal install command in a copyable code block with automatic OS detection for macOS, Linux, and Docker. A secondary path links to a browser-based sandbox accessible with a single GitHub OAuth click, lowering the barrier to a first hands-on experience.
Page sections overview
| Section | Purpose |
|---|---|
| Interactive Header Canvas | Opens with a live dataflow demo and throughput slider |
| Why Batch Is Debt | Presents latency cost arguments with animated counters |
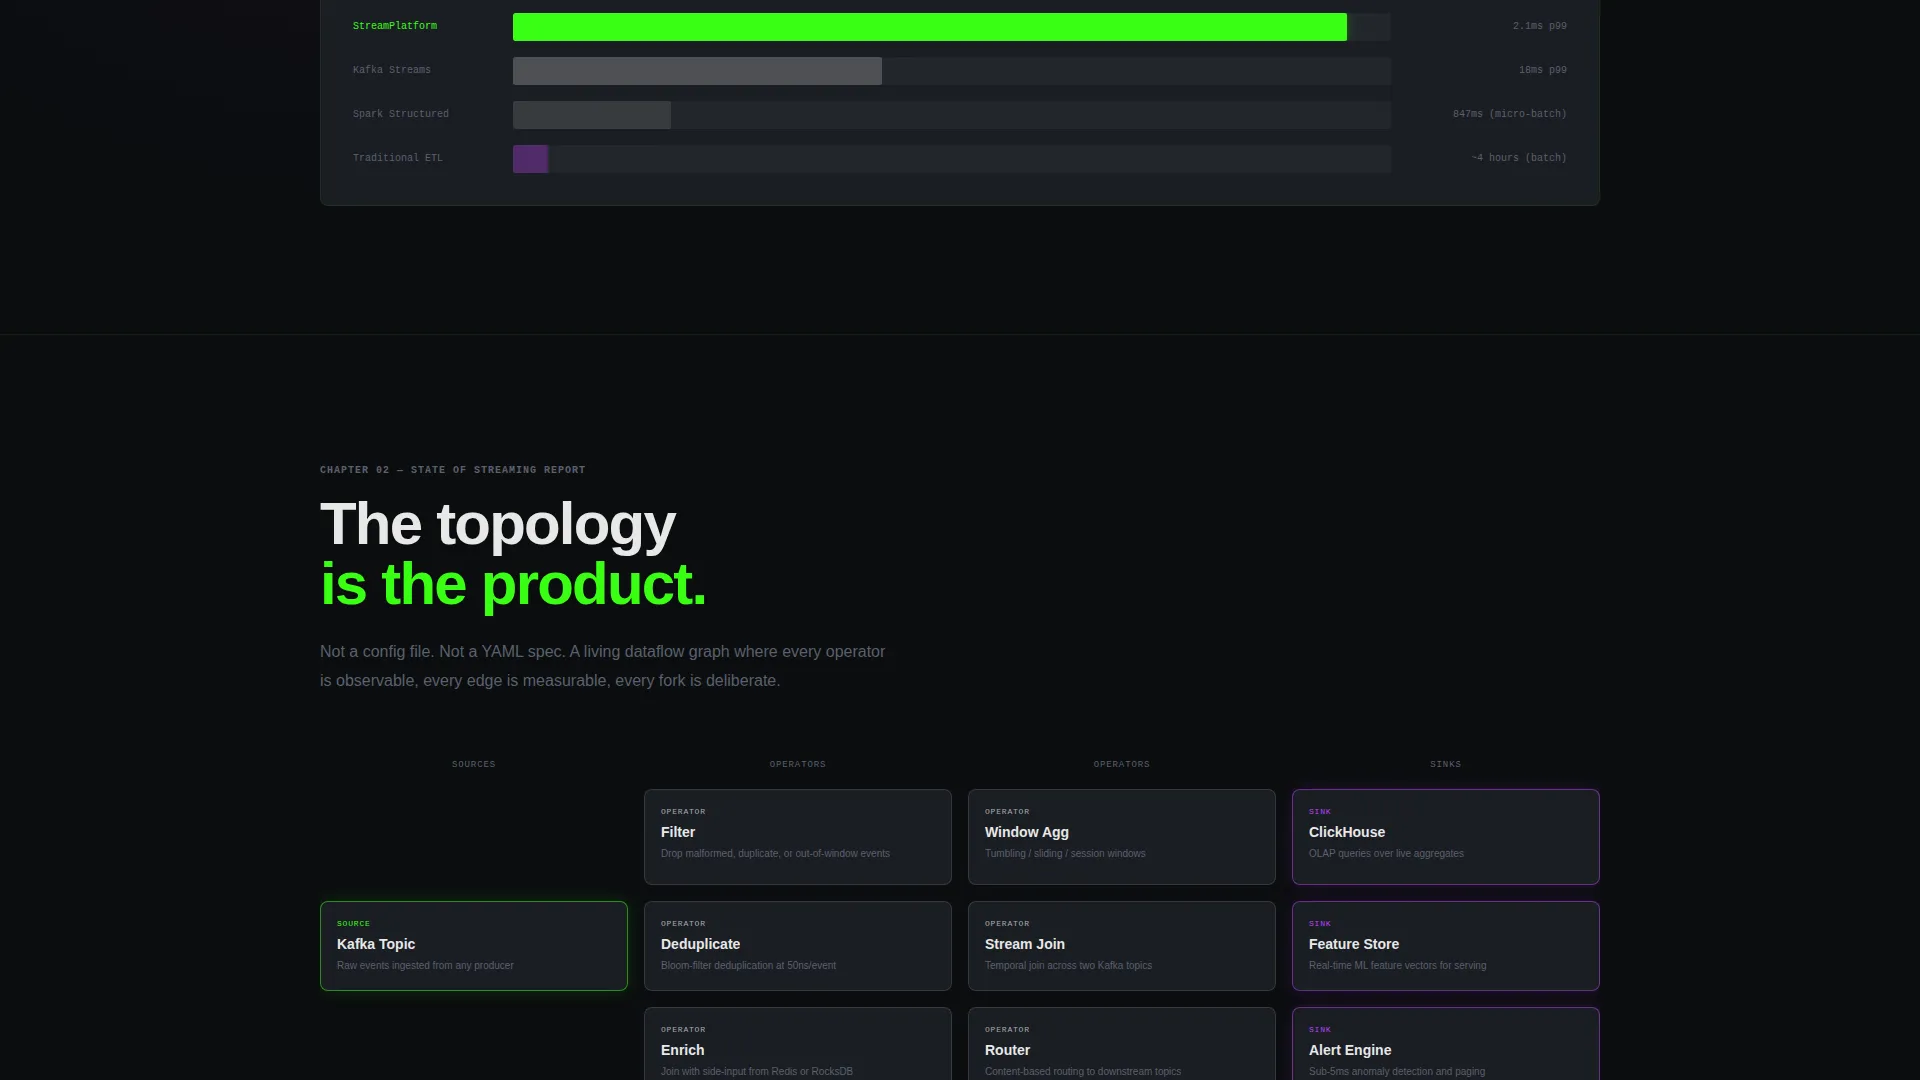
| The Topology Advantage | Reveals architecture diagrams node by node on scroll |
| Benchmarks That Aren't Lies | Slides in comparative throughput charts with methodology notes |
| Who Shipped This Week | Displays a filterable directory of companies and use cases |
| CLI Install Block | Delivers the primary download call to action with OS detection |
| Playground call to action | Offers a secondary sandbox path via GitHub sign-in |
Design & branding system
The visual identity follows an Acid Digital color system anchored in deep, power-efficient darkness. Every bright element earns its glow against a void black background, making the interface feel like a live server console rather than a standard marketing page.
- Core palette: void black (#0B0D0F) as the base, terminal phosphor green (#39FF14) for data-in-motion states, electric violet (#BF40FF) for anomalies and alert indicators, cold interface gray (#1A1D23) for card surfaces, and off-white (#E8E8E8) for floating HUD-style text.
- Green and violet carry semantic meaning throughout the page: green signals healthy throughput and active data flow, while violet marks backpressure, alerts, and architectural fork points.
- Card surfaces stack in cold interface gray like log entries in a console, reinforcing the Directory and Discovery theme with a consistent depth system.
Mobile & speed optimization
The scroll-reveal structure is designed to load content progressively, so heavy visual sections only activate when the visitor reaches them. This keeps the initial load focused and the experience responsive on smaller screens.
- Particle animations and interactive canvas elements are scoped to the header, keeping the rest of the page lightweight as the visitor scrolls deeper.
- The filterable company directory and benchmark charts use section-level reveal timing, so they do not compete with each other for rendering resources.
- The dual-path conversion block is designed to remain fully usable on mobile, with the copyable terminal command and GitHub OAuth link both accessible without zooming or horizontal scrolling.
How this template helps you convert
The conversion architecture follows a deliberate three-stage logic: demonstrate value first, build credibility through evidence, then ask for the smallest possible commitment at the end.
- The interactive header demonstrates the product's core behavior before any claim is made. Visitors who engage with the throughput slider have already experienced the product conceptually, making them far warmer by the time they reach the install block.
- The progressive report chapters build institutional credibility for the data platform leads and CTOs who need internal justification. Benchmark charts with methodology footnotes and a filterable company directory give them shareable evidence rather than vague marketing language.
- The CLI install block asks for nothing more than a terminal window. The secondary sandbox path, requiring only a GitHub click, removes every remaining objection for visitors who are not yet ready to install locally.
Other information about this template
This template is built specifically for stream processing platforms and developer infrastructure tools. It is a strong fit for teams building on event-driven architectures, real-time pipelines, or distributed data systems.
- The template's Directory and Discovery theme makes it well-suited for platforms that want to position themselves within an ecosystem of known companies and use cases rather than selling in isolation.
- The Industry Report creative direction aligns naturally with how engineering teams consume information, making it useful for platforms competing in spaces where Kafka Streams, Apache Flink, and Spark Structured Streaming are already familiar reference points to the target audience.
- The App Download landing page direction means the entire page is engineered around a single measurable action: getting a qualified engineer to run one terminal command or open a sandbox session.
Theme
Directory & Discovery
Creative direction
Industry Report
Color system
Acid Digital
Style
Scroll Reveal (Progressive)
Direction
App Download
Page Sections
Interactive Dataflow Header Canvas
Throughput Slider with Live Feedback
Scroll-reveal Chapter Structure
Benchmark Comparison Section
Filterable Company Directory
Dual-path CLI and Sandbox Call to Action
Related questions
Can I customize the source node labels in the interactive header?
Does the throughput slider require a live backend connection?
Can I replace the benchmark data with my own figures?
Is the filterable company directory connected to a live data source?
What do I need to launch this landing page?



