Tillage - Powerful Agriculture Landing Page Template
Tillage is a scroll-reveal agriculture help desk and ticketing landing page template built for operations at scale. It opens with a live interactive ticket dashboard, flows into a personalized ROI calculator, and closes with a low-friction freemium signup. The Data Command visual theme, phosphor green indicators, and amber calls to action create an urgent, mission-control feel designed to convert ag operations professionals.
by Rocket studio
Quick summary
Tillage is a single-page, scroll-reveal landing page template for an agriculture help desk and ticketing platform. It greets visitors with a fully interactive mock dashboard, lets them calculate their own cost savings, and converts them with a three-field freemium signup. The cockpit-inspired design makes every section feel urgent, legible, and built for people who manage farms at scale.
Who this template is for
This template is built for agriculture software companies and platform founders targeting operations professionals who manage field requests at scale. The design and copy speak directly to people who live inside queues, not dashboards built for office work.
- Ag operations managers coordinating dozens of field scout reports daily
- Cooperative IT directors supporting hundreds of member farms with small teams
- Agribusiness technology leaders who have lost critical tickets inside email threads during peak growing season
What problem this template solves
Field operations generate a constant stream of urgent requests: broken irrigation, pest sightings, equipment calibration failures. Without a centralized system, those requests scatter across texts, emails, and spreadsheets until crop damage is already happening.
- Ticket triage and tracking gets lost when requests arrive through too many channels at once
- Response delays compound into yield losses that are hard to quantify without visible data
- Teams cannot prioritize escalations when there is no single view of what is overdue
What you get with this template
You get a fully designed, scroll-reveal landing page that demonstrates the product before asking for anything. Every section is built to reduce friction and raise confidence, from the first interactive element to the final signup form.
- A live interactive ticket dashboard in the header that visitors can click and drag in real time
- A built-in ROI calculator that outputs a personalized projection based on visitor-entered farm data
- A freemium conversion flow with a sticky bottom bar call to action and a secondary email-capture path for undecided visitors
Feature list
This template ships with purpose-built components that reflect real agriculture software buying behavior. Each one is designed to earn trust before asking for a commitment.
Interactive Ticket Dashboard Header
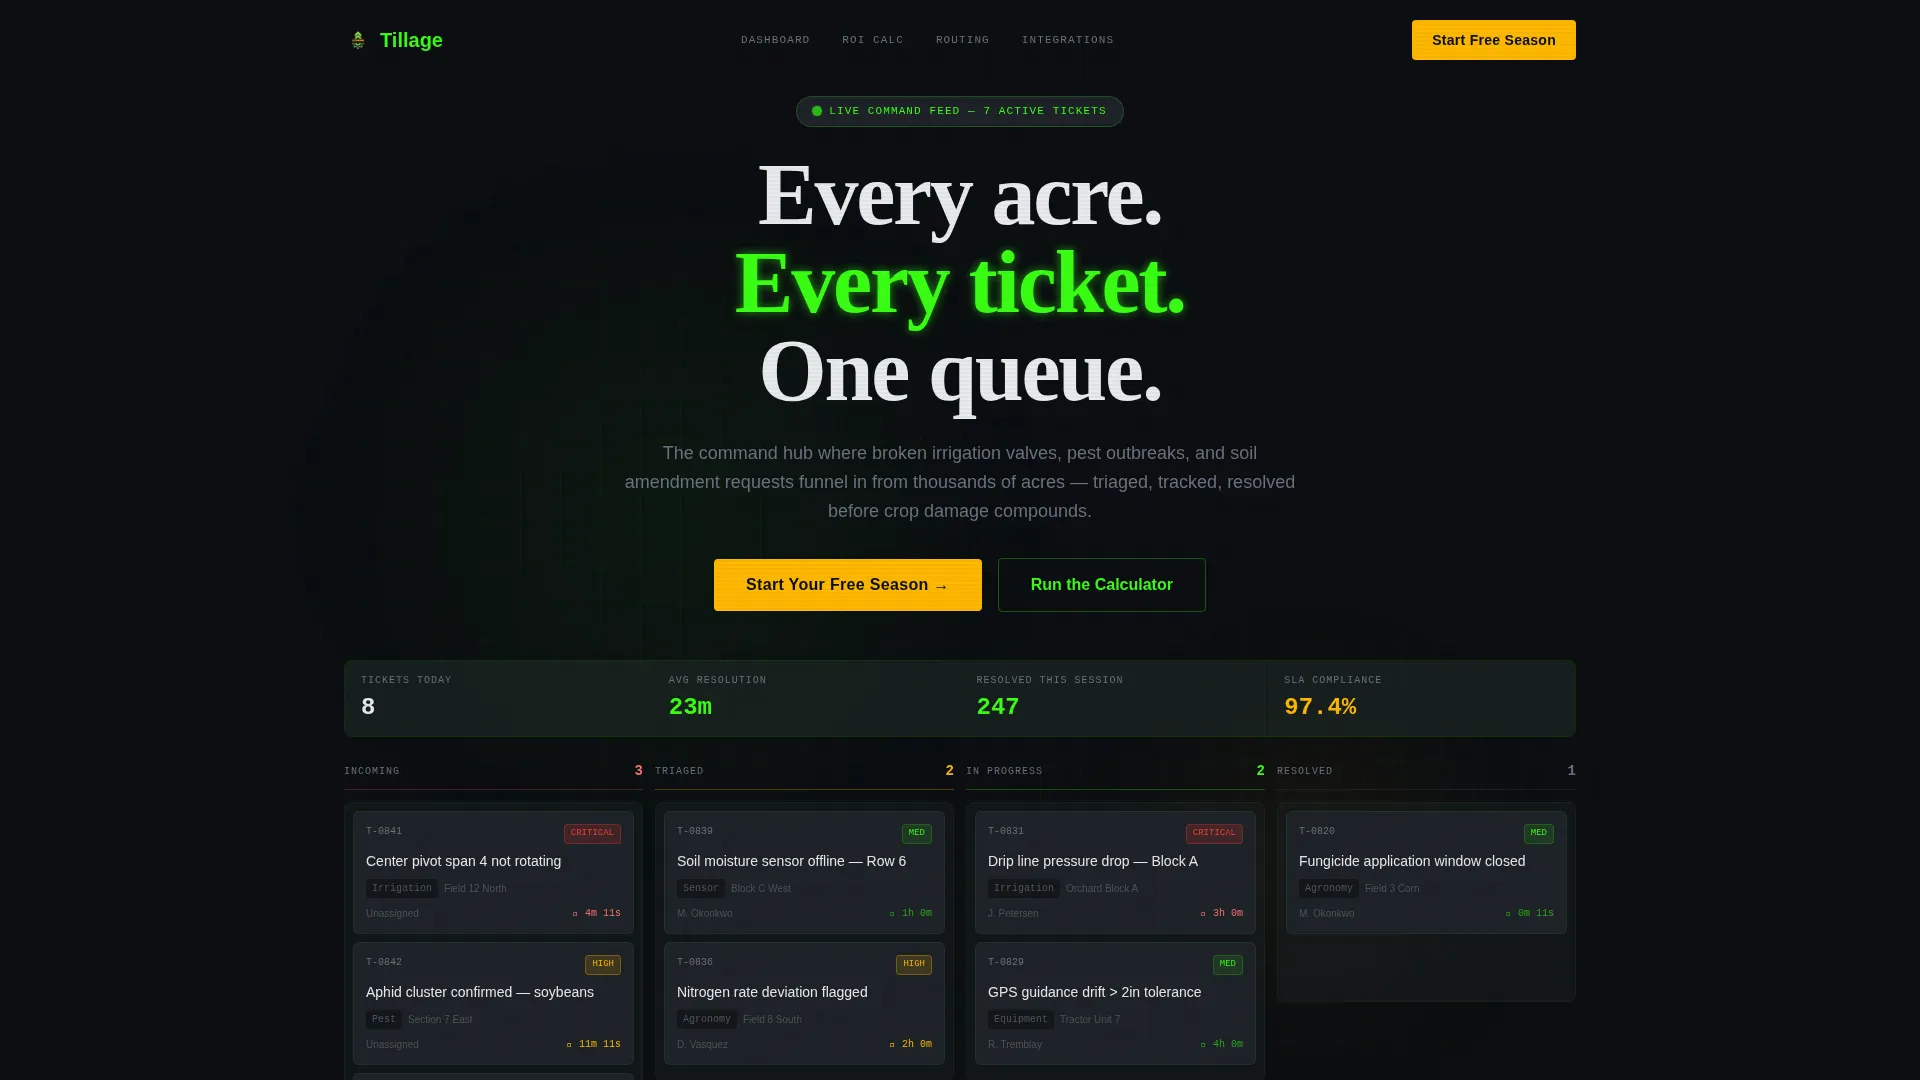
The header renders a fully functional mock ticket queue directly in the browser. Visitors can click to triage a ticket, drag items between status columns, and watch resolution timers run in real time. Pre-loaded scenarios include realistic agriculture situations like irrigation span failures and pest outbreak confirmations.
Scroll Reveal Progressive Layout
Each section fades and rises into view as the visitor scrolls. Capability is revealed one layer at a time, moving from hands-on product interaction to financial justification to technical depth. The progressive structure keeps attention focused and builds conviction with every step.
Personalized ROI Calculator
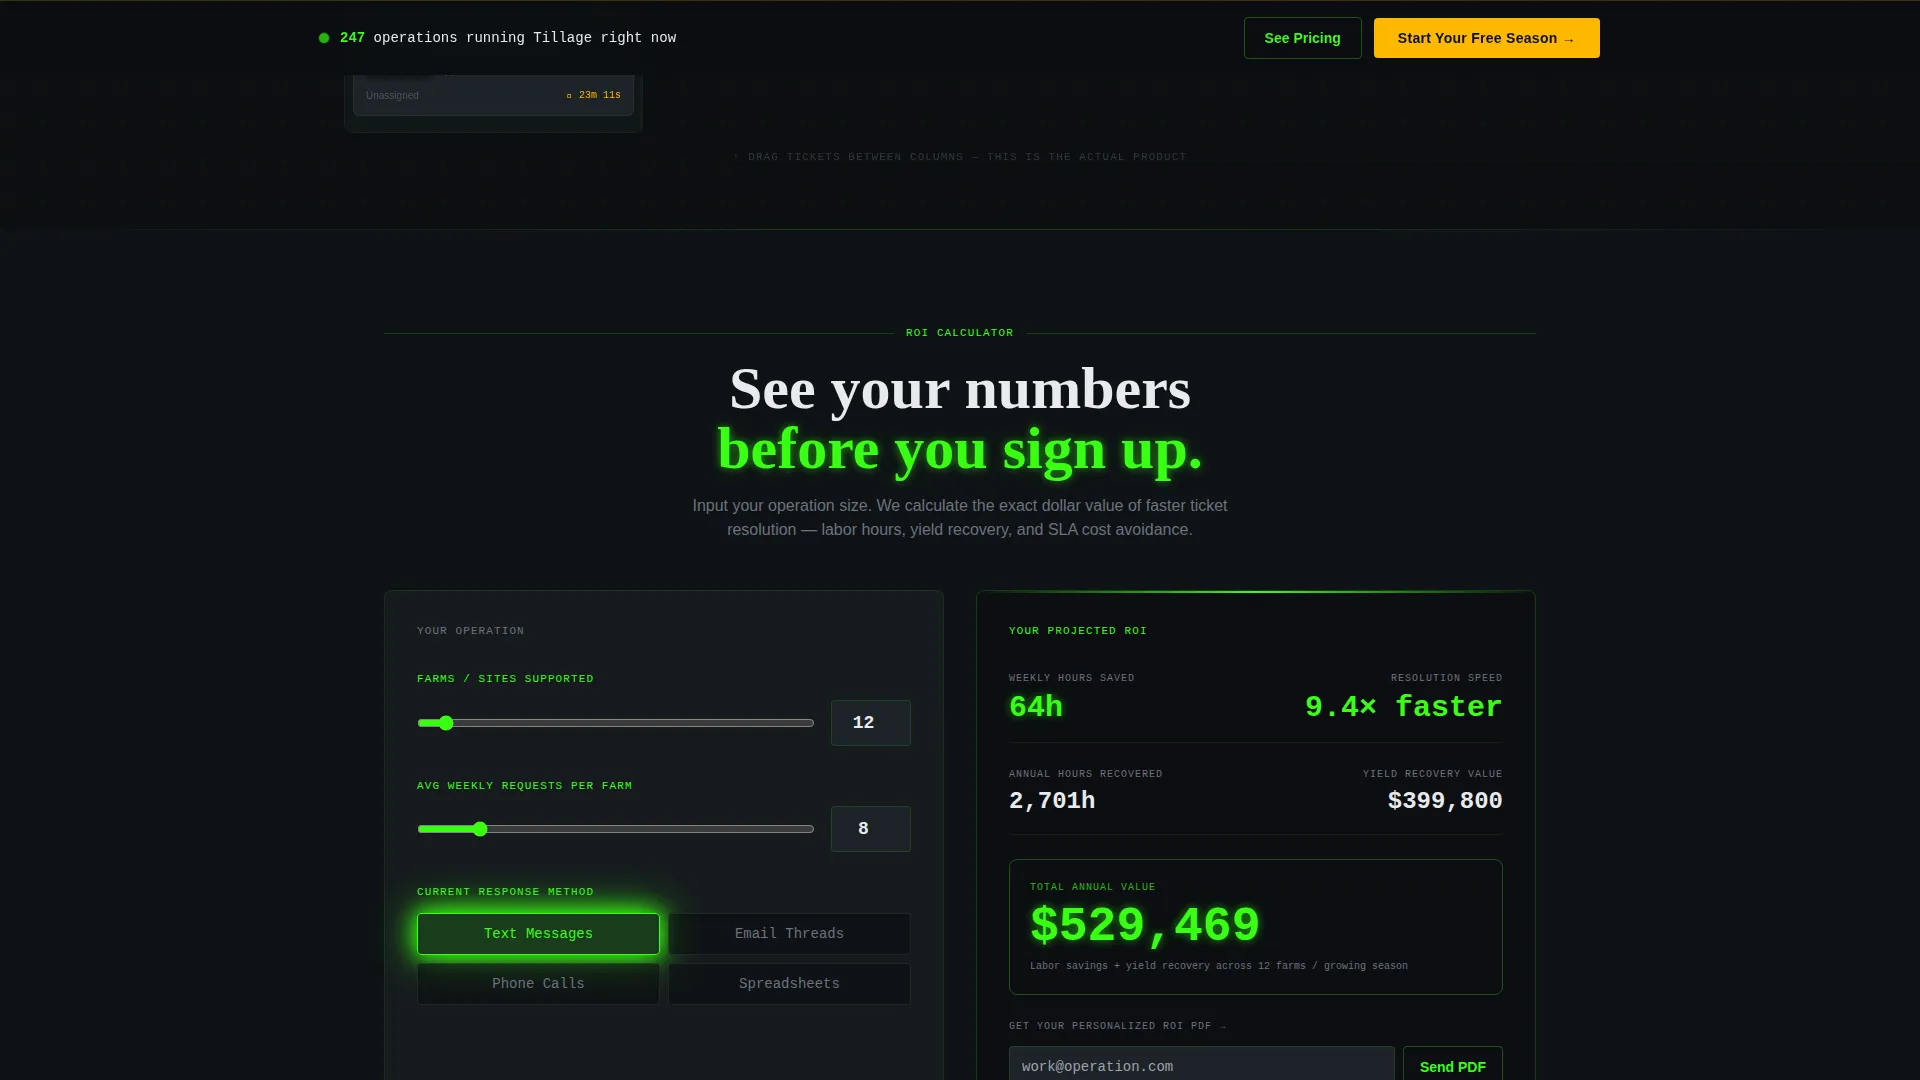
Visitors input their number of farms, average weekly request volume, and current response method. The calculator outputs a projected resolution time saving and a lost-yield cost recovery figure, displayed in phosphor green before the next section loads. A secondary path offers the result as a downloadable PDF in exchange for an email address.
Automated Routing Flowchart Visualization
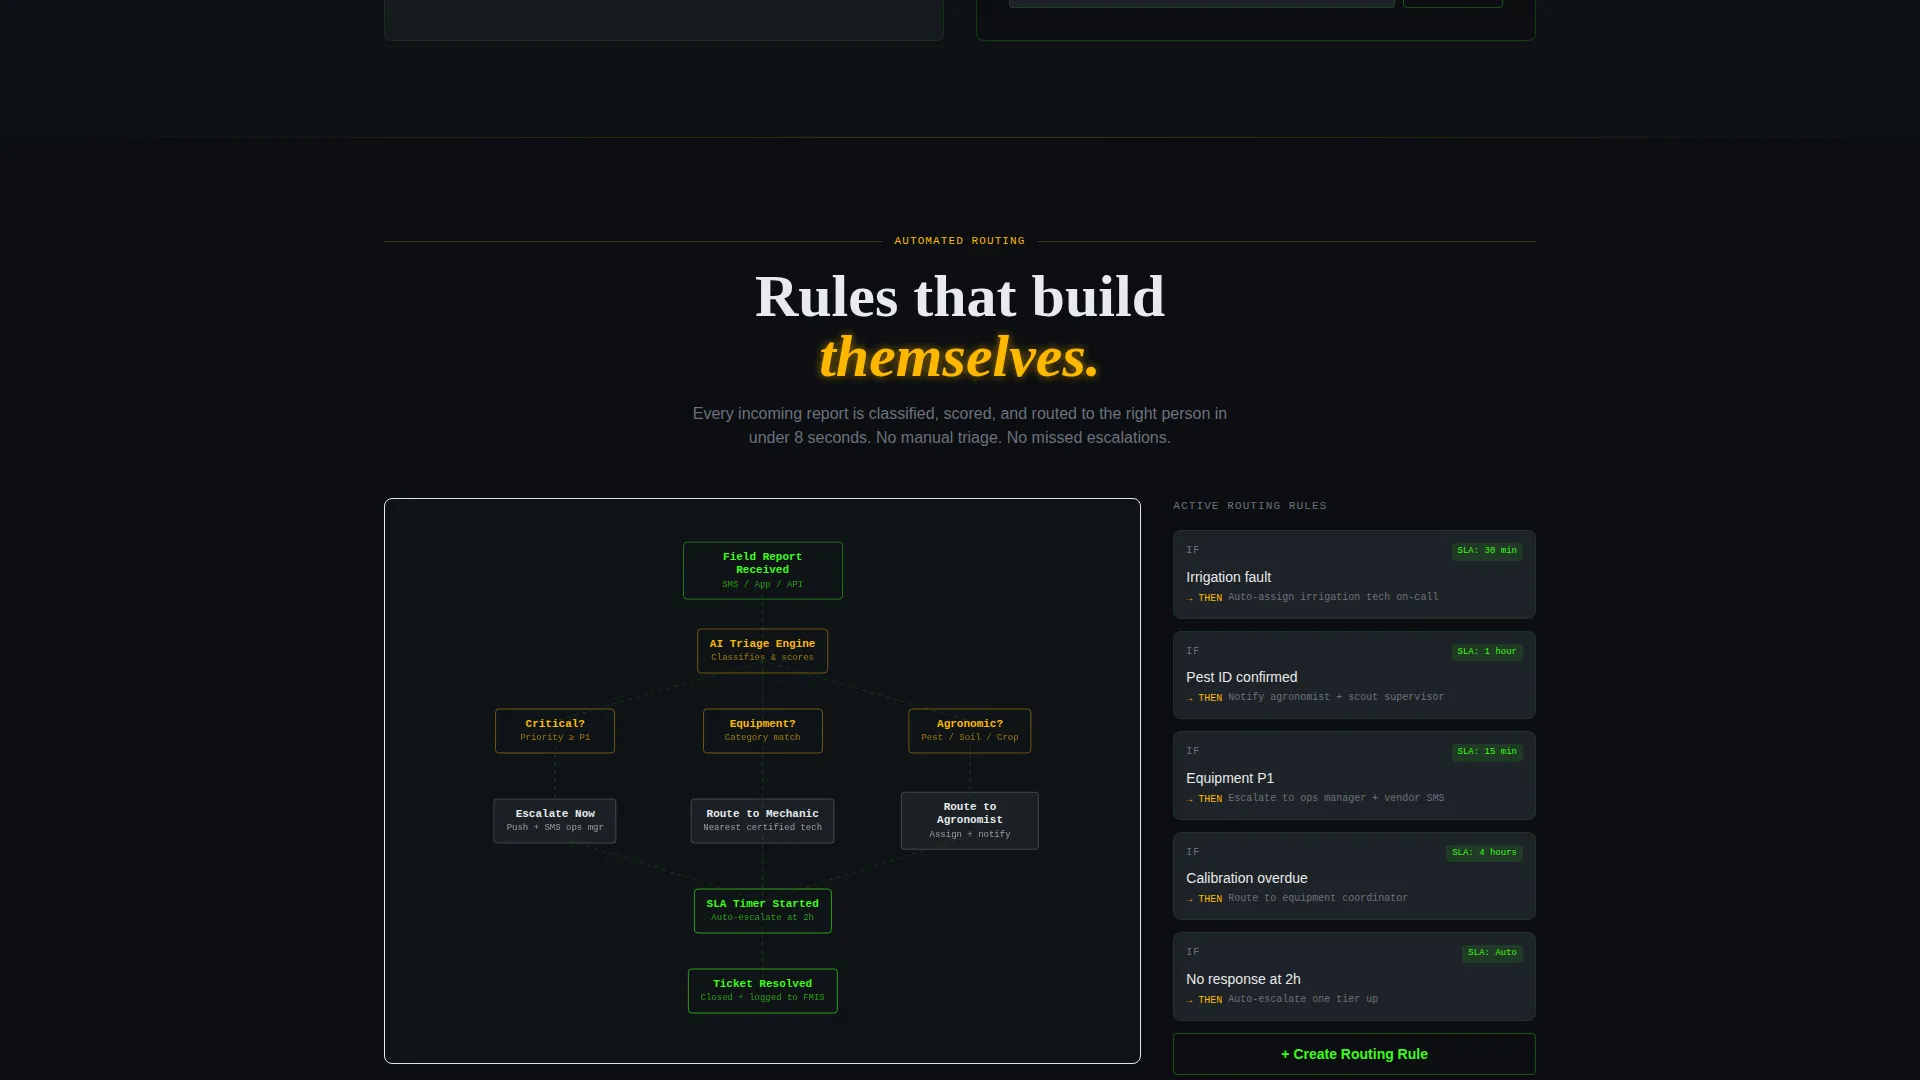
Routing rules are displayed as animated flowcharts that build themselves on screen as the visitor reaches that section. This visual makes abstract automation logic tangible and immediately credible to technical buyers evaluating the platform.
SLA Heatmap on Field Grid
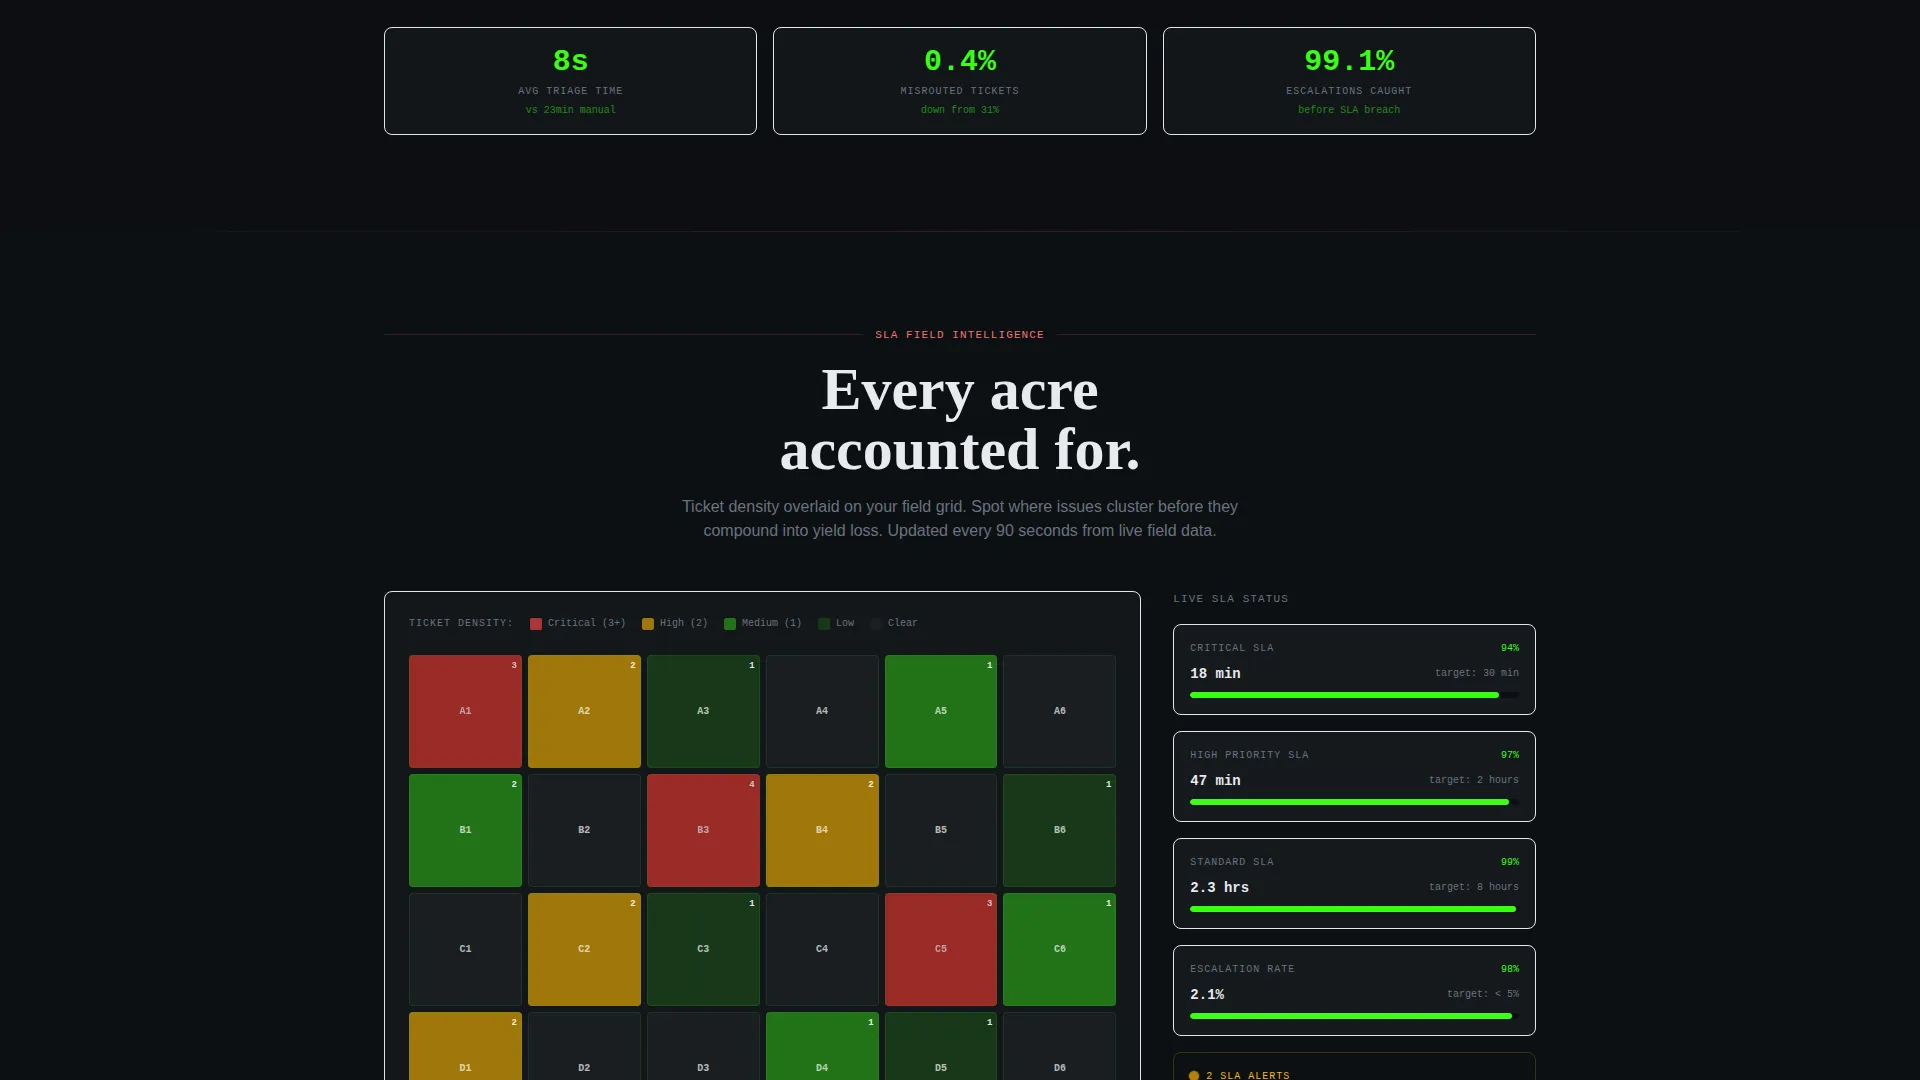
Service level agreement (SLA) performance is visualized as a heatmap overlaid on a satellite-style field grid. The visual connects platform data to physical acres, making the stakes concrete for operations managers responsible for large land areas.
Low-Friction Freemium Signup Form
The primary conversion form asks only for operation name, number of farms supported, and work email. No credit card is required. The form appears first inside the interactive header section and again as a sticky bottom bar that activates after the ROI calculator fires.
Page sections overview
| Section | Purpose |
|---|---|
| Interactive Dashboard Header | Let visitors triage live mock tickets and see the product immediately |
| Ticket Queue Display | Show the centralized request queue with status columns and timers |
| ROI Calculator Tool | Help visitors project time savings and yield cost recovery from their own data |
| Routing Flowchart Reveal | Visualize automated ticket routing rules as self-building flowcharts |
| SLA Field Heatmap | Connect platform performance data to physical field geography |
| Integration Panels | Show platform connections relevant to common agriculture software ecosystems |
| Primary call to action and Signup | Capture operation name, farm count, and work email with no card required |
| Sticky call to action Bar | Persist the free trial offer after the calculator section without interrupting scroll |
Design & branding system
The visual identity uses an Acid Digital color system built around a Data Command theme. The palette is engineered for legibility under pressure, modeled on a heads-up display viewed in low light.
- Core colors: void black (#0B0E11) for backgrounds, terminal phosphor green (#39FF14) for status indicators and active borders, electric soil amber (#FFB800) for escalation badges and primary calls to action, and scanner-line gray (#1E2328) for card and panel surfaces
- Text renders in cool white (#E8EAED) against void black backgrounds for maximum contrast
- Phosphor green dominates live counters and real-time state indicators; amber fires on overdue flags and every primary call-to-action button
Mobile & speed optimization
The scroll-reveal layout is structured to work cleanly at any viewport size. Interactive components and data panels reflow for smaller screens without losing the cockpit aesthetic.
- Sticky call to action bar and ROI calculator output remain accessible on mobile viewports throughout the scroll journey
- Card surfaces and status indicator colors maintain their visual hierarchy on both small and large screens
How this template helps you convert
This template is structured around a trust-first conversion funnel. Visitors earn the right to understand the product before they see any signup request.
- The interactive dashboard header lets visitors touch a real ticket queue in the first three seconds, building immediate product confidence without a demo call
- The ROI calculator personalizes the value proposition with the visitor's own numbers, making the cost of inaction visible before the primary call to action appears
- The three-field freemium form and secondary PDF download path give both ready-to-convert and research-phase visitors a reason to leave their email
Other information about this template
This template is part of the Tillage product identity and is designed specifically for the agriculture software niche where field operations complexity is high and buying decisions often require financial justification before trial signup.
- The integration panels reference connections to agriculture platform ecosystems including John Deere Operations Center, Climate FieldView, and common farm management information system (FMIS) platforms
- The template style is Scroll Reveal (Progressive), meaning each section animates into view only when the visitor reaches it
- The primary call to action label is "Start Your Free Season" and is styled in electric amber throughout the page
- The secondary conversion path captures email in exchange for a downloadable PDF report of the visitor's personalized ROI projection
Theme
Data Command
Creative direction
Calculator/Tool First
Color system
Acid Digital
Style
Scroll Reveal (Progressive)
Direction
Freemium/Trial
Page Sections
Interactive Ticket Dashboard Header
Scroll Reveal Progressive Layout
Personalized ROI Calculator
Automated Routing Flowchart Visualization
SLA Field Heatmap Panel
Low-friction Freemium Signup Form
Related questions
Does this template require coding skills to use?
What does the ROI calculator actually output?
Is there a way to capture leads from visitors who are not ready to sign up?
How many form fields does the freemium signup require?
Can I change the color scheme to match my own brand?



