Automotive Analytics Dashboard Landing Page Template
Torque is a high-performance automotive analytics landing page template built for data-driven dealership professionals. It pairs a live-stats header, a side-by-side comparison table, and interactive benchmark tools inside a sharp Tech Glass visual system. The result is a single-page experience that leads with numbers, builds trust through proof, and drives clicks toward a live demo.
by Rocket studio
Quick summary
Torque is a single-page automotive analytics dashboard landing page template designed to turn raw fleet and dealership data into instant, visible proof. Every section leads with a metric. The layout moves from live stats to comparison to benchmarks to integrations, ending with a full-width call-to-action band. It is built for analytical buyers who need conviction before they click.
Who this template is for
This template is built for automotive software teams who sell to serious data buyers inside the industry. It speaks directly to decision-makers who evaluate tools by numbers, not narratives.
- Dealer group General Managers comparing inventory turn rates across multiple rooftops
- Original Equipment Manufacturer regional managers tracking incentive return on investment by ZIP code
- Fleet procurement directors benchmarking total cost of ownership against residual value curves
What problem this template solves
Most automotive software landing pages lead with feature lists and screenshots. That approach stalls analytical buyers who need proof of impact before they engage. Torque flips the sequence.
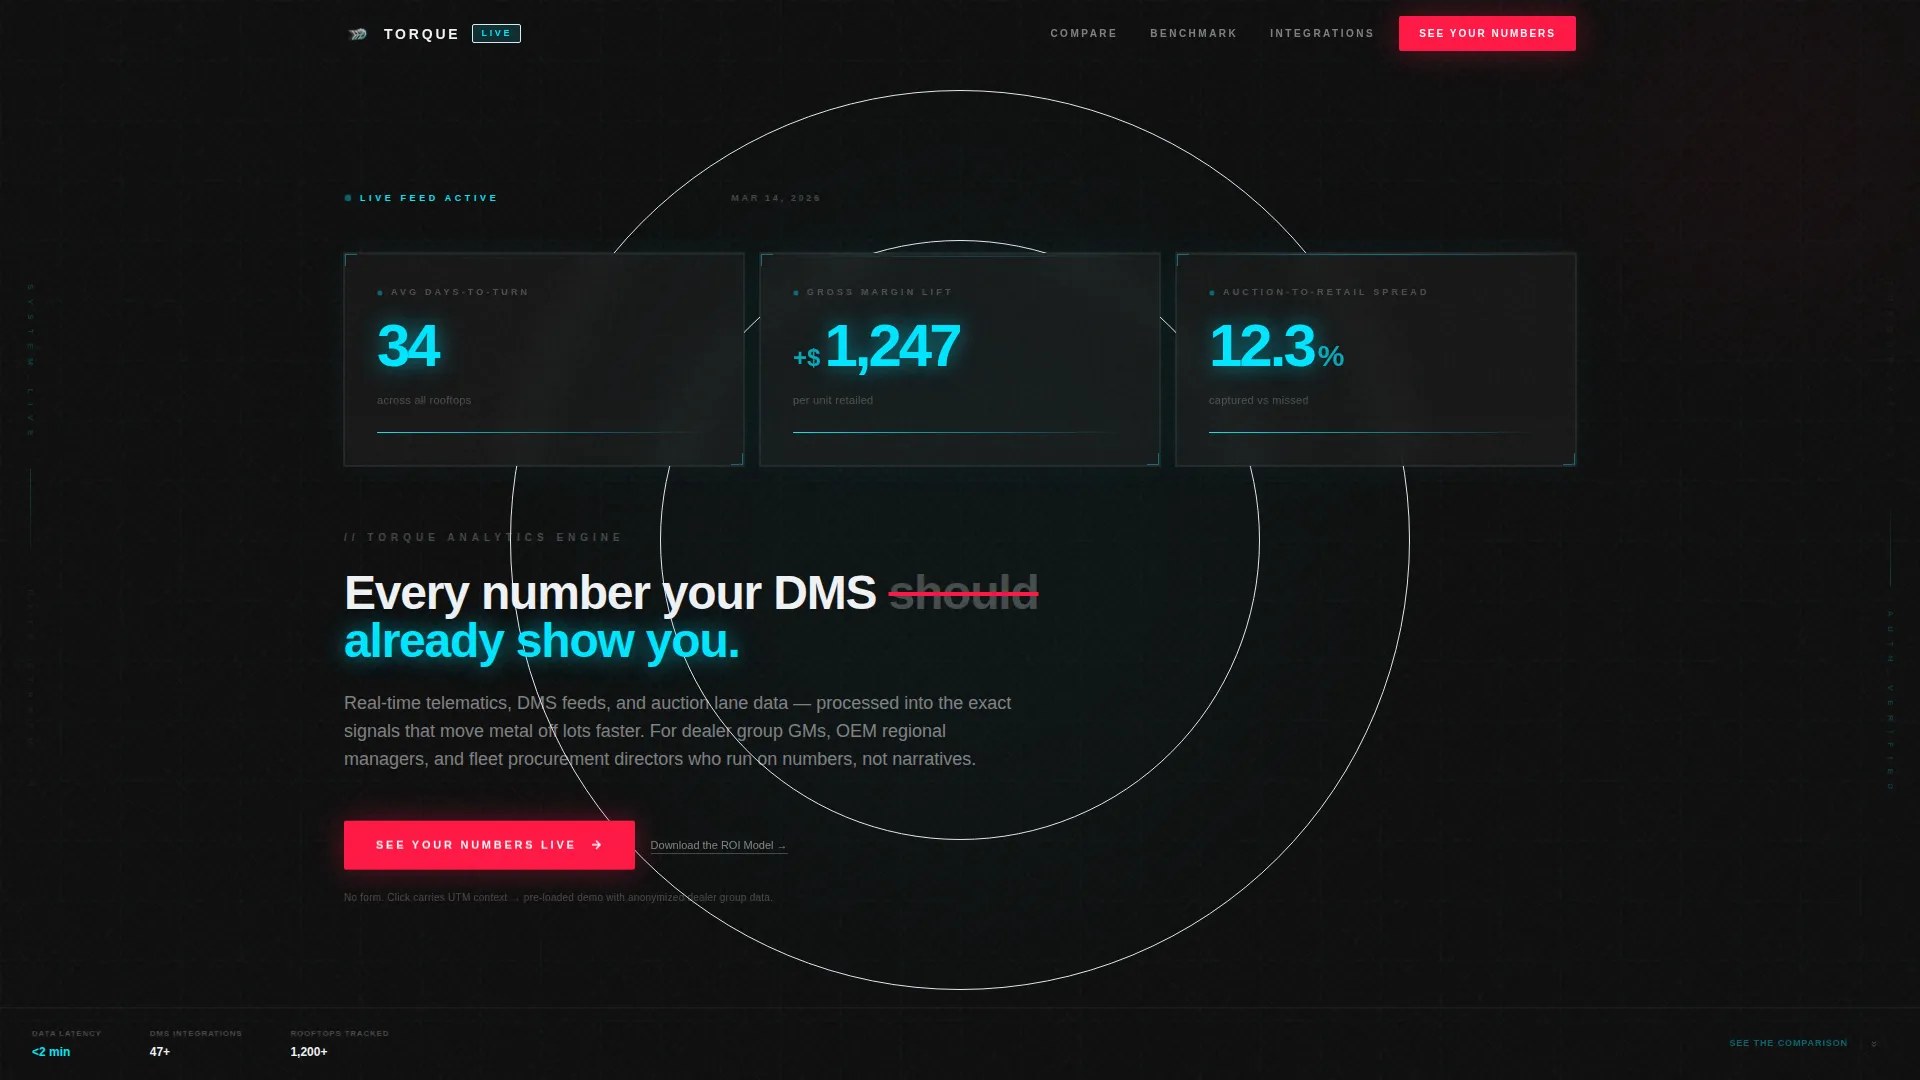
- Live stats in the header create instant conviction without requiring the visitor to scroll
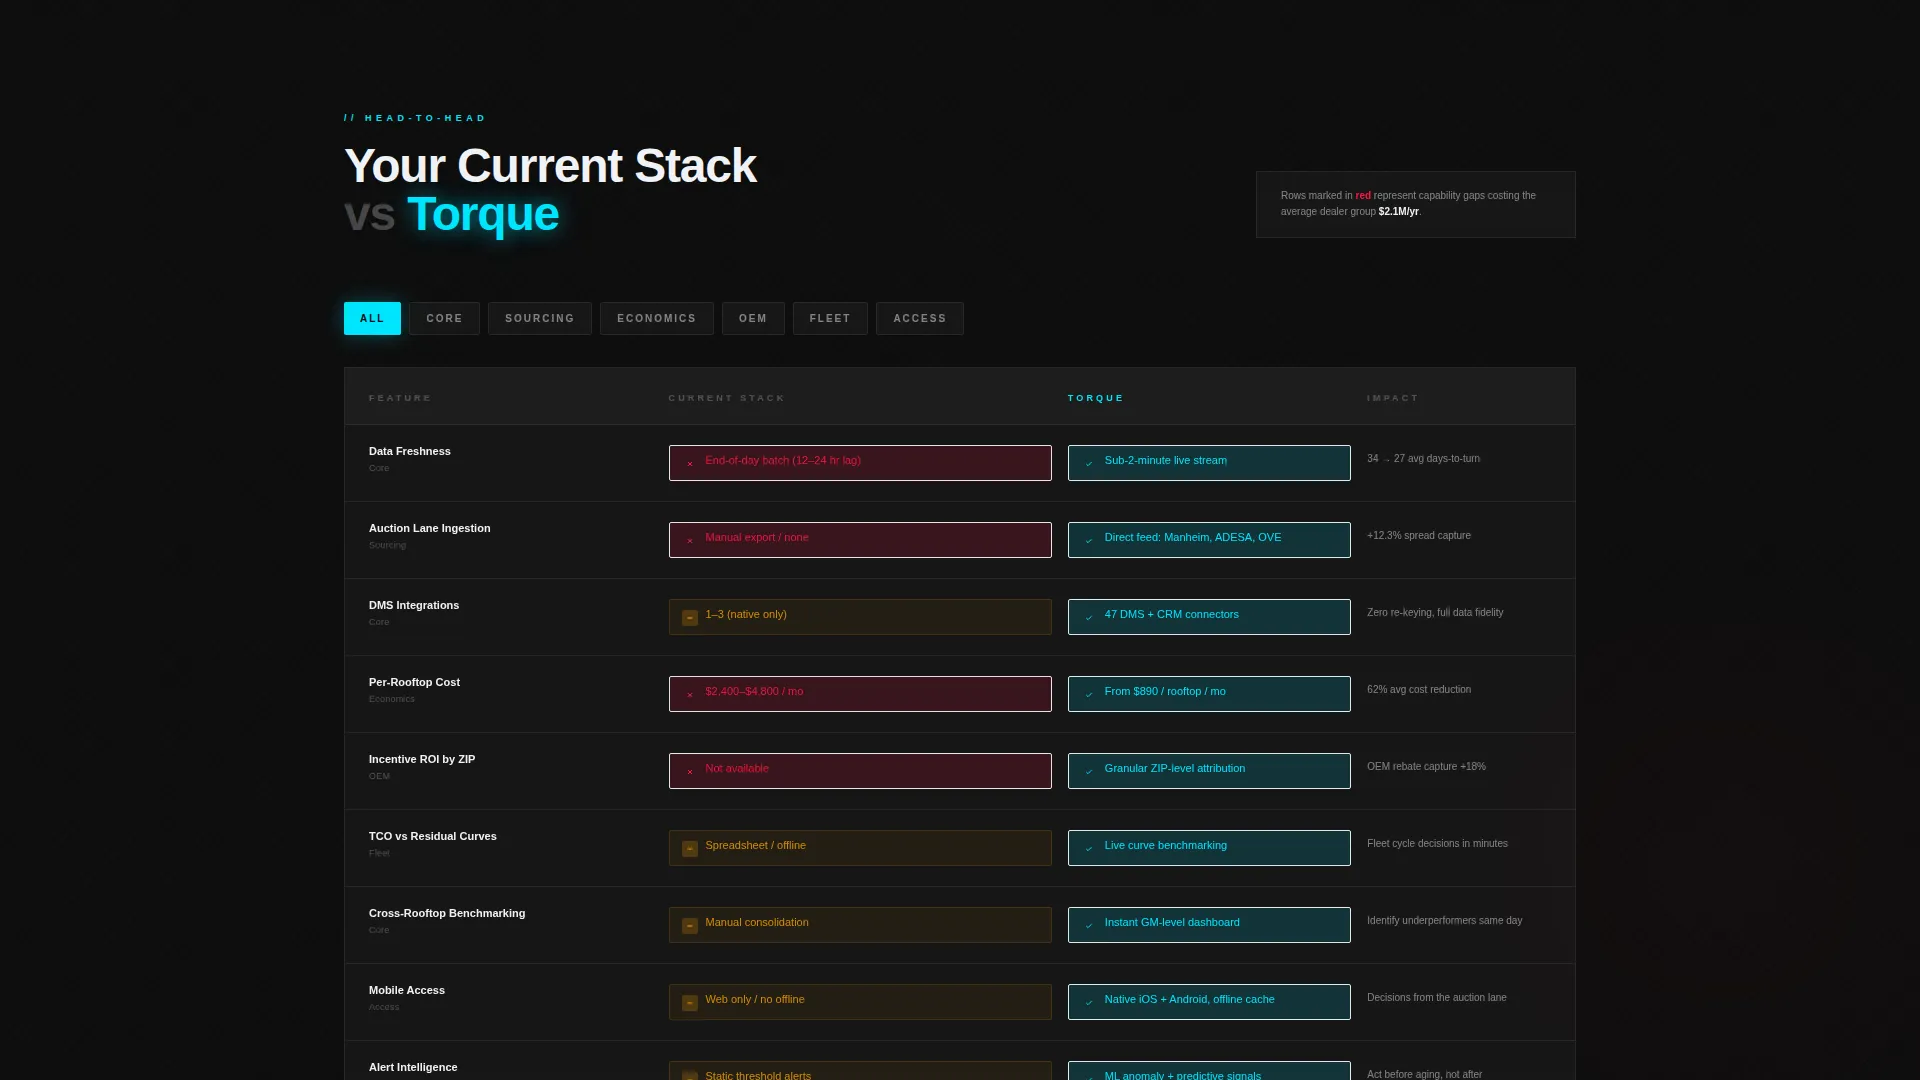
- The comparison table exposes gaps in the visitor's current stack before they ask the question themselves
- The demo click carries context so the visitor lands in a pre-loaded experience, not a blank form
What you get with this template
You get a complete, conversion-focused landing page layout built around the Stats-First Impact creative direction. Every component is designed to reward the analytical mind that lands on the page.
- A live-stats header wall displaying key metrics in instrument-cluster cyan on carbon black
- A row-by-row comparison table with cyan checkmarks and redline gap indicators
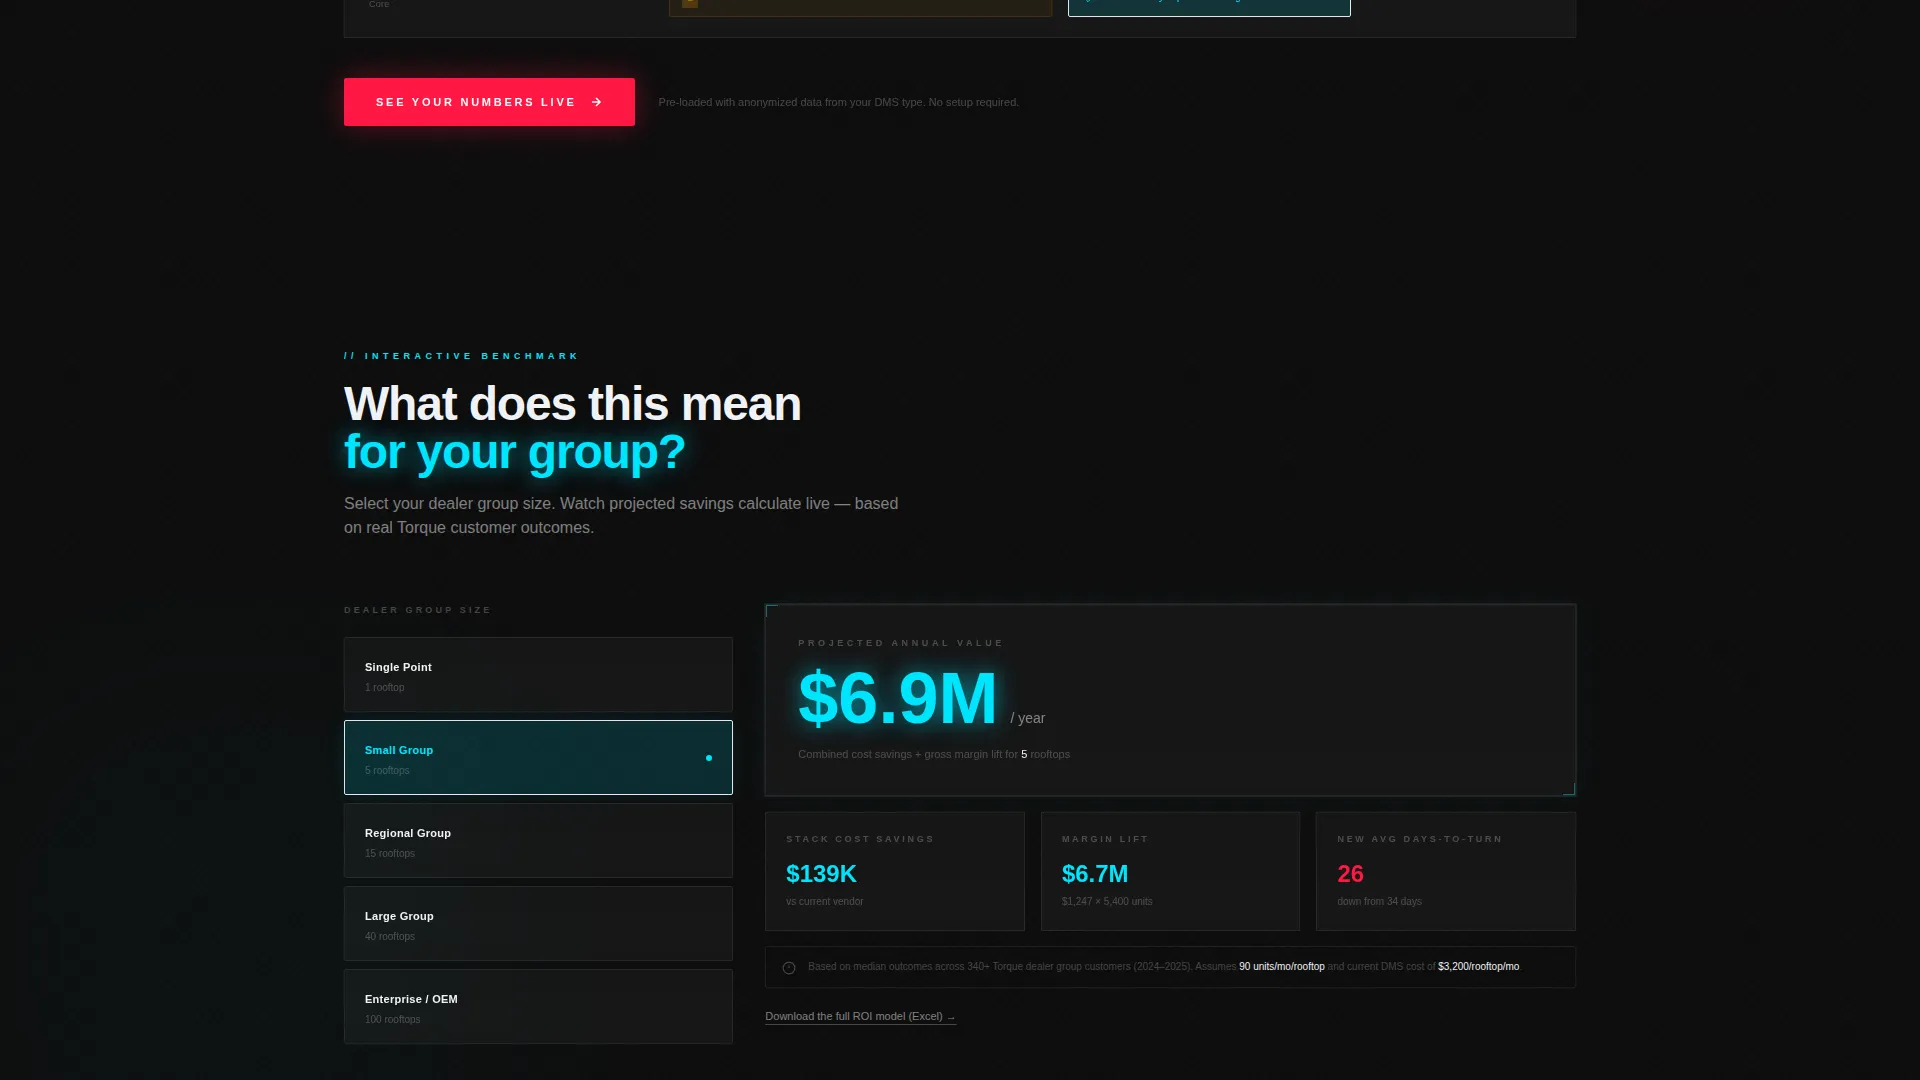
- An interactive benchmark module where visitors select dealer group size and watch projected savings calculate
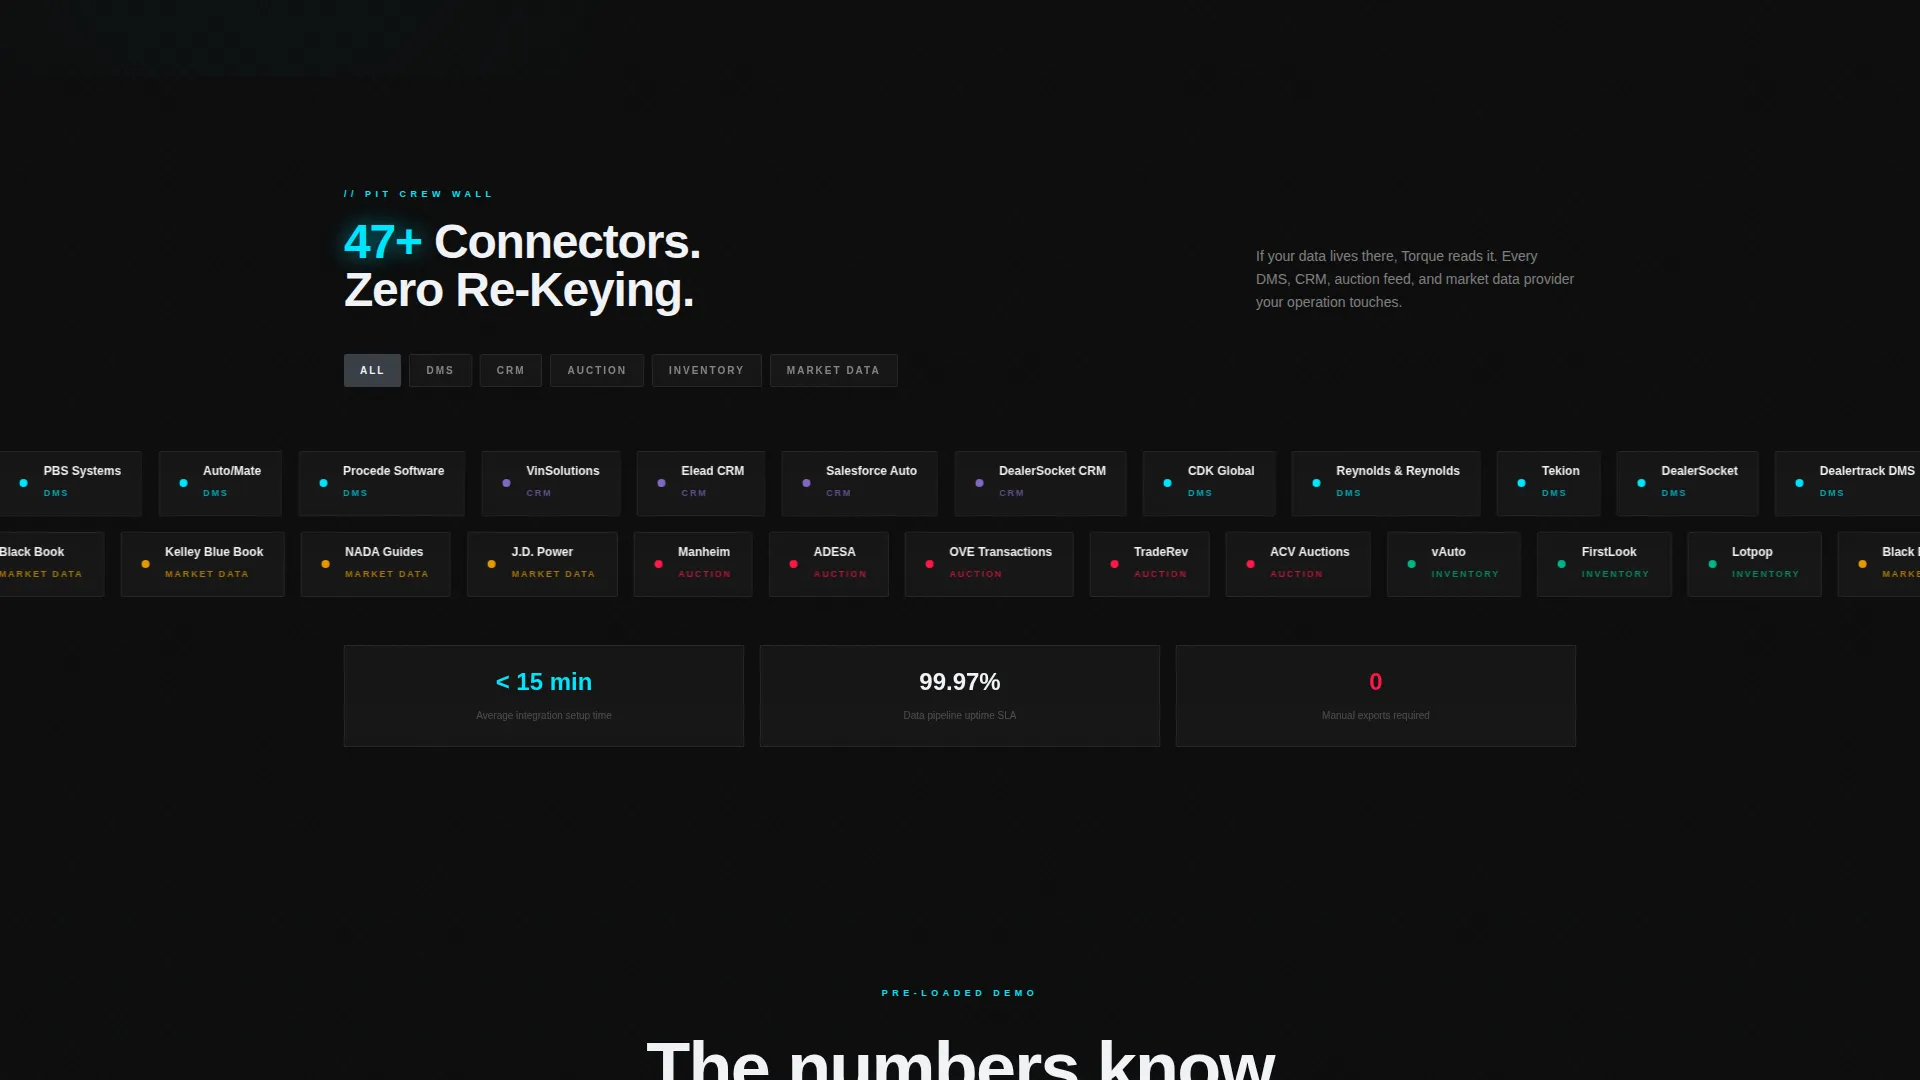
- A DMS and CRM integration logo grid styled like a pit crew roster wall
- A floating glass-panel primary call-to-action button and a secondary text link for the downloadable return-on-investment model
- A full-width closing call-to-action band as the final conversion anchor
Feature list
This landing page template is structured around six core capabilities, each tied directly to the buying journey of an automotive analytics prospect.
Live Metrics Header Wall
The header skips hero imagery entirely. It opens with three precise figures: average days-to-turn at 34, gross margin lift at $1,247 per unit, and auction-to-retail spread at 12.3%. Each number animates from zero like a tachometer sweeping to redline, then the headline fades in beneath them.
Side-by-Side Comparison Table
Section two presents a structured comparison between the visitor's current stack and the Torque platform. Rows cover data freshness, integration count, per-rooftop cost, and mobile access. Checkmarks render in instrument-cluster cyan; gaps are highlighted in redline red to make deficiencies impossible to ignore.
Interactive Benchmark Calculator
Visitors select their dealer group size in section three and watch projected savings calculate in real time. This module turns a passive scroll into an active evaluation moment, personalizing the value case before a single form field appears.
DMS and CRM Integration Grid
Section four displays logo rows of compatible dealership management system and customer relationship management platform integrations. The layout is styled like a pit crew wall, signaling depth of connectivity at a glance.
Click-Through call to action Architecture
The primary call-to-action, "See Your Numbers Live," appears three times: as a floating glass-panel button after the header stats resolve, anchored below the comparison table, and dominating the closing band. Each click carries UTM context and drops the visitor into a pre-loaded interactive demo seeded with anonymized dealer group data.
Secondary ROI Model Download
A text link labeled "Download the ROI Model" runs alongside the primary call-to-action. It is designed to capture high-intent analysts who want the return-on-investment spreadsheet before committing to the live demo experience.
Page sections overview
| Section | Purpose |
|---|---|
| Live Stats Header | Opens with key performance metrics animating to redline |
| Comparison Table | Contrasts current stack against Torque row by row |
| Interactive Benchmarks | Personalizes projected savings by dealer group size |
| Integration Logo Grid | Displays DMS and CRM partner logos as a trust signal |
| Closing call to action Band | Full-width final conversion anchor with primary button |
Design & branding system
The visual identity follows a Tech Glass theme built on a Carbon Fiber color system. Every design decision reinforces precision, depth, and the feeling of a lit instrument cluster in a dark cockpit.
- Core palette: deep carbon black (#0D0D0D), brushed aluminum mid-tone (#3A3F47), translucent glass panel (#E8EAF0 at 20 opacity over blur), instrument-cluster cyan (#00E5FF), and redline accent (#FF1744) reserved strictly for alerts and calls-to-action
- Glass-panel overlays give the stats wall a heads-up display quality, as if numbers float projected onto a windshield at night
- The redline accent appears only on gap indicators and primary call-to-action elements, keeping its urgency signal intact
Mobile & speed optimization
The template is structured for clean rendering across screen sizes, ensuring that analytical buyers reviewing on a phone or tablet still see the comparison data and live stats in full context.
- The stats header and comparison table reflow for smaller viewports without losing column clarity
- The floating call-to-action button and secondary text link remain accessible at every scroll depth on mobile
- The glass-panel overlay and blur effects are implemented to maintain visual fidelity across modern browsers
How this template helps you convert
Torque is built around a Click-Through landing page direction. Every layout decision moves a skeptical, data-oriented buyer closer to the demo click.
- The header stats create immediate credibility by proving the platform already knows the numbers that matter to the visitor's role, removing the need to explain value before demonstrating it.
- The comparison table manufactures urgency by making the visitor's current stack visibly incomplete, and the anchored call-to-action button appears exactly when that realization lands.
- The UTM-linked demo click drops the visitor into a pre-loaded experience with anonymized dealer group data, so the transition from page to product feels seamless rather than interruptive.
Other information about this template
This template is purpose-built for automotive analytics software products competing in the dealership technology market. It is equally suited to fleet telematics platforms, auction intelligence tools, and inventory optimization products targeting the same professional buyer segment.
- The Stats-First Impact creative direction makes this template a strong fit for any automotive software product where proof of performance matters more than feature explanation
- The template style is a Comparison Table layout, making it well-suited for competitive displacement campaigns targeting buyers who are already using an incumbent tool
- The Tech Glass theme and Carbon Fiber color system are designed to align with the visual expectations of modern automotive technology buyers accustomed to premium dashboard interfaces
- The no-form conversion model, where the click carries context directly into a demo, reduces friction for buyers who resist lead-capture gates before seeing value
Theme
Tech Glass
Creative direction
Stats-First Impact
Color system
Carbon Fiber
Style
Comparison Table
Direction
Click-Through
Page Sections
Live Metrics Header Wall
Side-by-side Comparison Table
Interactive Benchmark Calculator
DMS and CRM Integration Grid
Three-point Call to Action Architecture
Secondary ROI Model Download
Related questions
Does this template include a lead capture form?
Can the comparison table rows be customized for different feature sets?
Who is the typical buyer this landing page is designed to attract?
Is the interactive benchmark calculator editable?
Can I use this template for a product other than an automotive analytics dashboard?



