Advanced Tech & AI Platforms Comparison Website Template
Track is a terminal-first ML experiment tracking landing page template built for machine learning engineers, research leads, and MLOps teams. It showcases an interactive comparison grid, a live dashboard preview hero, and a frictionless CLI install flow. The template makes it effortless to demonstrate how teams track experiments, compare metrics, and reproduce results with Git-style precision.
by Rocket studio
Quick summary
Track is a single-page landing page template designed for ML experiment tracking platforms. It combines a glass-panel dashboard hero, an interactive framework comparison table, and a one-click CLI install call to action. The template gives machine learning teams a fast, credible way to present their experiment tracking tool to engineers who need proof before they commit to a package manager command.
Who this template is for
This template is built for teams and founders who need to present an experiment tracking platform to a technical audience. It speaks directly to the people who live in terminals and dashboards, not marketing decks.
- ML engineers who want fast CLI access, zero-friction setup, and reproducibility across every training run.
- Research leads who need to reproduce a specific model result from months ago, often under a paper deadline.
- MLOps teams wiring model management and model checkpointing into production pipelines that demand audit-ready experiment runs.
What problem this template solves
Tracking machine learning experiments is genuinely hard to communicate. Most platforms lose engineers at the first sign of a gated demo or a vague feature list. This template solves the credibility gap by letting engineers verify every claim before they install anything.
- Spreadsheet chaos: ML teams juggle tabs of learning rate values, batch size logs, and output metrics with no structured version control. This template shows a better process at a glance.
- Reproducibility failures: Without proper experiment tracking, reproducing a result from a past training run becomes guesswork. The template demonstrates how each run captures full data context, including dataset versions and environment configs.
- Slow adoption: Engineers do not install tools they cannot evaluate quickly. The comparison table and row deep-dives earn trust before any input is required.
What you get with this template
This template delivers a fully structured, section-led landing page flow purpose-built for ML experiment tracking platforms. Every section is grounded in what terminal-first machine learning users actually need to see.
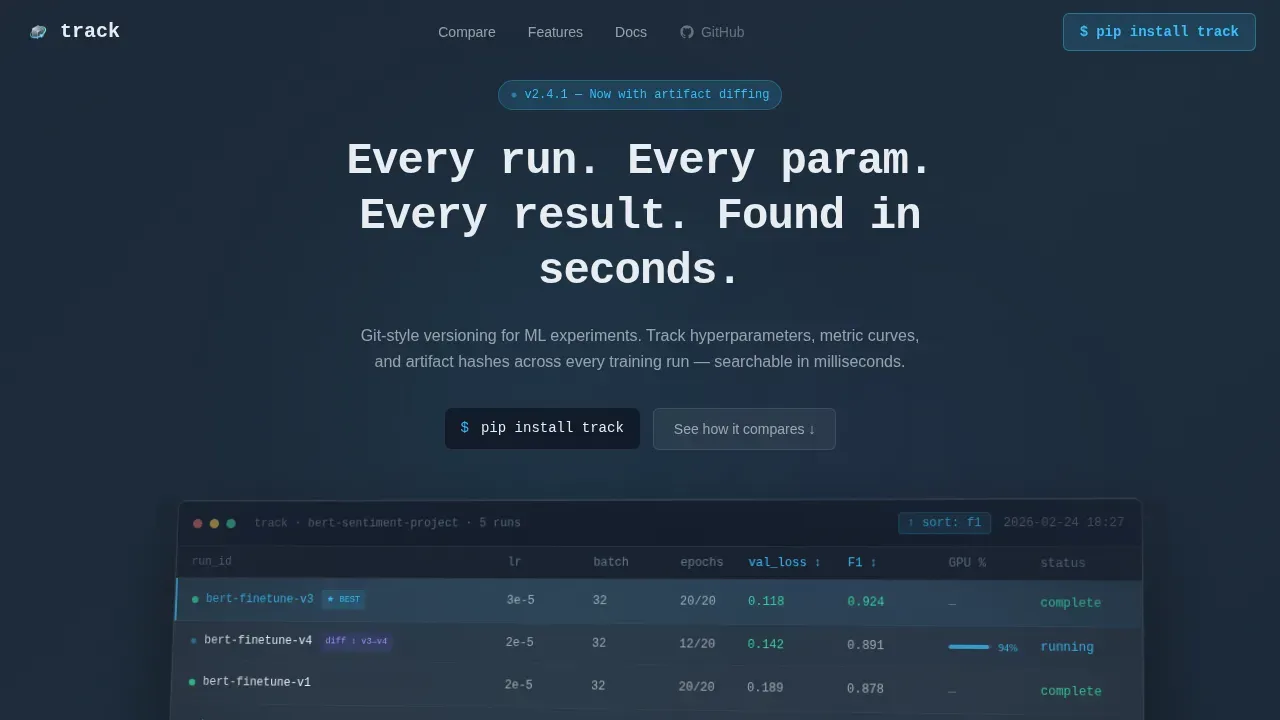
- Hero section with a typewriter monospace headline and a rotated glass dashboard preview showing five concurrent experiment runs with real metric columns including val_loss, F1 score, and GPU utilization.
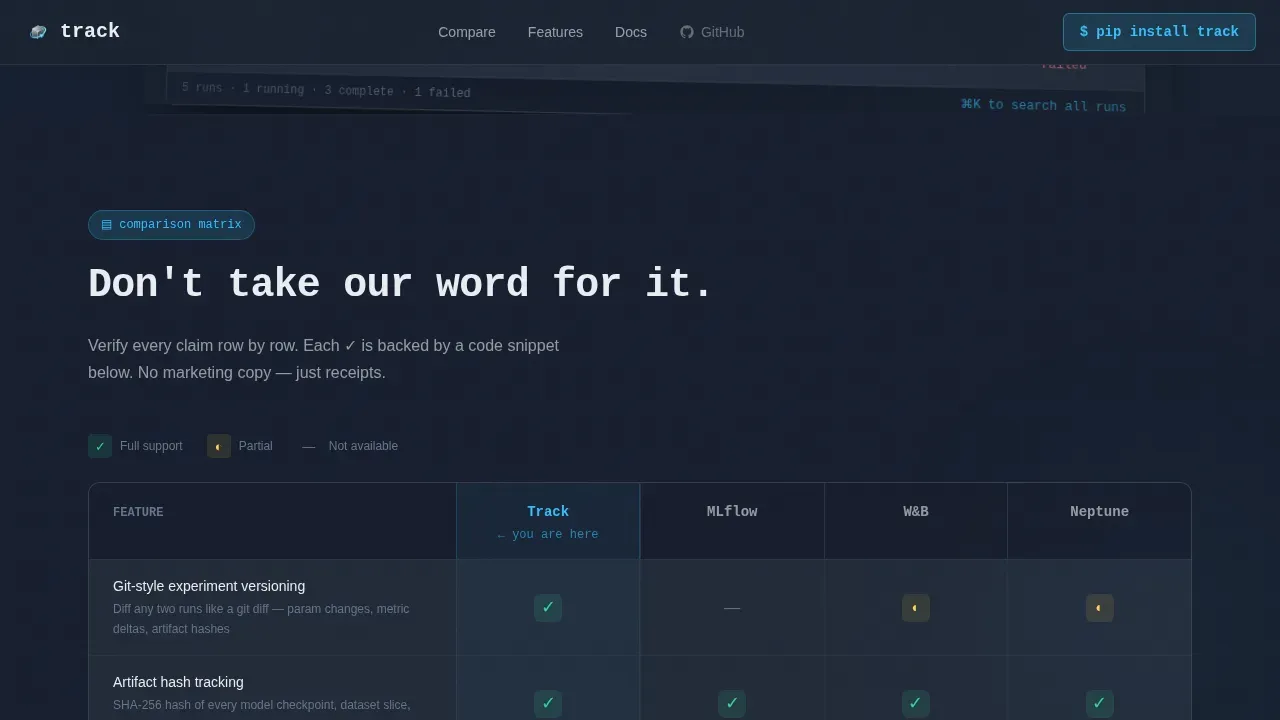
- Interactive comparison table letting visitors compare experiments across frameworks side by side, with sky-blue checkmarks and visible gaps for honest, row-by-row evaluation.
- Install call to action with a one-click copy field showing
pip install trackand platform toggle pills for PyPI, conda, and Docker, plus a secondary path to a hosted dashboard.
Feature list
This template packages every section an ML experiment tracking platform needs to convert technical users, from a living dashboard preview to a proof-first comparison grid.
Living Dashboard Hero with Experiment Table
The hero renders a pixel-perfect dashboard preview mid-session. It shows five concurrent experiment runs with sortable metric columns. One run is highlighted in sky-blue as the current best, and a diff badge displays a parameter change between two runs. A typewriter headline in monospace types itself above the glass panel, creating immediate context for what the platform does.
Interactive Framework Comparison Grid
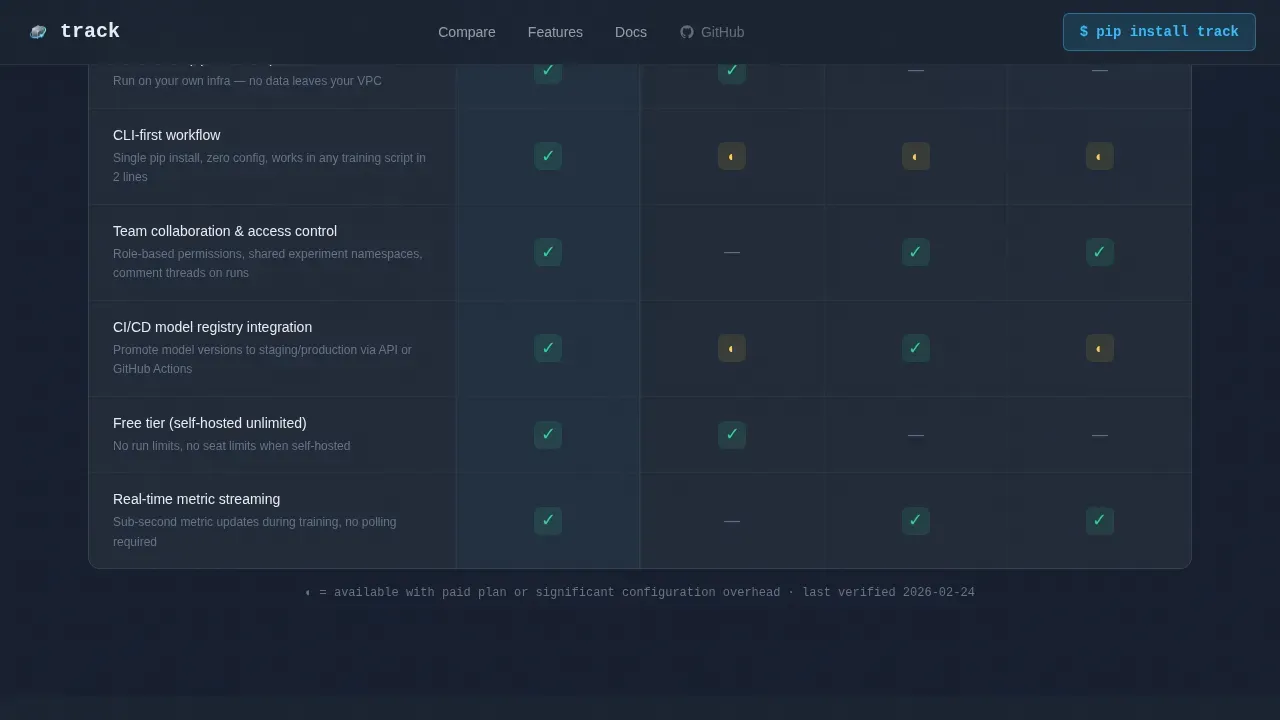
The comparison table is the scroll. Visitors immediately encounter a structured grid comparing Track against other experiment tracking tools across rows including experiment versioning, artifact storage, team collaboration, self-hosted option, command line speed, and pricing model. Checkmarks glow in sky-blue; gaps remain visibly empty. The table lets engineers compare experiments and evaluate claims without leaving the page.
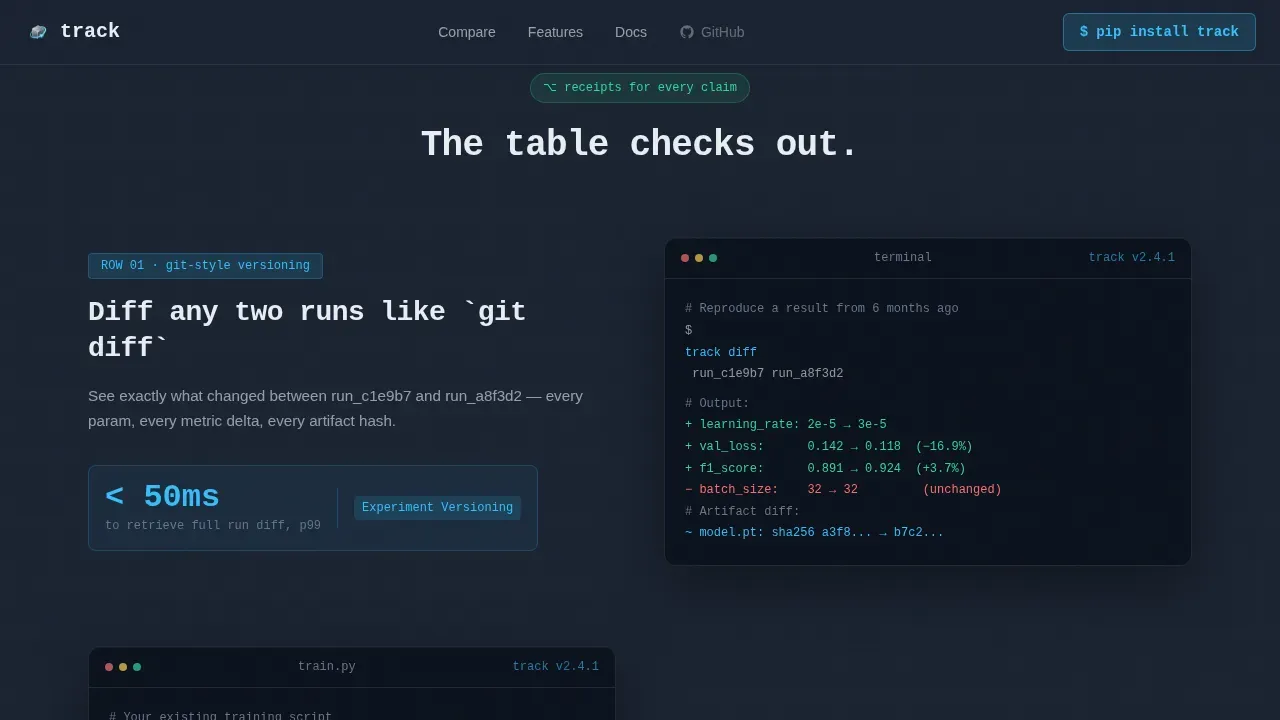
Row Deep-Dive Expansion Sections
Each scroll section after the comparison table zooms into one winning feature row. It expands into a mini-demo showing a code snippet, a short screen recording, and a benchmark number that proves the table's claim. This process keeps engineers engaged and gives data scientists the technical depth they need to make an informed decision.
One-Click CLI Install Flow
The install section presents a single command: pip install track. A copy-to-clipboard button sits beside it. Platform toggle pills let users switch between PyPI, conda, and Docker without leaving the page. The setup path is frictionless: no form, no gate, just proof then a command line instruction.
Testimonial Section with Outcome Metrics
Three testimonials from ML engineers and research leads appear with company, role, and specific outcome metrics. These are not generic quotes. They reflect real-world use cases: reproducing a six-month-old result, managing a new project under deadline, and wiring a model registry into a CI/CD pipeline.
Minimal Developer Footer
The footer follows a GitHub-developer minimal pattern. It includes links to Docs, GitHub, Status, and Privacy. This design choice signals that the platform belongs in a developer's toolkit, not a sales funnel.
Page sections overview
| Section | Purpose |
|---|---|
| Hero Dashboard Preview | Establish platform credibility with a live experiment table visual and typewriter headline |
| Comparison Table Grid | Let engineers compare experiments across frameworks row by row before committing |
| Row Deep-Dive Panels | Expand each winning table row into a code snippet, screen recording, and benchmark proof |
| CLI Install call to action | Drive app download with a one-click pip install command and platform toggle pills |
| Engineer Testimonials | Build trust with role-specific quotes tied to measurable outcomes |
| Developer Footer | Provide quick access to Docs, GitHub, Status, and Privacy links |
Design & branding system
The visual identity follows a Tech Glass theme built on a Slate and Sky color system. The aesthetic feels like a rain-streaked glass office tower at dusk: cool dark surfaces catching fragments of sky-blue light from screens inside.
- Color palette: Deep terminal slate
#1B2432for backgrounds, frosted glass panel#E8EDF2for foreground surfaces, sky-blue accent#38BDF8for interactive highlights and metric sparklines, and muted graphite#64748Bfor secondary text and table borders. - Typography: JetBrains Mono for headlines, code blocks, and metrics; DM Sans for body copy and user interface labels. This pairing keeps the terminal-glass aesthetic consistent from the hero to the footer.
- Motion and interactivity: Typewriter effect on the hero headline, beam sweep borders, scroll-triggered reveals, hover pulse glows on sky-blue elements, staggered row animations in the comparison table, and copy-to-clipboard interaction on the install command.
Mobile & speed optimization
The template is designed desktop-first, matching how machine learning engineers actually work: large monitor, terminal on one side, browser on the other. A responsive mobile fallback is included.
- Desktop-first layout: The comparison table, dashboard preview, and code snippet panels are optimized for wide viewports. Column widths, font sizes, and panel depths are tuned for large screens.
- Component architecture: Static sections use server-rendered components. Interactive elements including the comparison table, typewriter animation, and clipboard function use client-side components to keep the initial load clean.
How this template helps you convert
This template is engineered around proof-first conversion. Every design decision removes friction between a skeptical engineer and a CLI install command.
- The comparison table earns the install. Engineers can track experiments across every row in the grid before they touch the command line. The table removes the need to trust a claim; they can verify it themselves with the data in front of them.
- Row deep-dives turn claims into receipts. After the table, each expanded section shows a code snippet, a screen recording, and a benchmark number. This process transforms abstract feature statements into tangible evidence that engineers respect.
- The install call to action removes all remaining barriers. No form, no sales call, no gate. Just
pip install track, a copy button, and a platform toggle. For users not ready to self-host, a secondary path to the hosted dashboard keeps them in the funnel.
Other information about this template
This template is positioned for the ML experiment tracking tools market, where teams evaluate multiple platforms before committing. Understanding the broader landscape helps you use this template effectively to highlight what makes your platform the right tool for terminal-first engineers.
- The template is designed to sit alongside established experiment tracking tools in the evaluation process. Platforms like MLflow offer open source experiment lifecycle management, and mlflow tracking is a common benchmark engineers already know. Positioning clearly against mlflow tracking helps visitors understand your differentiation immediately.
- Weights and Biases (W&B) is widely used for experiment tracking, dataset versioning, and model management. Comet ML is a cloud-based MLOps platform that helps data scientists track experiments and manage the model lifecycle. Neptune.ai is built with a strong focus on collaboration and scalability. The comparison table in this template is designed to address all of these directly in one grid.
- Other tools in the ecosystem include ClearML, an open source platform for automating and orchestrating machine learning workflows, and DVC (Data Version Control), an open source version control system created specifically for machine learning projects. TensorBoard handles visualization for TensorFlow users. Scikit-learn users frequently need lightweight experiment tracking that does not require a heavy mlops tools stack.
- The template supports documentation patterns aligned with machine learning project best practices. A machine learning project documentation template should include sections for goals, metrics, and outcomes. The project root document serves as the index README, capturing decision-making context and references. The goals section tracks primary goals, vision, output metrics targeted for improvement, scope, and use cases.
- A machine learning project template should document training data locations, validation data paths, and test set references. The machine learning model section of any project doc focuses on model performance, training methods, and metrics. The outcomes and monitoring section documents the results of experiments, variants tested, and observations.
- The template's experiment table columns align with documentation best practices. Columns include Run ID or Name, Timestamp, Status, Key Metrics, Hyperparameters, and Git Hash or Tag. Core evaluation metrics displayed include Accuracy, Precision, Recall, F1-Score, Loss, and AUC.
- Metadata logging in the platform captures hyperparameters, environment configurations, and source code versions without manual entry. Dataset versions including DVC hash or location are trackable. Links to saved model weights and logs are surfaced per run.
- Resource monitoring is built into the tracking model: hardware consumption including CPU and GPU utilization, memory usage, and training progress are tracked per run. The ability to monitor CPU activity during a training loop is surfaced in the dashboard preview.
- Custom key performance indicator reporting allows for defining specific thresholds for precision that trigger alerts or highlight successful runs. Real-time monitoring enables early recognition of inefficacy, enabling early stopping to save compute resources.
- You can log metrics like precision, recall, and loss directly from your models. You can use many logging frameworks at once for experiment tracking, and experiment configs allow you to overwrite parameters from the main config without touching source code.
- The template is also suitable for teams evaluating whether to run locally or move to a hosted tracking server. The self-hosted option row in the comparison grid addresses this directly. Teams can run locally first, then migrate to a hosted setup when collaboration needs grow.
- Visual representations of metrics include confusion matrices, loss curves, and precision-recall curves. Side-by-side run comparison features help identify the best-performing model quickly. Standardized naming conventions for experiments help maintain consistency as the machine learning project scales.
- Keeping a record of experiment details helps teams reproduce results, fine tune models more effectively, and build institutional knowledge. Proper experiment tracking transforms machine learning development from guesswork into a reproducible scientific process.
Theme
Tech Glass
Creative direction
Calculator/Tool First
Color system
Slate & Sky
Style
Comparison Table
Direction
App Download
Page Sections
Glass Dashboard Hero with Live Experiment Runs
Interactive Framework Comparison Table
Scroll-triggered Row Deep-dive Panels
One-click CLI Install with Platform Toggles
Engineer Testimonials with Outcome Metrics
Terminal-glass Visual System and Animation Layer
Related questions
What sections does this landing page template include?
Can I use this template to compare my platform against other experiment tracking tools?
Is this template suitable for a self-hosted experiment tracking platform?
Does the template support displaying real metric data in the hero?
Who is this template best suited for?


