Real-Time Fleet Monitoring Software Landing Page Template
Turbine is a split-screen landing page template built for power plant monitoring software. It pairs a live fleet dashboard screenshot with oversized real-time stats, signal-green calls to action, and a minimal trial form. Engineers and operations managers get a conversion-ready page that communicates turbine health, condition monitoring, and fleet-wide visibility at a glance.
by Rocket studio
Quick summary
Turbine is a dark-industrial landing page template designed for power plant monitoring software. It uses a 50/50 split-screen layout, a Tech Glass visual system, and a Stats-First Impact creative direction. Every section leads with a commanding metric. The page drives visitors toward a free trial signup using a minimal two-field form and a no-signup sandbox demo path.
Who this template is for
This template is built for software teams and product marketers selling industrial monitoring solutions to power sector buyers. The target visitors are technically minded and skeptical of generic marketing copy. They respond to data, dashboards, and operational proof.
- Operations managers running aging coal and gas fleets past their original design life
- Maintenance engineers replacing unreliable spreadsheets with a reliable condition monitoring system
- Renewable-portfolio directors managing wind turbines, solar assets, and storage across multiple state lines
What problem this template solves
Power plant software buyers are hard to impress. They monitor turbine performance daily. They have seen countless vendor pages make the same vague promises about uptime and efficiency. This template solves the credibility gap by leading with evidence instead of claims.
- Generic SaaS landing pages fail to communicate the real-time data precision that engineers demand
- Visitors leave before reaching the value proposition when there is no live data proof above the fold
- Long signup forms push away engineers who trust product access over a sales pitch
What you get with this template
You get a fully structured, single-page layout ready to drop your product visuals and copy into. Every section is purpose-built around the Stats-First Impact direction, so the page escalates from monitoring to predicting to optimizing as the visitor scrolls.
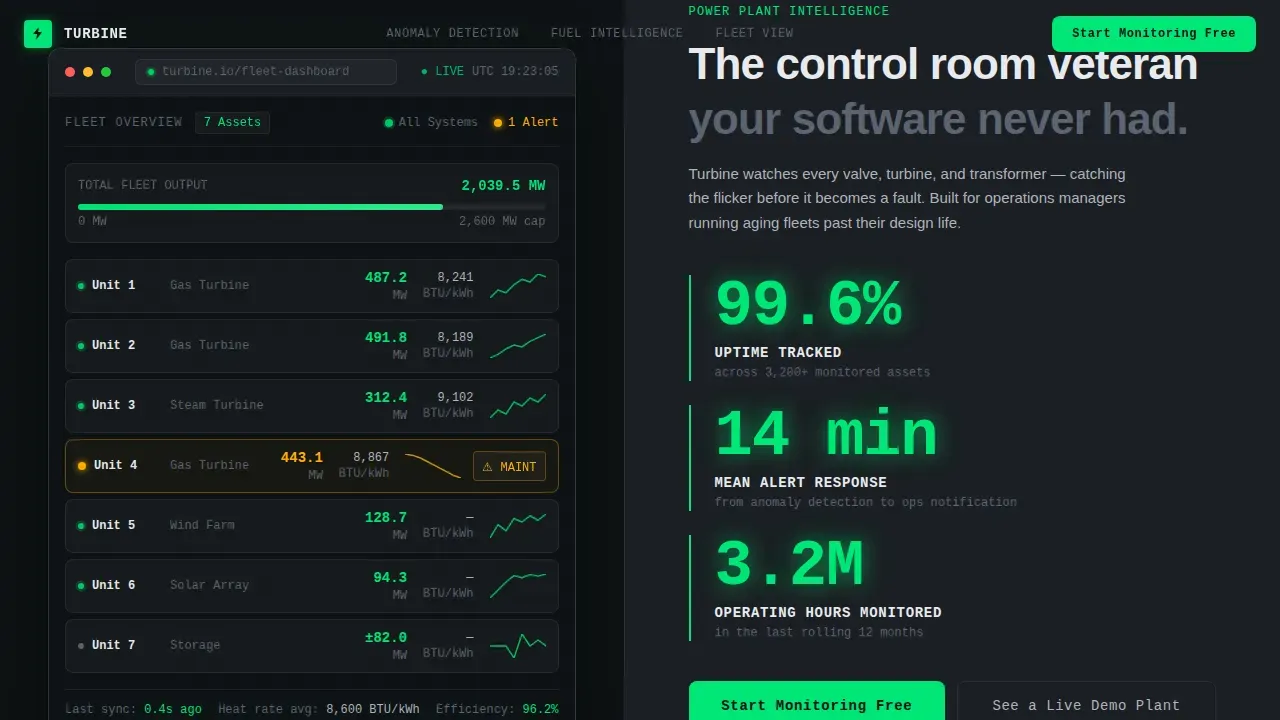
- A 50/50 split-screen hero with a frosted-glass product dashboard frame and three oversized mono stats
- Scrolling split sections pairing a commanding metric on the left with a product view on the right
- A sticky conversion bar, a minimal two-field trial form, and a secondary read-only demo sandbox path
Feature list
This template ships with six core functionalities designed to help software teams in the power and wind energy sector convert technically demanding buyers.
Split-Screen Hero with Live Dashboard Frame
The hero places the platform dashboard inside a frosted-glass browser frame on the left half. The right half stacks three hero stats in oversized monospace type: 99.6% uptime tracked, 14-minute mean alert response, and 3.2 million operating hours monitored. No stock imagery, no lifestyle photos. The product is the proof.
Stats-First Scrolling Sections
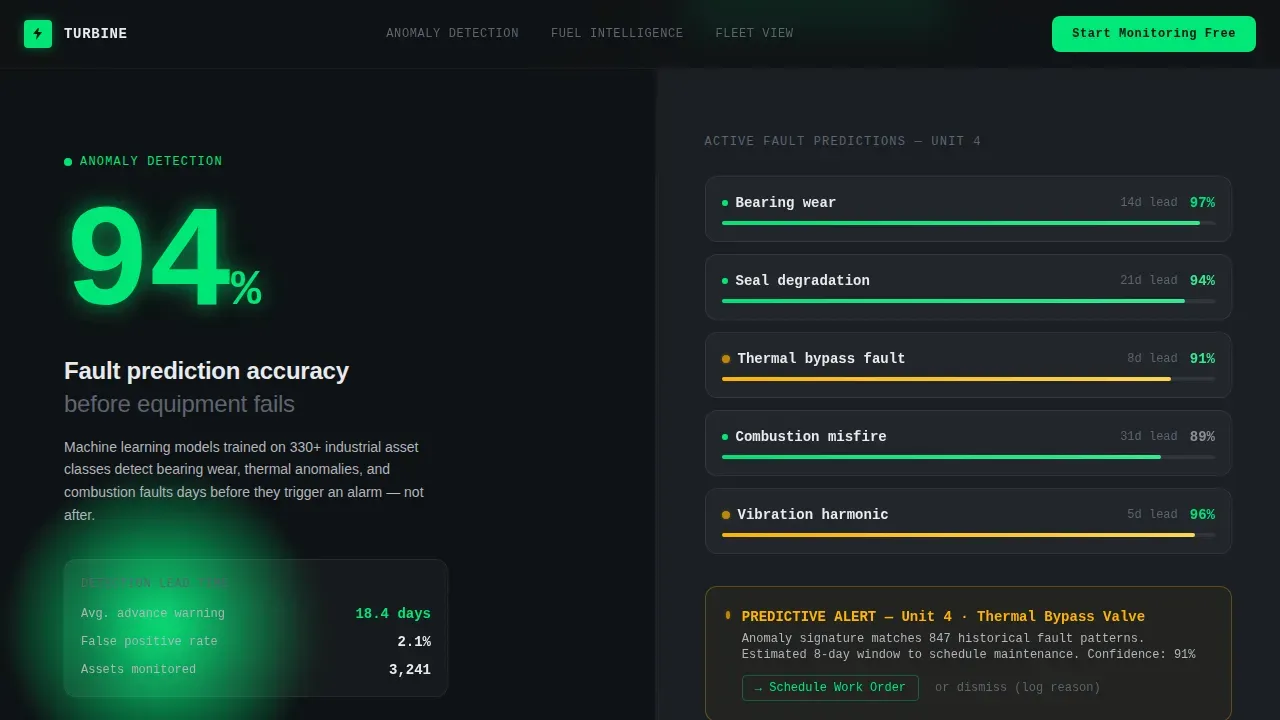
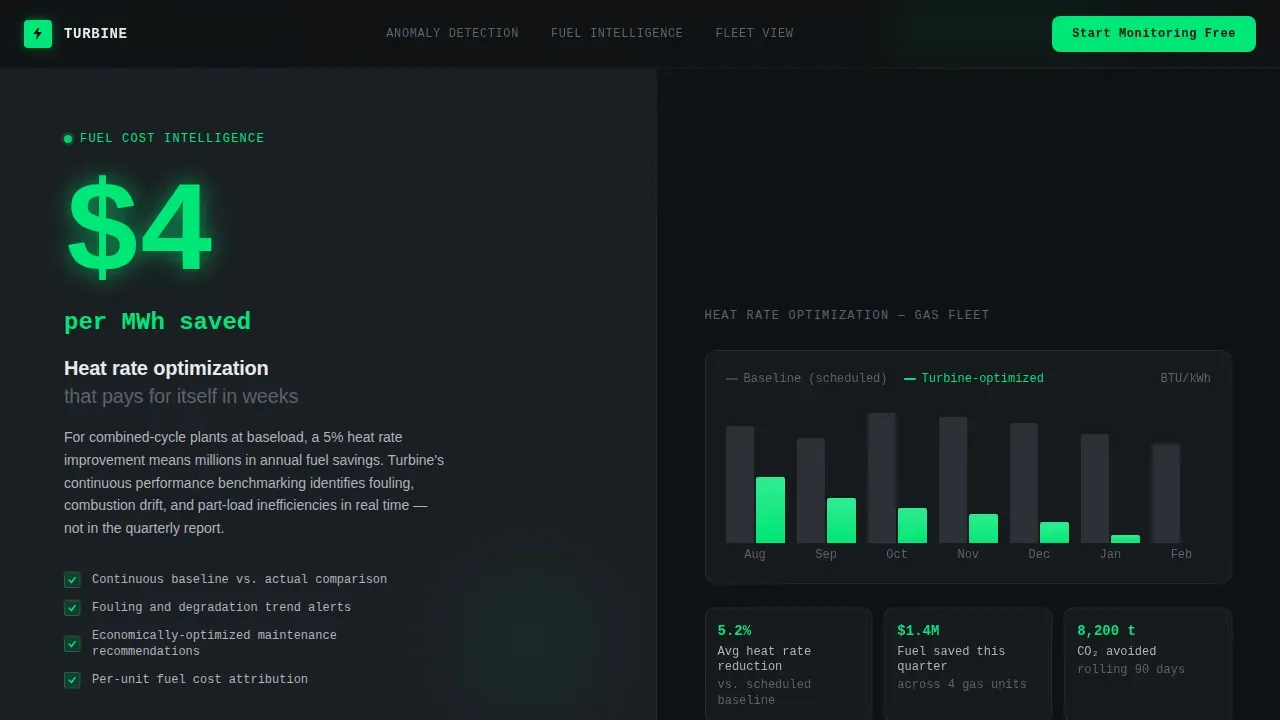
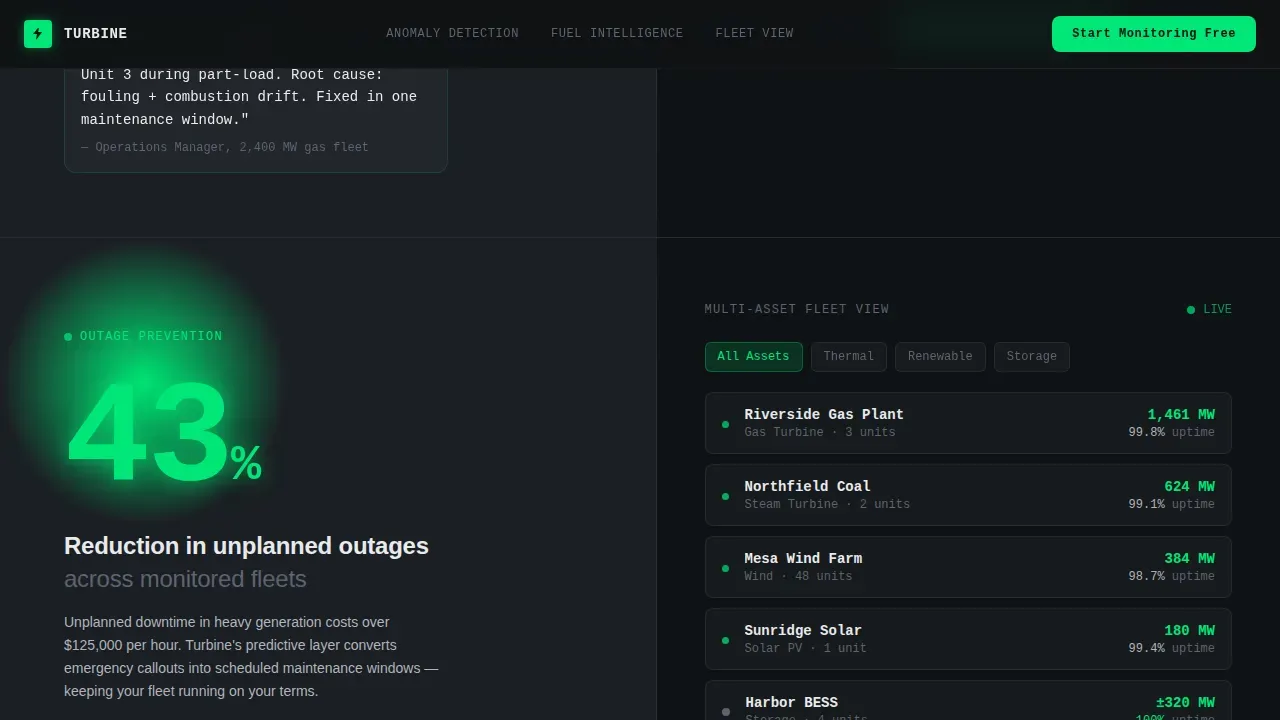
Each scroll section splits the screen between one commanding metric and one product view. The metrics cover anomaly detection accuracy, fuel-cost savings per megawatt-hour, and unplanned-outage reduction. Numbers animate on scroll, counting up from zero in signal-green. This system helps the user build confidence in the software through real-time data storytelling rather than bullet-point feature lists.
Sticky Conversion Bar
A sticky call-to-action bar activates after the visitor passes the second scroll section. It keeps the primary call to action visible without interrupting the reading experience. This persistent control nudges engineers and operations managers toward signup at the exact moment the data analysis has built sufficient trust.
Minimal Trial Form with Fleet-Size Selector
The trial form collects only two inputs: work email and fleet size. Fleet-size options cover single plant, 2 to 10 assets, and 10 or more assets. Keeping lead capture simple is critical in a business-to-business context where lengthy forms reduce conversion rates sharply.
Dual Call-to-Action with Sandbox Demo Path
The primary call to action reads "Start Monitoring Free" in signal-green on reactor gray. The secondary path offers "See a Live Demo Plant," a read-only sandbox requiring no signup. This dual approach serves both buyers ready to commit and engineers who need to access data and explore the system before they trust it.
Animated Dashboard Elements and Hover States
The template supports count-up number animations on scroll, pulse animations on live data points, and hover states on individual asset cards. A subtle scanline overlay reinforces the control-room aesthetic. These interactive functions create a sense that the software is live and responsive, not a static brochure.
Page sections overview
| Section | Purpose |
|---|---|
| Hero Split Screen | Dashboard proof and oversized stats above the fold |
| Metrics Impact | Anomaly detection metric paired with product view |
| Predictive Intelligence | Fuel-cost savings metric with heat-rate visualization |
| Fleet Coverage | Outage reduction metric with multi-asset fleet grid |
| Trial Call to Action | Minimal form, sticky bar, and sandbox demo link |
| Footer | Linear single-row footer with essential links |
Design & branding system
The visual identity follows a Tech Glass theme built on a Monochrome Steel color system. Every color choice has a functional reason. The palette feels like a stainless-steel instrument panel: cool, precise, and zero decoration.
- Reactor gray (#1B1F24) for backgrounds, brushed-steel mid-tone (#5C6370) for secondary surfaces, and frosted-glass panel white (#E8EAED) for card layers
- Signal green (#00E676) reserved exclusively for live data points, animated count-up numbers, and primary calls to action to draw the eye exactly where action is needed
- JetBrains Mono for all stats and data values; DM Sans for body copy to separate operational data from explanatory text
Mobile & speed optimization
The template is desktop-first by design, matching the control-room workstation environment where operations managers and engineers spend most of their working hours. Responsive breakpoints ensure field technicians and managers on mobile devices can still access the page cleanly.
- Responsive layout adapts the 50/50 split to a stacked single-column view on smaller screens and mobile devices
- Server Components handle static sections while Client Components manage animated counters and the sticky bar, keeping interactive functions smooth
- The desktop layout uses ample whitespace to prevent dashboard overload and help key metrics stand out at any screen size
How this template helps you convert
The entire page structure is engineered around one goal: moving a skeptical engineer from first scroll to free trial. The Stats-First Impact direction means every section builds on the last, escalating the case for the software without a single unproven claim.
- The hero places oversized stats and a live dashboard screenshot above the fold, delivering immediate operational credibility before the visitor reads a single sentence of copy
- Scrolling split sections let the user analyze specific performance outcomes, such as reduced downtime, fuel savings, and outage reduction, in the exact language that operations teams use internally
- The sticky call to action bar and frictionless two-field form remove the final barrier, while the no-signup sandbox demo path gives engineers a direct way to access data and validate the software on their own terms
Other information about this template
This template is purpose-built for the power plant and wind energy software market. Several design and structural decisions reflect best practices from the broader wind turbine monitoring and industrial SaaS space.
- Wind turbines, generators, and other rotating assets require early detection of mechanical changes. The template's alert-pulse design supports showcasing automated notifications for imminent component failures, helping teams protect assets and reduce downtime
- Condition monitoring systems that monitor wind turbine drivetrain components benefit from cloud-based analytics. The template's cloud-ready layout supports showcasing how operators can scale their solution to cover an entire wind fleet or entire fleet of mixed assets across multiple sites
- IoT-driven data acquisition from sensors placed on wind turbines produces high-velocity streams of tags, events, and alerts. The template supports presenting this data acquisition capability with live data feeds and real-time data visualizations that analysts and engineers can trust
- Wind turbine monitoring platforms that consolidate data from various turbine manufacturers need clear, scannable dashboards. The template's dashboard section is structured for displaying key metrics such as wind speed readings, heat-rate trend analysis, and vibration analysis
- Remote monitoring of wind turbines requires fast identification of underperforming assets. The template's map-based fleet grid section helps software teams communicate that field engineers can remotely investigate a turbine and determine next steps without traveling to the site
- For context on the broader market, platforms such as FleetMONITOR, Dewesoft, and WiSE represent the kind of industrial wind turbine condition monitoring solutions this template is designed to support in their go-to-market pages
- The template's configuration is straightforward. Swap in your own dashboard screenshots, update the hero stats, and adjust the fleet-size selector options to match your platform's tiers
- Security-conscious buyers will look for trust signals. The template leaves space to include compliance badges and statements such as ISO 27001 data security alignment, giving your team room to add the feedback and reassurance enterprise customers expect
Theme
Tech Glass
Creative direction
Stats-First Impact
Color system
Monochrome Steel
Direction
Freemium/Trial
Page Sections
Split-screen Hero with Dashboard Proof
Stats-first Scrolling Split Sections
Sticky Conversion Bar
Minimal Two-field Trial Form
Dual Call to Action with No-signup Sandbox Demo
Animated Dashboard and Asset Card Interactions
Related questions
Can I use this template for a wind turbine monitoring software product?
Does the template include both a free trial call to action and a demo path?
Is this template designed for desktop or mobile users?
How does the template communicate condition monitoring capabilities?
Can the layout show monitoring across a large multi-asset fleet?



