Uptime - Powerful Robotics Landing Page Template
Uptime is a robotics management landing page template built for industrial software teams. It opens with a live ROI calculator, flows through data-backed industry findings styled as dashboard cards, and closes with a two-step lead capture sequence. The dark Midnight Blue palette and electric green data points give the page the feel of a real control room at peak operations.
by Rocket studio
Quick summary
Uptime is a single-page template for robotics fleet management software. It leads with an interactive ROI estimator styled as a live dashboard tile, then builds credibility through industry-report-style scroll sections. The design runs on a deep navy and electric green palette that feels like a functioning control room. Every section is built to generate qualified leads.
Who this template is for
This template is built for teams selling or marketing industrial robotics software to operations-level buyers. It speaks directly to people who manage large, complex robot fleets and need data before they commit to a new platform.
- Operations directors running high-volume automotive welding lines
- Logistics managers coordinating automated guided vehicle fleets across multiple facilities
- Integration engineers connecting mixed-brand robot fleets from different manufacturers
What problem this template solves
Industrial robot fleet managers do not respond to generic software pitches. They need to see numbers that apply to their situation before they trust any tool. Most landing pages in this space lead with marketing copy and ask for a demo before proving any value.
- Visitors leave before engaging because the page feels like a brochure, not a product
- Generic industry statistics feel untethered from the visitor's actual fleet costs
- Lead capture forms appear before the tool has demonstrated any personal relevance
What you get with this template
You get a fully structured, single-page layout designed around a specific buyer journey in robotics fleet management software. Every section serves a conversion function, and the visual system is production-ready out of the box.
- An interactive ROI calculator as the primary header component, with three sliders and a live output panel
- A series of scroll sections styled as dashboard cards, each presenting a data-backed industry finding
- A two-step lead generation sequence: a calculator-triggered slide-in form and a gated PDF download button
Feature list
This template includes purpose-built components for the robotics software buyer journey. Each section is designed to earn trust and move the visitor toward a conversion action.
Interactive ROI Estimator Header
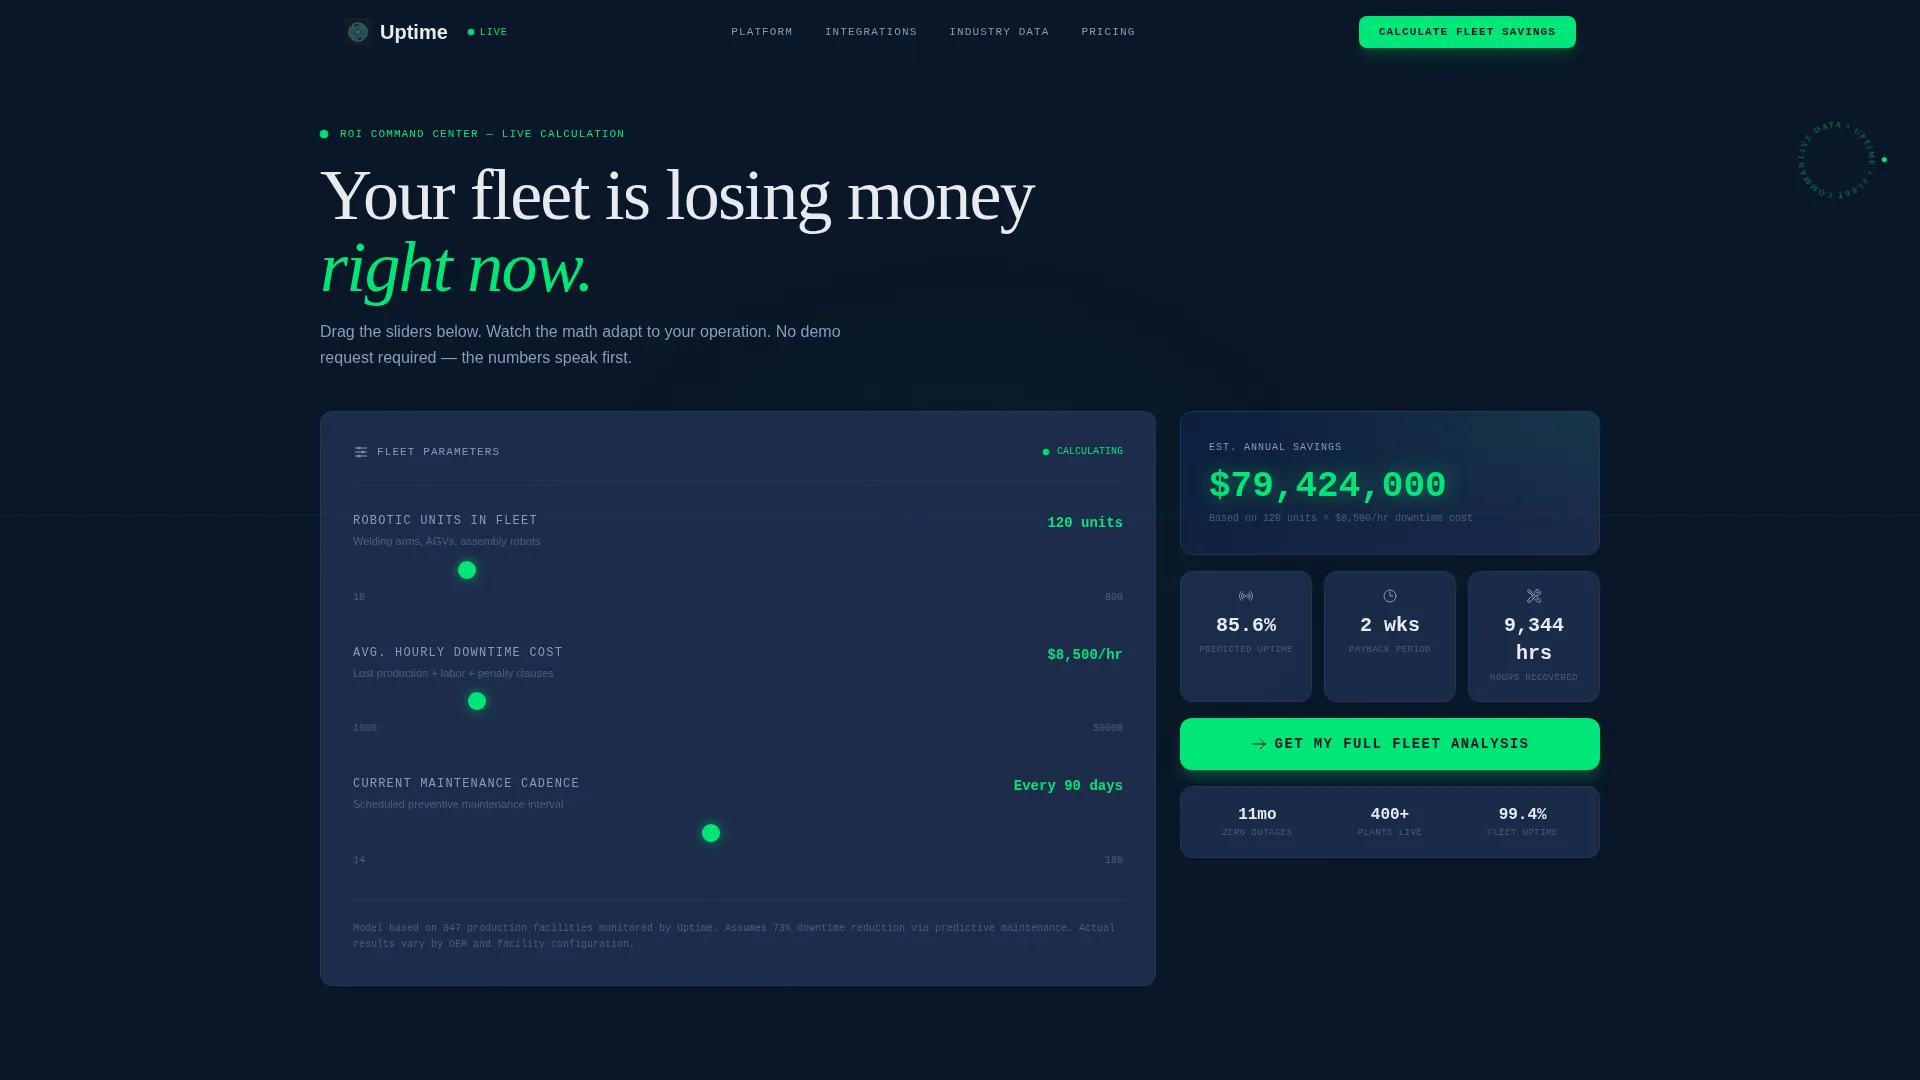
The header is a functioning calculator tile, not a hero image. Three sliders let visitors input their number of robotic units, average hourly downtime cost, and current maintenance cadence. The output panel updates in real time, displaying annual savings, predicted uptime percentage, and payback period in weeks. Numbers animate like a live trading terminal to reinforce the sense of a working system.
Industry Report Scroll Sections
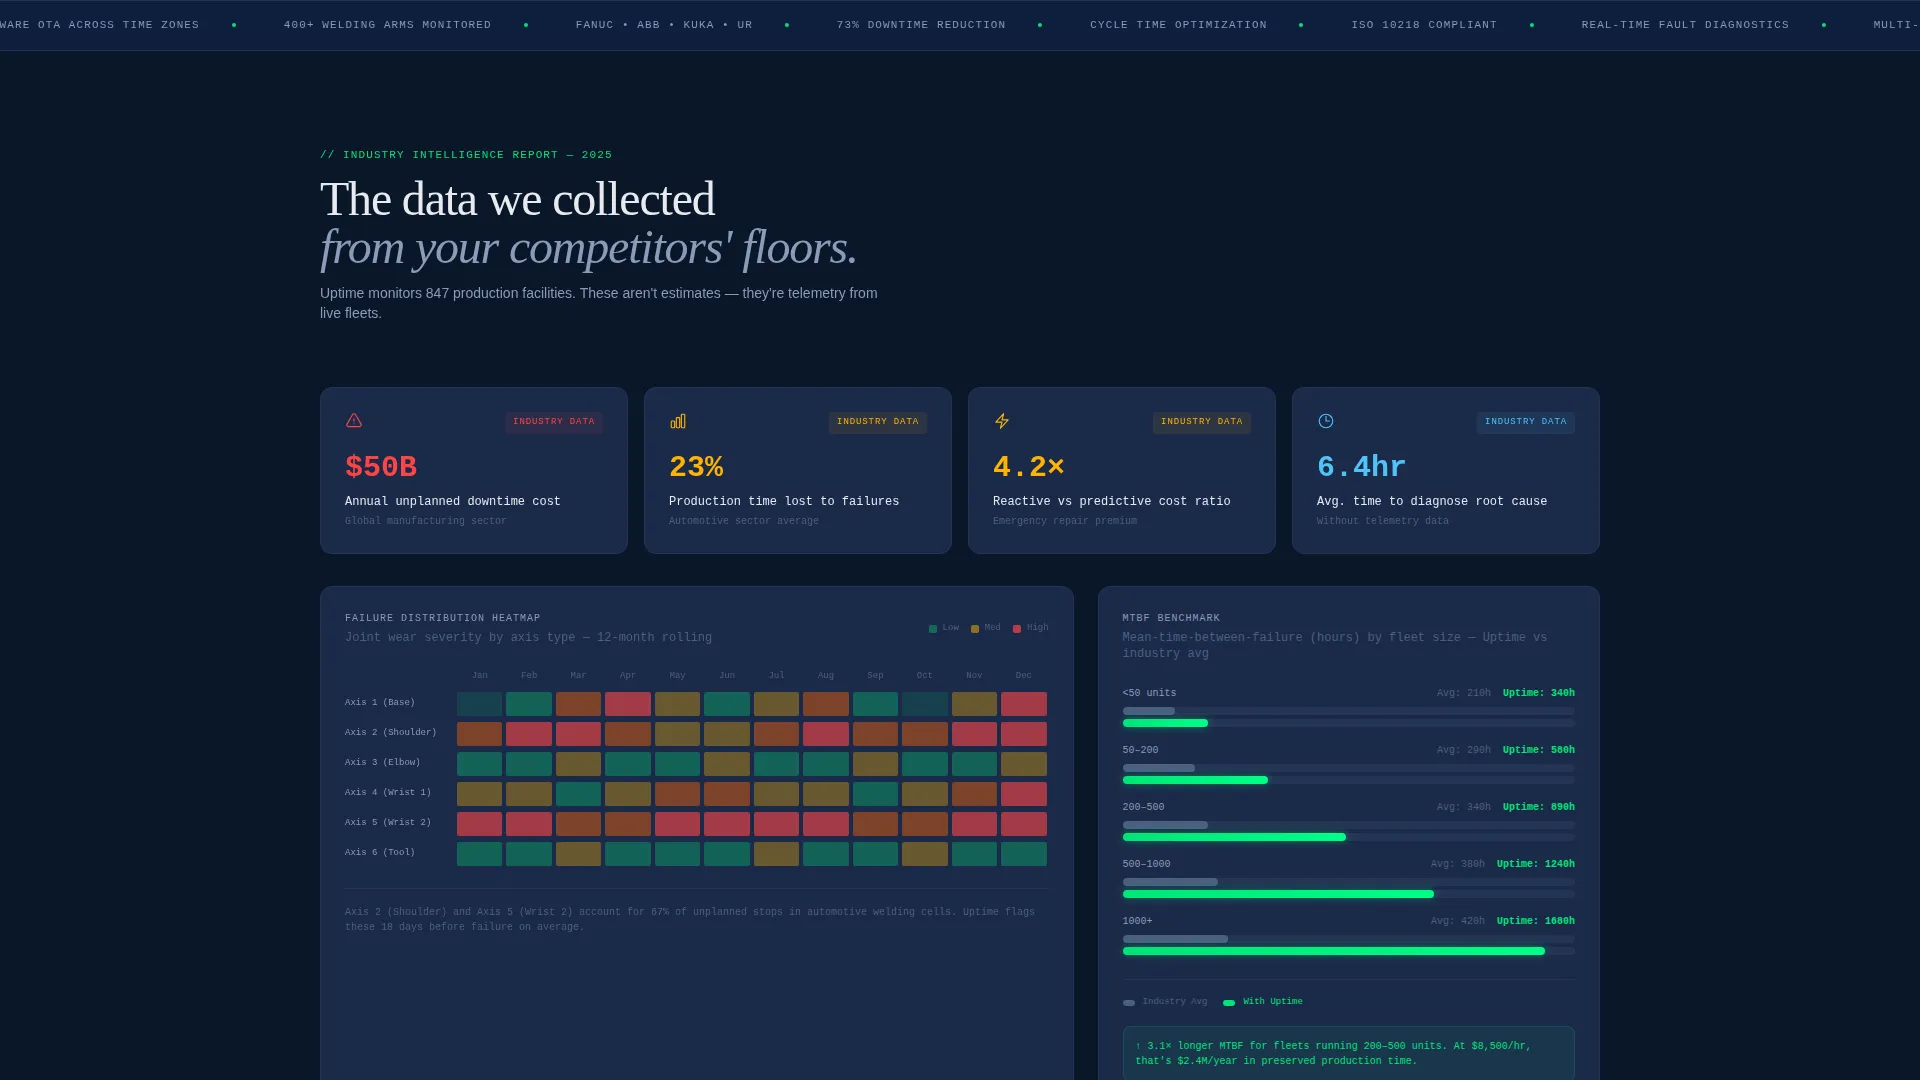
Below the fold, each scroll section presents a data-backed industry finding formatted as a dashboard card. A key performance indicator tile displays the global cost of unplanned downtime. A heatmap visualizes failure distribution across robot joint types. A benchmark comparison chart plots fleet sizes against mean time between failures. Each card reinforces that the software already has the operational data to back up these claims.
Sticky Call-to-Action Bar
The primary call to action, "Calculate Your Fleet Savings," anchors to the header estimator and reappears as a sticky bar after the visitor passes the second scroll section. This keeps the conversion path visible without interrupting the reading flow.
Two-Step Lead Capture Sequence
Once the calculator is completed, a slide-in panel collects work email, fleet size confirmation, and primary robot manufacturer from a dropdown. A secondary gated button offers the 2025 Robotics Downtime Report PDF for visitors who are researching but not yet ready to speak with a team.
Dashboard Card Visual System
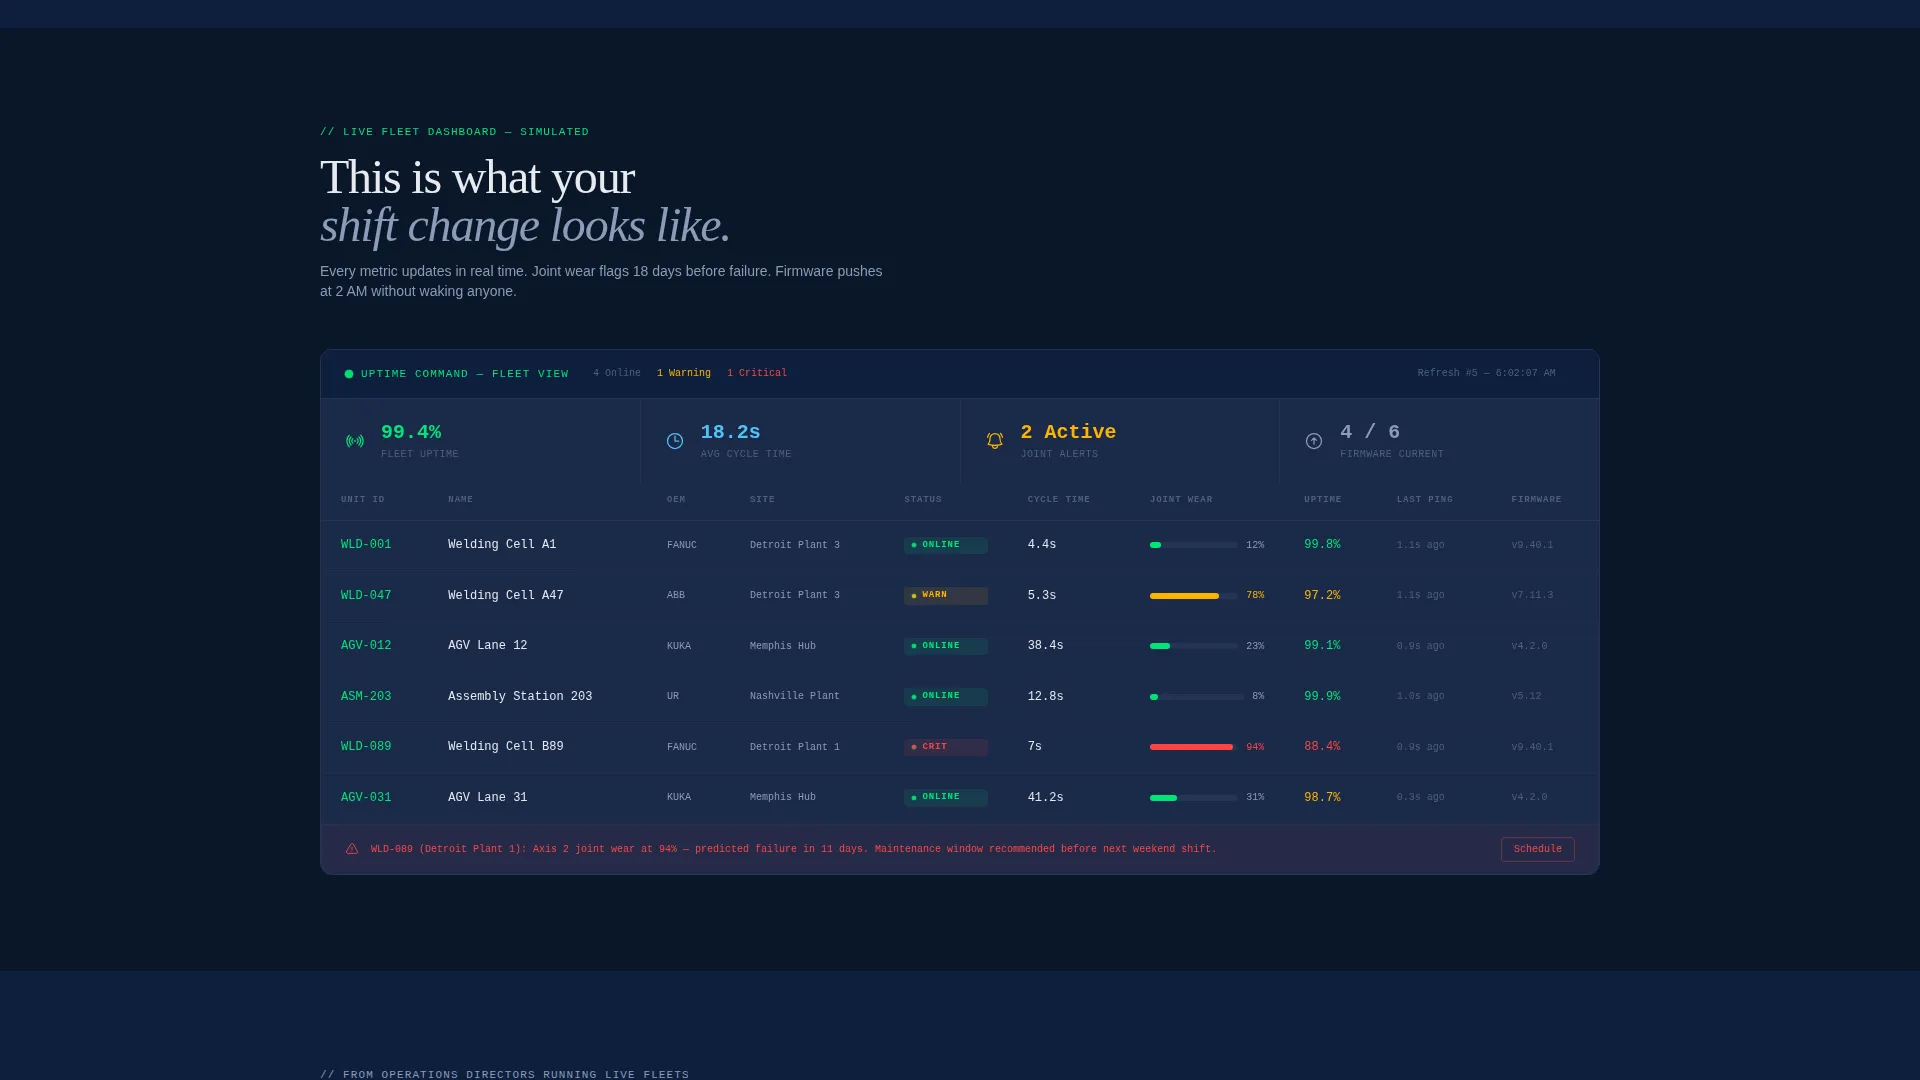
Every data section is rendered as a dashboard card with panel borders and status indicators. The layout uses a data grid structure that signals a real software product rather than a marketing page. Visitors feel they are already inside the platform before they sign up.
Page sections overview
| Section | Purpose |
|---|---|
| ROI Calculator Header | Opens with a live estimator that personalizes value before any paragraph is read |
| KPI Downtime Tile | Presents global downtime cost data as a credibility-building dashboard card |
| Joint Failure Heatmap | Visualizes robot failure distribution to demonstrate deep operational knowledge |
| Fleet Benchmark Chart | Compares fleet size against mean time between failures to anchor competitive context |
| Sticky call to action Bar | Keeps the primary conversion action visible throughout the scroll journey |
| Slide-In Lead Form | Captures qualified leads after the calculator completes its output |
| Gated PDF Download | Offers a secondary lead capture path for research-stage visitors |
Design & branding system
The visual identity runs on a Midnight Blue color system that channels the atmosphere of a submarine sonar room or a late-night control center. Every color choice prioritizes data legibility and operational authority.
- Deep terminal navy (#0A1628) for all backgrounds, keeping data elements visually elevated
- Gunmetal panel borders (#1B2A4A) to define dashboard card edges without adding visual noise
- Electric status green (#00E676) used exclusively on live data points, success states, and active indicators, so the accent color retains its signal meaning
- Signal white (#E8EAED) for all primary typography, maintaining high contrast against the dark base
Mobile & speed optimization
The template is designed to remain functional and readable across screen sizes without sacrificing the dashboard aesthetic. The data grid layout adapts so that slider controls and output panels stay usable on smaller viewports.
- Slider-based calculator inputs are touch-friendly and sized for comfortable interaction on mobile devices
- Dashboard card sections reflow into single-column stacks on narrower screens without losing their visual hierarchy
- The sticky call-to-action bar remains anchored and visible on mobile scroll, keeping the conversion path accessible throughout the page
How this template helps you convert
The conversion architecture treats the calculator as the primary sales tool and the form as a downstream collection step. This approach reduces friction because the visitor has already seen personalized value before any commitment is requested.
- The ROI estimator in the header delivers a personalized output before any marketing copy appears, so the visitor arrives at the form already convinced by their own numbers
- The sticky call-to-action bar reintroduces the primary conversion action at the right scroll moment, catching visitors who are ready after reading the industry report sections
- The two-step lead form sequence separates interest from intent, letting the PDF download capture early-stage researchers while the slide-in panel focuses on fleet managers ready to act
Other information about this template
This template is part of the Startup Velocity theme family, which uses bold, data-forward layouts built for software products that need to establish authority quickly with technical buyers.
- The template style is Dashboard and Data Grid, making it well suited for any vertical software product that leads with live data or real-time metrics
- The creative direction follows an Industry Report format, which is particularly effective for robotics vertical software where buyers trust data over marketing language
- The header concept is a Calculator and Estimator, a format that outperforms static hero sections for high-consideration software purchases
- The lead generation direction supports both high-intent buyers through the slide-in form and early-stage researchers through the gated PDF download path
- The template is categorized under Technology and Robotics Vertical Software as a Service, making it a natural fit for platforms managing industrial automation at scale
Theme
Startup Velocity
Creative direction
Industry Report
Color system
Midnight Blue
Style
Dashboard/Data Grid
Direction
Lead Generation
Page Sections
Interactive ROI Estimator Header
Industry Report Dashboard Cards
Sticky Call-to-action Bar
Two-step Lead Capture Sequence
Dashboard and Data Grid Layout
Related questions
Can I adapt the ROI calculator inputs for a different industry?
Does the template include the actual chart and heatmap data?
What lead capture tools does the form work with?
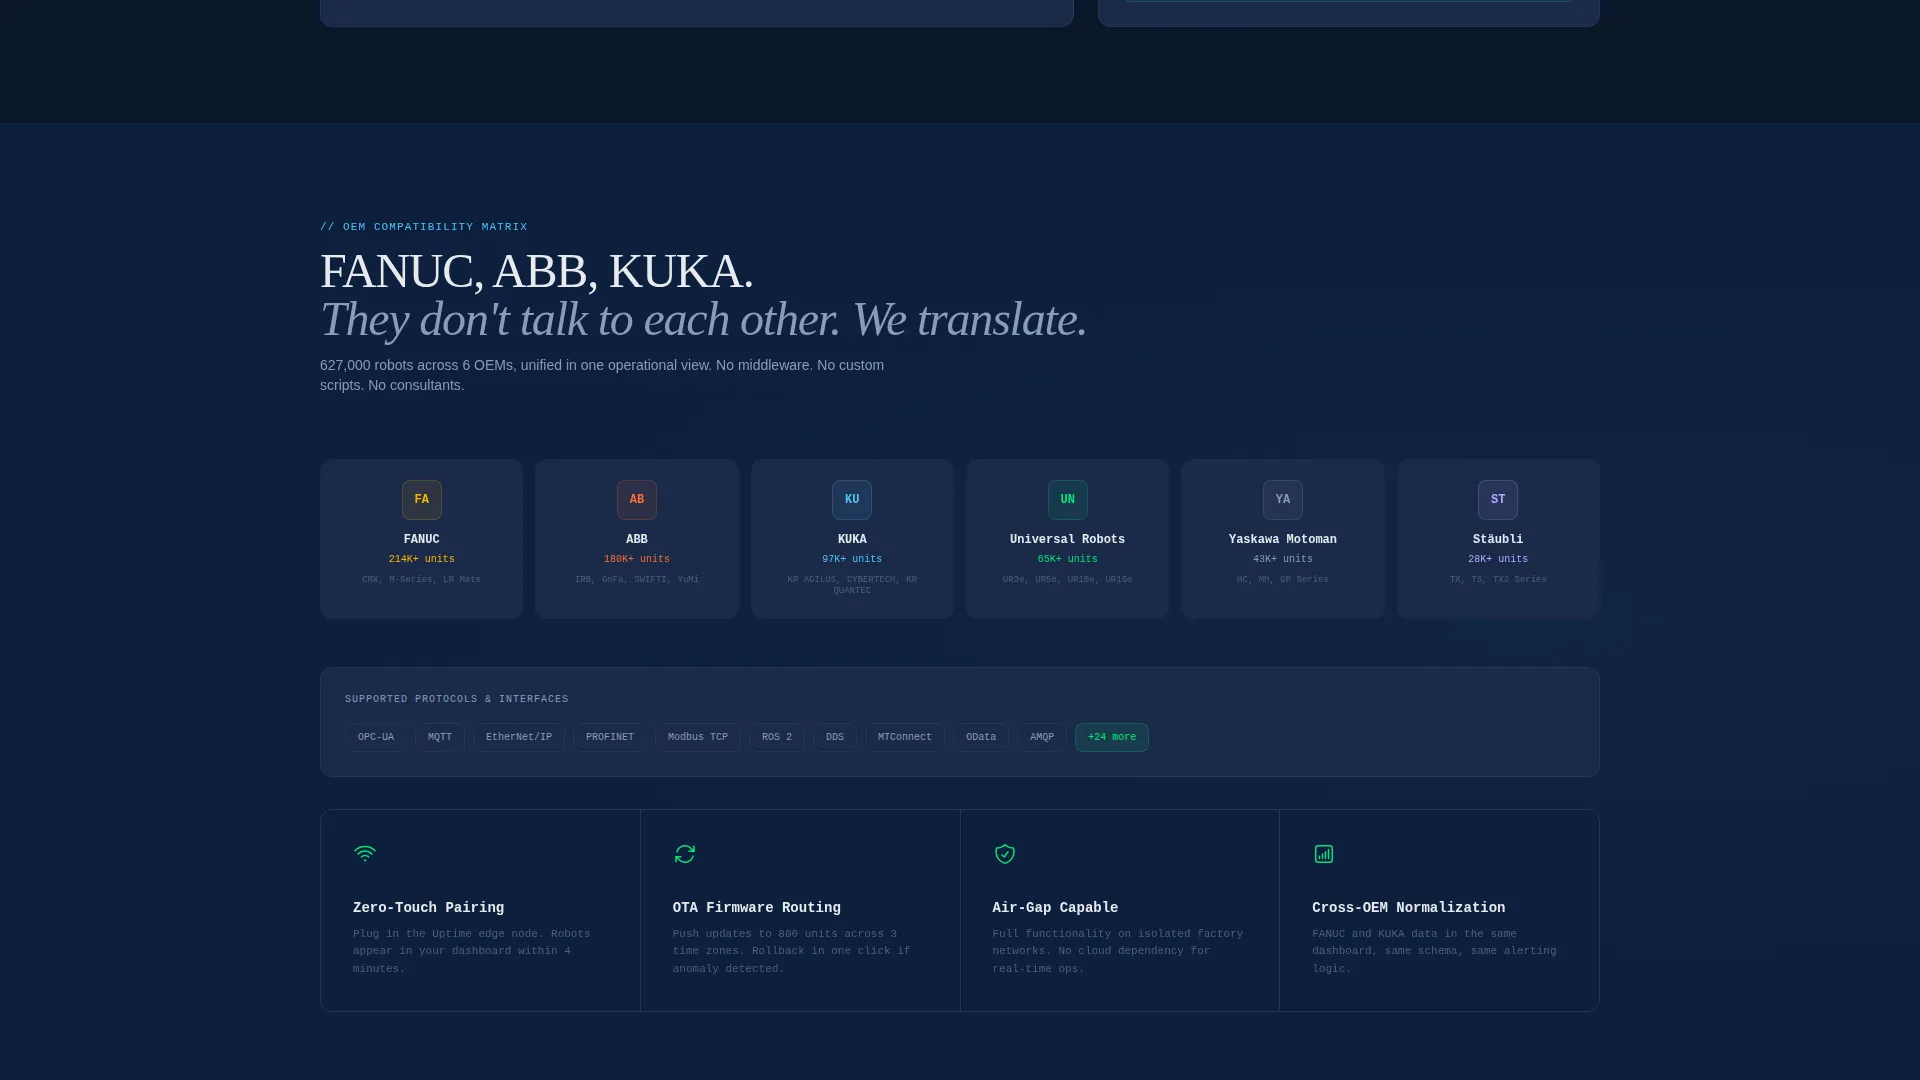
Is this template suitable if my software covers more than one robot manufacturer?
Who is the primary audience this landing page template is designed to reach?



