Complete Advanced Tech & AI Platforms Cost Estimator Website Template
Uptime is a dashboard-style predictive maintenance landing page built for industrial technology platforms. It features a live metrics header, an animated competitive comparison matrix, a dynamic savings calculator, and a focused lead-capture form. The design runs on forge-black and signal-green, giving the page the look and feel of a real control room in full operation.
by Rocket studio
Quick summary
Uptime is a single-page template designed for predictive maintenance platforms targeting plant managers, reliability engineers, and operations directors. It opens with a live stats dashboard, scrolls through an animated feature comparison matrix, and closes with a conversion-focused form. The entire visual identity is built on an industrial monochrome palette with a signal-green accent.
Who this template is for
This template is built for teams selling condition-based monitoring and predictive maintenance technology to industrial buyers. It speaks directly to the people responsible for keeping machines running and margins intact.
- Plant managers overseeing mixed fleets of aging and modern equipment
- Reliability engineers who want to move from calendar-based schedules to condition-driven decisions
- Operations directors who have experienced unplanned shutdowns erasing quarterly margins
What problem this template solves
Industrial buyers are skeptical. They've seen basic monitoring tools overpromise and under-deliver. This template addresses that skepticism head-on by structuring the entire page around comparison and proof rather than generic feature lists.
- It makes the cost of inaction visible through a real-time savings calculator
- It dismantles competing approaches row by row before asking for a single click
- It gives visitors a low-commitment secondary path, a downloadable comparison report, for those still building internal buy-in
What you get with this template
You get a complete, single-page layout built specifically for a predictive maintenance platform. Every section is purposefully sequenced to move an industrial buyer from awareness to action.
- A live-data header dashboard with six animated metric tiles
- A twelve-row animated feature comparison matrix with full-width data visualization breaks
- A dynamic downtime cost calculator and a two-call to action lead-capture form with a gated PDF secondary offer
Feature list
This template delivers purpose-built components that work together across a single, high-intensity scroll experience.
Live Metrics Dashboard Header
The header functions as a control-room viewport. It displays six real-time metric tiles: remaining useful life countdowns in days and hours, vibration amplitude waveforms, bearing temperature trend lines, a fleet-wide health score, an anomaly detection count, and a running estimated savings figure. Numbers are set in a monospaced typeface large enough to read from across a room. Micro-animations keep waveforms undulating and counters ticking so visitors immediately sense active monitoring.
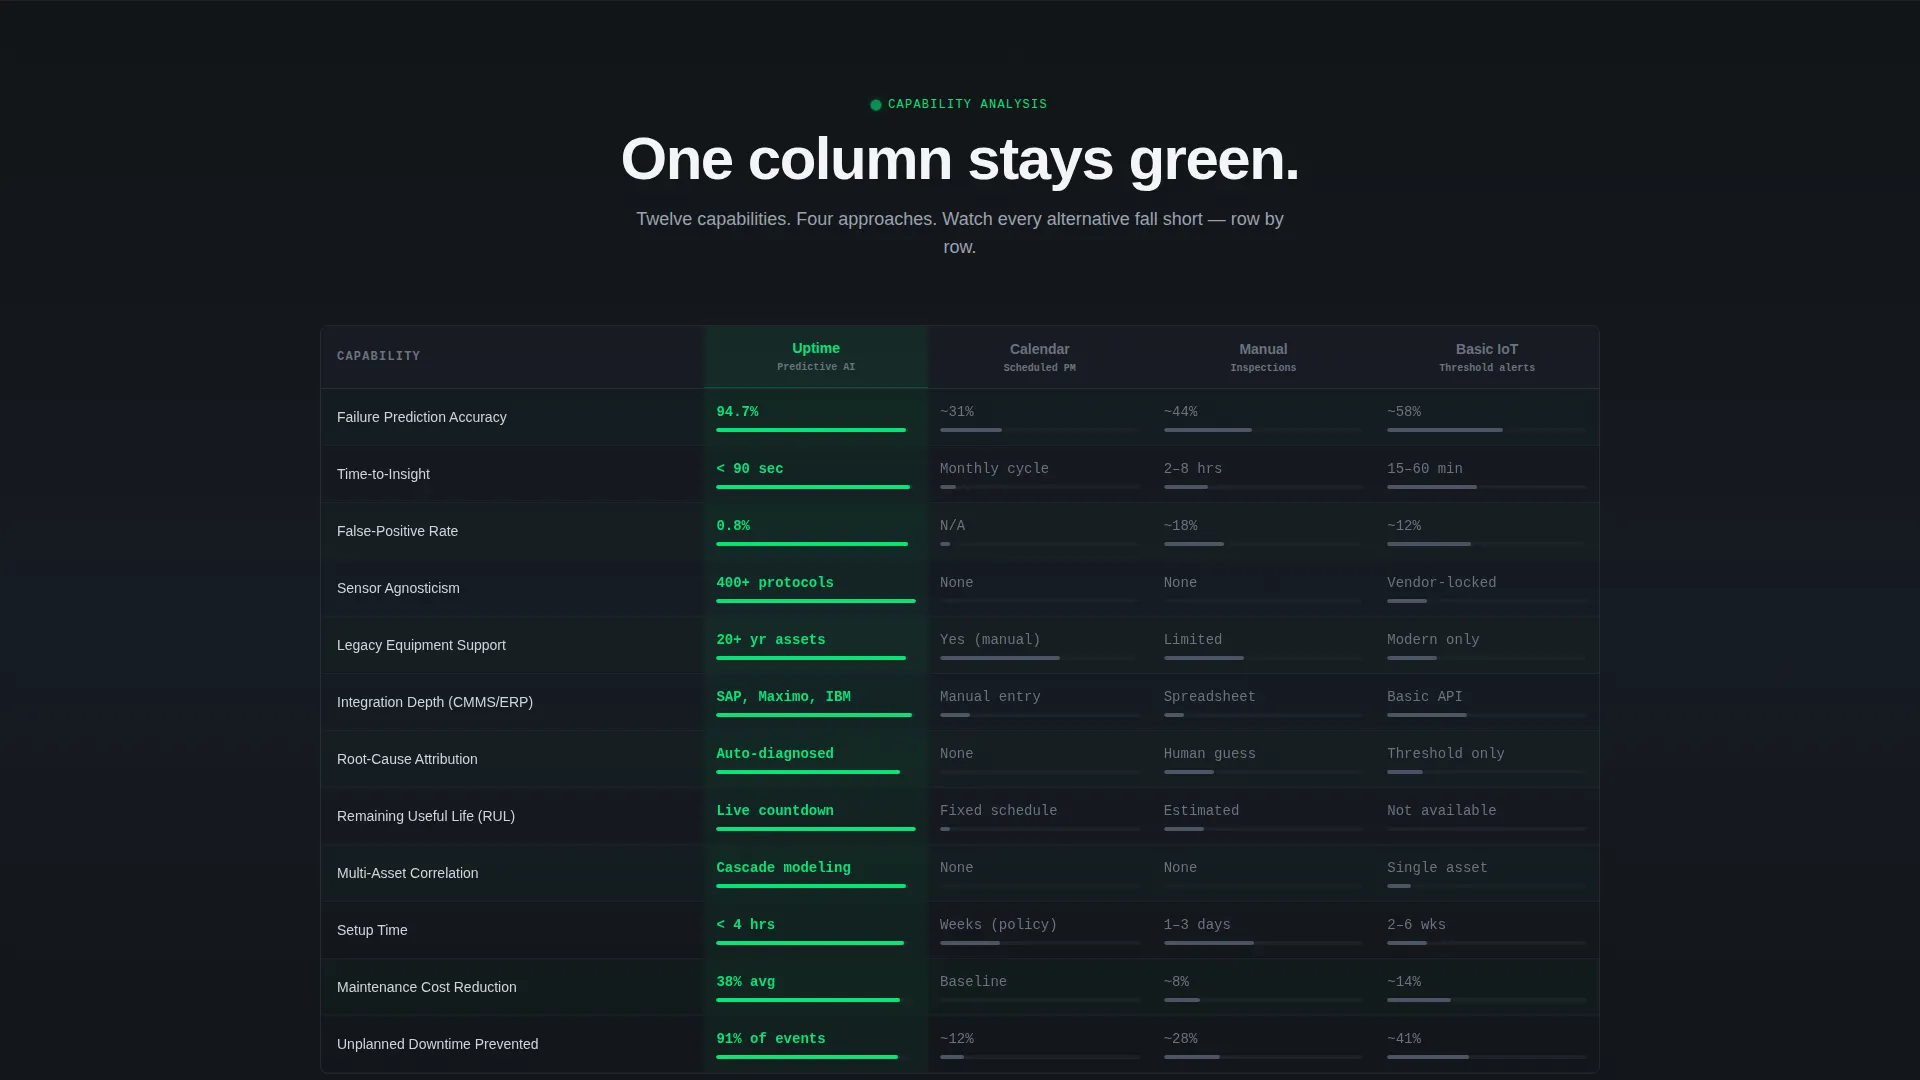
Animated Competitive Comparison Matrix
Below the header, a structured grid compares the platform against calendar-based maintenance, manual inspections, and basic IoT monitoring across twelve capability rows. Each row animates in with a horizontal wipe, filling the platform column in signal-green while competitors remain in muted steel-gray. The systematic layout makes it clear which approach covers every capability and which ones fall short.
Full-Width Data Visualizations
Between comparison blocks, three full-width data visualizations break the grid: a vibration spectrogram, a degradation curve, and a Weibull distribution chart. Each one visually demonstrates a specific capability that competing approaches cannot replicate, keeping the scroll engaging and technically credible.
Dynamic Downtime Cost Calculator
A mid-page interactive calculator lets visitors enter their average hourly downtime cost and watch projected annual savings update in real time. This converts the comparison from an abstract feature discussion into a personalized financial argument before the conversion form appears.
Dual-Path Conversion Form
The primary call to action, "Run a Free Asset Assessment," is anchored to the header and repeated after the final comparison row. The form captures three fields: number of monitored assets, primary equipment type, and work email. A secondary path offers a gated PDF download for visitors who need more time to build internal support.
Signal-Green Accent System
Signal-green (#00E676) appears exclusively on live data pulses, healthy-state indicators, and primary call-to-action elements. Used sparingly against a forge-black background, each green element carries immediate meaning. Visitors learn within seconds that green means something is alive and monitored.
Page sections overview
| Section | Purpose |
|---|---|
| Live Metrics Header | Display six animated real-time asset health tiles |
| Comparison Matrix | Pit platform against three competing maintenance approaches |
| Vibration Spectrogram | Visualize sensor data competitors cannot match |
| Degradation Curve | Show asset wear progression over time |
| Weibull Distribution | Demonstrate failure probability modeling capability |
| Downtime Cost Calculator | Personalize projected savings with visitor inputs |
| Primary call to action Form | Capture asset count, equipment type, and work email |
| Secondary PDF Offer | Provide gated comparison report for late-stage buyers |
Design & branding system
The visual identity follows a Dynamic Motion theme built on the Monochrome Steel color system. Every design decision reinforces the feeling of a functioning industrial control environment.
- Color palette: forge-black (#111418) backgrounds, brushed-steel mid-gray (#6B7280) for secondary text and inactive states, machined-aluminum light (#D1D5DB) for body text, and signal-green (#00E676) reserved for live indicators and primary calls to action
- Typography uses a monospaced typeface for all metric displays, keeping numbers authoritative and easy to scan at a glance
- Motion design includes subtle waveform animations, horizontal wipe reveals on comparison rows, and real-time counter updates that maintain a sense of continuous system activity without distracting from the content
Mobile & speed optimization
The layout is designed to retain its dashboard clarity across screen sizes. The data-dense header and comparison matrix scale to smaller viewports without losing readability.
- Metric tiles in the header reflow into a scrollable card format on smaller screens
- The comparison matrix collapses into a vertically stacked view so each capability row remains legible
- Animation triggers are tied to scroll position, so motion elements activate only when the relevant section enters view
How this template helps you convert
Every section of this page is sequenced to reduce friction and build confidence before asking for a commitment.
- The live metrics header establishes immediate credibility. Visitors see a platform that is already working, monitoring assets, and generating savings figures before reading a single headline.
- The comparison matrix removes the need for a buyer to evaluate alternatives independently. By the time a visitor reaches the form, every competing approach has been systematically addressed.
- The downtime calculator makes the financial case personal. Visitors arrive at the form having already calculated what inaction costs them specifically, which makes the "Run a Free Asset Assessment" offer feel like the obvious next step.
Other information about this template
This template is part of a broader set of Advanced Tech and AI Platform templates in the Technology category. It is purpose-built for the predictive maintenance platform niche and carries context relevant to industrial operations buyers.
- The template style is Dashboard and Data Grid, matching the control-room aesthetic described in the brief
- The creative direction is Feature Matrix, meaning the core persuasion mechanism is structured competitive comparison rather than narrative storytelling
- The theme is Dynamic Motion, which governs all scroll-triggered animations, waveform pulses, and counter updates throughout the page
- The header concept is Stats and Metrics, placing quantified, real-time data at the very top of the visitor experience
- The landing-page direction is Comparison and Versus, making the page naturally suited to buyers who are actively evaluating options


Theme
Dynamic Motion
Creative direction
Feature Matrix
Color system
Monochrome Steel
Style
Dashboard/Data Grid
Direction
Comparison/Versus
Page Sections
Live Metrics Dashboard Header
Animated Feature Comparison Matrix
Full-width Data Visualizations
Dynamic Downtime Cost Calculator
Dual-path Conversion Form
Signal-green Accent System
Related questions
Who is this template designed for?
Can I update the metric tiles in the header dashboard?
How does the downtime cost calculator function?
What is the secondary PDF download path for?
Can I edit the rows in the comparison matrix?


