
Tracking competitor ad spend across LinkedIn, Meta, and Google is one of the hardest problems in digital marketing. Most teams lose hours to manual checks and still miss the shifts that matter. Rocket.new's Intelligence feature monitors competitor ad activity across platforms continuously, connecting budget signals to strategy changes automatically.
What would you do differently if you could see exactly where your competitors shift spend between Google Ads, Facebook, and LinkedIn every single week? Most teams would change their entire approach to paid ads overnight.
The competitive intelligence tools market grew from $482 million in 2024 and is on pace to hit $1.85 billion by 2035, which shows how fast businesses are investing in this problem. The issue is that tracking competitor ad spend across multiple platforms still takes most teams hours of manual work, and the data they collect rarely connects into a clear picture.
Why Tracking Competitor Ad Spend Across Ad Platforms Gets Complicated Fast
Each Platform Reports Data Differently
-
Google Ads uses your account's time zone. Facebook uses the time zone where your ad accounts were created. LinkedIn uses UTC unless you manually change it.
-
When you pull data exports for the same month, you end up with three different date ranges from three different ad platforms.
-
What Facebook calls "Amount Spent" includes charges that the cost metric in Google does not. The total spend number on LinkedIn is different from "Amount Spent." These mismatches inflate results and make it hard to compare spending across channels.
The real challenge is not collecting data. The real challenge is that each platform defines spend, conversions, and performance data differently, and most platforms do not make reconciliation easy. Any system that tries to compare competitor ad spend across these platforms has to normalize these differences before the numbers mean anything.
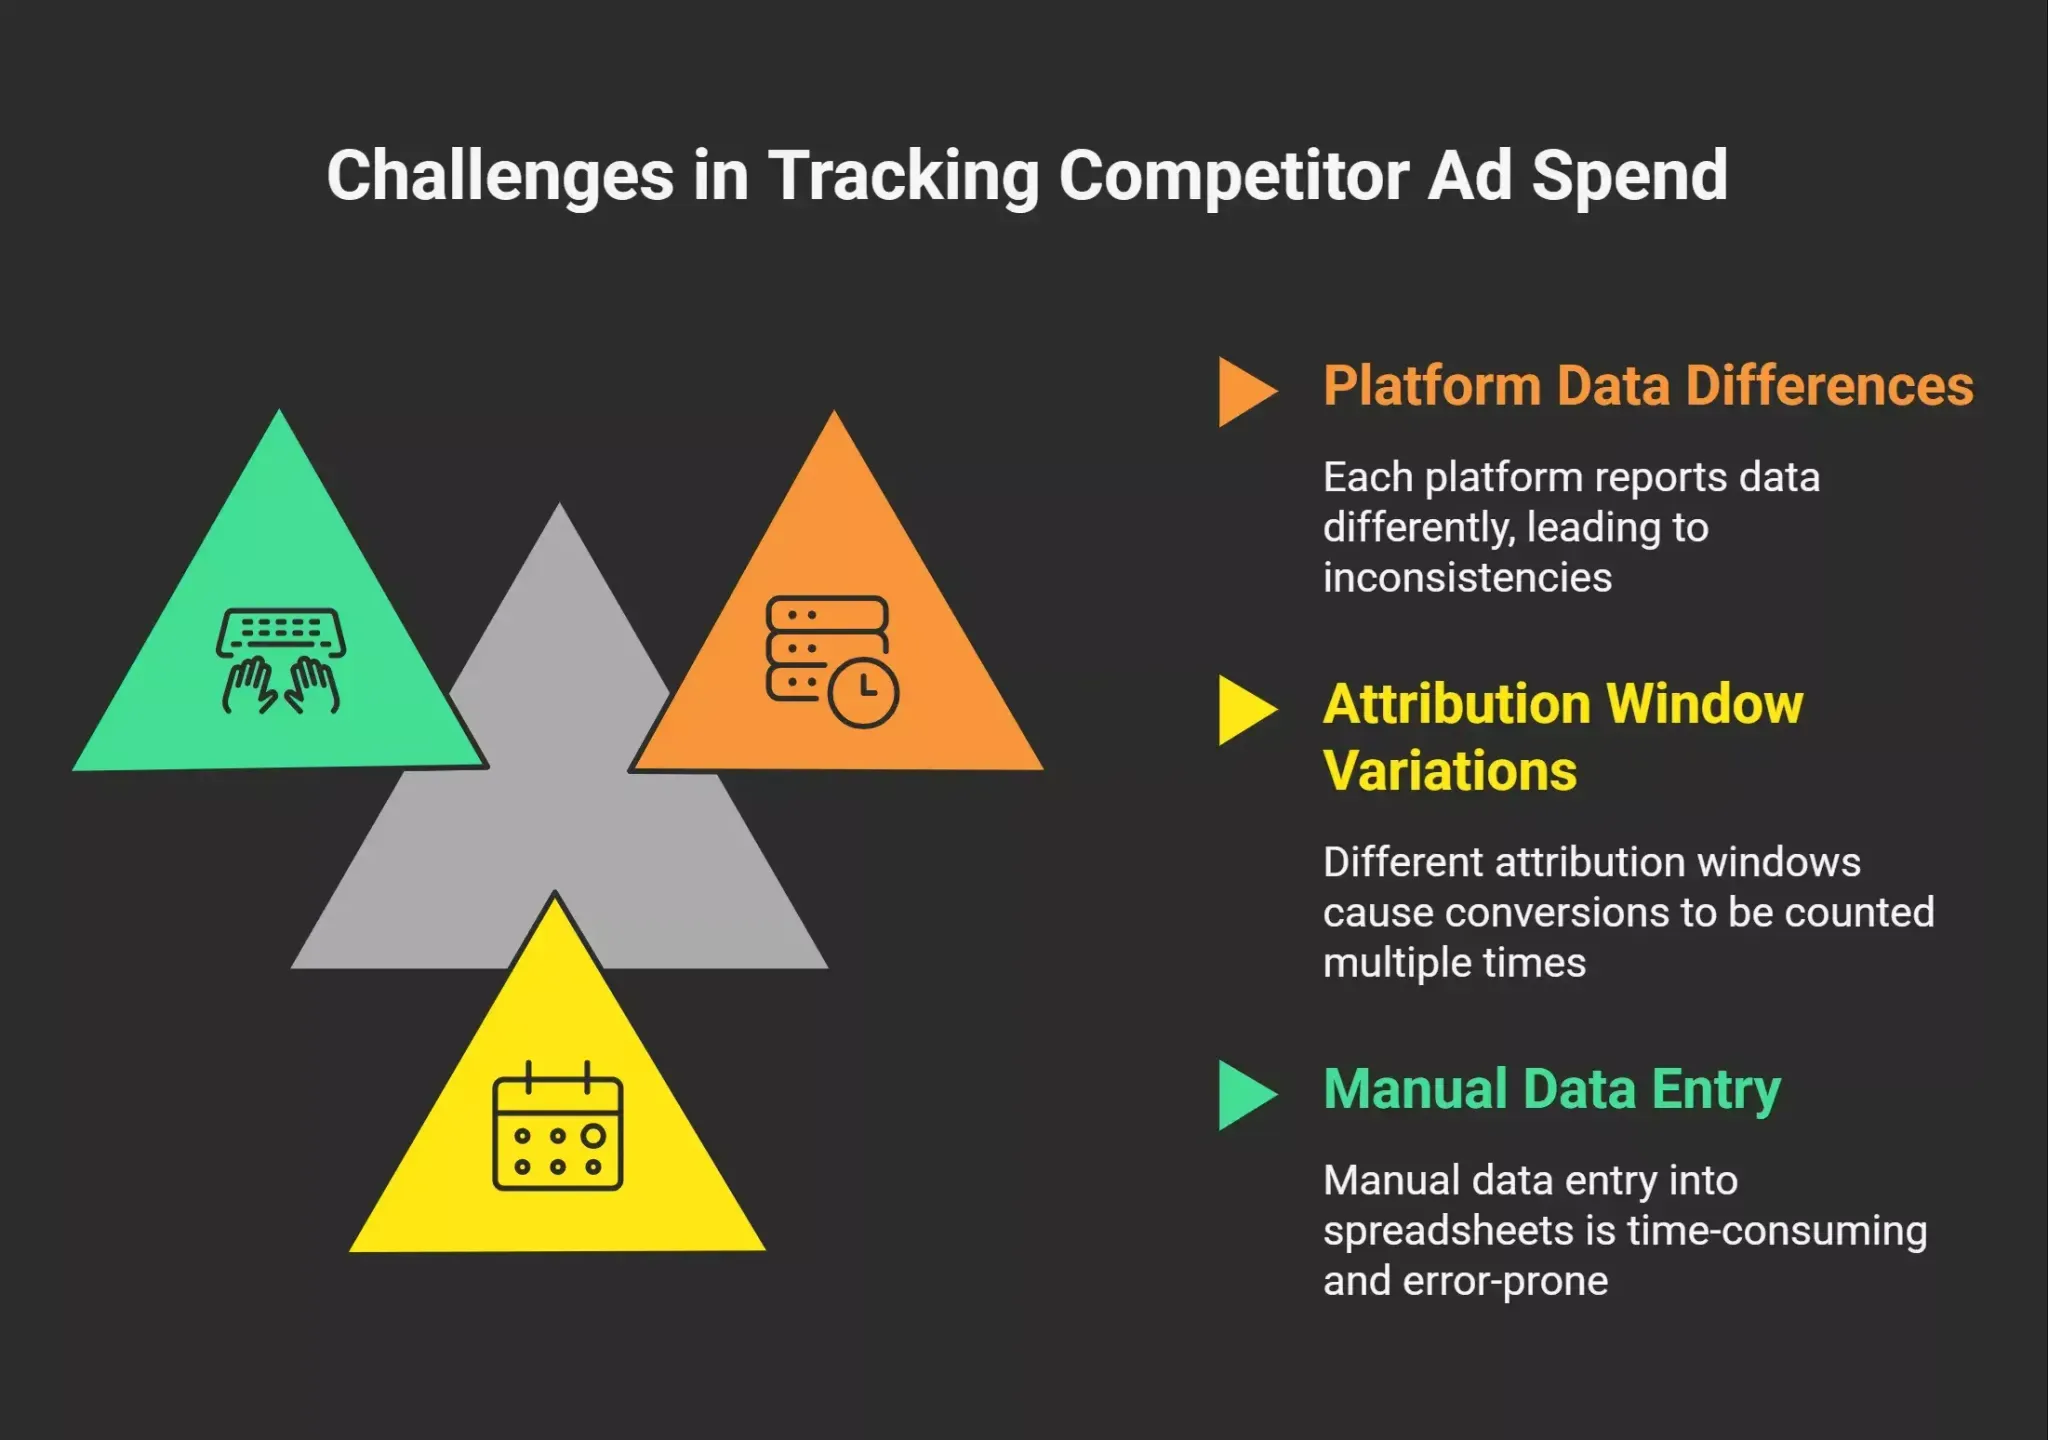
Attribution Windows Break Comparisons
-
Google Ads defaults to a 30-day click attribution window. Facebook uses a 7-day click, 1-day view window. LinkedIn lets you pick, but most teams leave the defaults untouched.
-
A lead who clicks an ad on LinkedIn on Monday, visits your landing pages on Wednesday, and converts through a Google search on Friday gets counted as a conversion on all three platforms. That one conversion shows up three times in your reporting.
-
For businesses with longer sales cycles, especially in B2B lead generation, the gap between attribution windows grows even wider. A deal that takes 90 days to close falls outside most tracking windows entirely, hiding the actual revenue connected to that ad spend.
The Manual Google Sheets Trap
-
Most marketers spend between 8 to 12 hours monthly copying data from different ad platforms into spreadsheets, only to find discrepancies when numbers do not match up.
-
Agencies managing multiple clients across Google Ads and Facebook multiply that time by every client. A team with 10 clients can burn 80 to 120 hours per month on data collection alone.
-
Google Sheets and Looker Studio dashboards help with visualization, but they still require someone to gather data, clean it, and reconcile the numbers before anyone can act.
The money lost is not just in the hours. It is in the decisions that get delayed while the team waits for a clean report.
What Most Teams Do to Track Competitor Ads (And Where It Breaks)
Checking Ad Libraries One at a Time
-
Meta, Google, and LinkedIn all provide public ad libraries that let you see competitors' ads. The Meta Ad Library shows active Facebook and Instagram campaigns. The Google Ads Transparency Center shows search and display ads. The LinkedIn Ad Library shows sponsored content.
-
These libraries give you free advertising research on what messaging and offers rivals run in your market. You can spot which video ads, carousel formats, and page links they use.
-
The problem: each ad library is a separate place. Checking four competitors across three platforms means 12 manual searches per week. Most teams stop doing it after the first month.
Pasting Data Into Spreadsheets
-
Most marketers copy numbers from each platform, paste them into a shared Google Sheets file, and try to compare competitor spend week over week.
-
Conversion data from Google Ads rarely matches conversion data from Facebook because of different tracking pixels, different attribution windows, and different definitions of what counts as a conversion.
-
The result is a spreadsheet full of numbers that disagree with each other, which means the team spends more time debating the data than acting on it.
Falling Back on Gut Feel Over Real Numbers
-
When the data is messy, most teams fall back on gut feel. They move ad budgets based on what "seems" to work, not based on what the numbers show.
-
This is where wasted spend piles up. Without clean, cross-channel conversion data, you cannot tell if a competitor's move to video ads on Facebook signals a real change or just a creative testing cycle.
-
Agencies running campaigns for multiple clients feel this even harder. Every client expects data-backed recommendations, but the approach most teams use to deliver them is held together with manual exports and guesswork.
What Cross-Platform Competitor Ad Tracking Actually Requires
Continuous Monitoring Across Meta Ads, Google Ads, and LinkedIn
-
A working approach monitors ads from rivals across all three platforms continuously, not once a month.
-
That means checking for new creatives, updated landing pages, changes in ad copy, and shifts in targeting every day.
-
Ads that remain live for extended periods indicate campaigns that work. A Facebook ad running for six weeks straight tells you more about a competitor's confidence than any single metric.
Connecting Spend Shifts to Changes in Direction
-
Tracking ads alone is not enough. The shift that matters is when a competitor moves spend from one marketing channel to another.
-
If a competitor cuts Google Ads spend and increases their ad spend on Meta in the same week, that is a deliberate decision. If they launch LinkedIn Ads for lead generation at the same time, the picture gets clearer: they are moving upmarket toward B2B.
-
To detect these shifts, you need a system that analyzes frequency caps, impression share, impression spikes, and how long ads run. These proxy signals reveal where competitors shift budget without needing access to their ad accounts.
Mapping the Entire Journey From Ad to Revenue
-
The best competitor ad spend analysis connects ad activity to business outcomes. When a competitor launches a cold email campaign alongside a new ad strategy on Meta and a landing page redesign, those signals together tell you more than any one data point alone.
-
For e-commerce businesses, tracking competitor pricing changes alongside their ad spend reveals whether they are running a margin play or a volume play. Budget allocation between paid search and social tells you which revenue stream they prioritize.
-
For B2B companies with longer sales cycles, connecting ad activity to hiring patterns and product updates shows whether the competitor is investing in growth or running maintenance campaigns.
Ad Spend Tracking Metrics That Reveal Competitor Focus
| Metric | What It Tells You | Where to Find It |
|---|---|---|
| Ad longevity (days active) | Which campaigns do competitors keep funding | Meta Ad Library, Google Ads Transparency Center |
| Creative rotation frequency | How fast competitors test new ads | Manual tracking or automated monitoring |
| Share of spend across platforms | Where competitors put most ad dollars | Cross-platform tracking tools |
| Landing page changes | Messaging shifts and offer testing | Website monitoring tools |
| New format adoption (video ads, carousel) | Creative direction | Ad library reviews |
| Targeting shifts (B2B vs B2C signals) | Audience focus changes | Ad libraries, job posting analysis |
| Sponsored content volume | LinkedIn investment signals | LinkedIn Ad Library |
| Impression share trends | Paid search competitiveness | Google Ads Auction Insights |
Each of these metrics tells part of the story. A competitor increasing ad longevity on Google while rotating creatives faster on Facebook is signaling that Google drives their baseline revenue, and Facebook is their testing ground.
How Agencies Manage Tracking Ad Spend for Multiple Clients
Working Across Multiple Channels
-
Digital marketers at agencies manage paid ads across Google, Facebook, LinkedIn, and other platforms for every client. Each client has separate ad accounts, separate conversion tracking, and separate reporting needs. Running LinkedIn Ads alongside Google and Facebook means tripling the number of dashboards the team needs to check.
-
Spending $99 per month on automation can save 8 hours of work, which equals roughly $400 in saved time at a $50 per hour rate. For agencies, those savings multiply across every client.
-
The pricing of tracking tools matters, but the real cost is the hours lost to manual reporting. An agency that can export data automatically and push it into Looker Studio frees up budget for actual campaign work and market research.
Replacing Manual Reporting With Scalable Systems
-
Most teams start with Google Sheets. As the client list grows, they move to Looker Studio or Power BI. Smarter agencies build an automated system that pulls from all platforms into a single view and generates reports automatically.
-
The shift from manual to automated tracking changes what a team can focus on. Instead of spending Monday mornings copying numbers, the team reviews competitor moves and adjusts their ad strategy the same day.
-
Budget decisions get faster when performance data flows in automatically. For agencies handling performance marketing across e-commerce, SaaS, and lead generation clients, this system becomes their operational competitive advantage.
Using Ad Libraries as Free Advertising Research
What You Can Learn Without Spending a Dollar
-
Meta, Google, and LinkedIn provide ad libraries that let anyone see competitors' ads for free. These are public databases of ads that show creatives, ad copy, and in some cases, alternative text description details and targeting parameters.
-
Competitor ad libraries reveal which offers resonate, what messaging competitors test, and which formats they invest in most. Ads running for months signal what competitors are willing to keep funding.
-
For performance marketing teams, this data replaces hours of guesswork. Instead of assuming what competitors do, you see it directly.
What Ad Libraries Cannot Tell You?
-
No ad library shows you actual revenue from a campaign, conversion rate by audience, or the true cost per click. You see the creative, but not the revenue data behind it.
-
Most platforms do not show spend amounts either. You have to estimate total spend by looking at how long ads run, how many variations a competitor tests, and engagement signals on each creative.
-
This is where most teams hit a wall. They can see what competitors run, but they cannot connect the dots between a competitor's Facebook ads, their Google campaigns, and their LinkedIn activity in one view.
Creative Testing and Tracking Which Competitor Ads Run Longest
Why Ad Longevity Is the Best Free Spend Signal
-
A competitor running the same ad for 60 days is telling you something the ad library does not show explicitly: that ad is profitable enough to keep funding.
-
Tracking which ads survive longest across channels gives you a proxy for which campaigns drive revenue. Short-lived ads usually mean failed tests. Long-running ads mean a proven winner.
-
By monitoring creative rotation and longevity across Facebook, Google, and LinkedIn, you build a picture of what works without needing direct access to ad accounts or revenue data.
Spotting Format Shifts and Engagement Signals
-
When several competitors start running video ads at the same time, that is an engagement signal, not a coincidence.
-
Tracking format adoption in the market helps you decide where to focus before things get crowded. If three competitors launch carousel ads on Facebook in the same week, that format is likely performing well.
-
Description metadata in competitor creatives also reveals audience targeting intent, since the images and their context reflect which viewers each competitor wants to reach.
What Digital Marketers Are Saying
"It is clear that advertising dollars are not only shifting to a variety of digital platforms, but that competitive ad intelligence now needs to be approached in a very holistic manner. The industry can no longer look at ad activity in a specific channel as a silo. It has to be analysed in a cross-platform integrated manner." - Andy Brown, Chairman and CEO, Kantar Media
This captures the core frustration many marketers share. Checking each platform separately gives you puzzle pieces. Connecting those pieces into one view is where tracking turns into competitive advantage.
How Rocket.new Tracks Competitor Ad Spend Across LinkedIn, Meta, and Google
How does Rocket.new track competitor ad spend on LinkedIn, Meta, and Google simultaneously and connect the shifts?
Rocket.new runs a continuous tracking loop across LinkedIn, Meta, and Google by accessing public ad transparency tools like the Meta Ad Library, Google Ads Transparency Center, and LinkedIn Ad Library. The Intelligence platform uses AI-powered monitoring to extract visual creatives, headlines, and landing page destinations from campaigns across platforms, and feeds everything into a single stream.
So instead of checking three ad libraries manually, Rocket pulls all competitor ad activity into one view and connects the signals automatically.
What Rocket.new's Intelligence Feature Monitors
-
Ads across Facebook, Google, and LinkedIn are updated continuously
-
Variations in media formats, hooks, headlines, and landing pages
-
Spend shift signals through frequency caps, impression spikes, and ad longevity patterns
-
Creative types, target demographics, and longest-running ads to identify what competitors keep funding
-
Website updates, hiring patterns, pricing changes, and product updates, alongside ad activity
Rocket maps how competitors allocate their budget between demand creation (awareness ads) and demand capture (conversion ads). When a competitor shifts from cold email outreach to paid ads, the system flags that change and connects it to other signals like new job postings or pricing page updates. The AI evaluates ad movements alongside external indicators, giving teams a contextual view of what competitors actually do with their advertising dollars.
Rocket generates synthesized strategy briefs that analyze competitor shifts and suggest immediate response tactics. These actionable insights arrive before the workday starts, delivered inside the platform, to email, or to WhatsApp.
Use Cases for Tracking Competitor Ad Spend With Rocket
-
Spotting a competitor's channel shift early. A SaaS company notices through Rocket Intelligence that a competitor doubled their LinkedIn spend while cutting Google Ads. The competitor also posted three new enterprise sales roles. Rocket connects these signals: the competitor is moving upmarket. The team adjusts targeting and cold email messaging before the competitor's campaigns even ramp up.
-
Catching a pricing play before it hits your pipeline. An e-commerce brand sees a competitor running landing page tests alongside heavy Facebook ad spend on discount offers. Rocket flags the pricing page change and the ad creative shift together. The team responds with a counteroffer campaign the same week.
-
Replacing manual competitor checks with automated briefs. Instead of spending hours checking ad libraries and logging findings in spreadsheets, Rocket automates the entire tracking process and delivers a daily brief covering what moved, what it means, and what to do about it.
-
Feeding competitor data into conversion optimization. When Rocket shows that a competitor is running high-volume Google Ads campaigns with a specific cost per conversion target, the team can reverse-engineer their approach. Use the historical data from Rocket's tracking to see how competitor ad patterns correlate with market shifts over time, and adjust your own ad strategy based on what actually moves the market.
Making Competitor Ad Spend Data Drive Revenue
The question behind every ad tracking effort is simple: does knowing what competitors spend actually help you make money?
It does when the data connects across platforms instead of sitting in separate spreadsheets. Businesses that can optimize campaigns based on what competitors do, rather than reacting late, close the gap between spend and actual revenue faster.
Tracking competitor ad spend is not a reporting exercise. It is a revenue exercise. And the teams that treat it that way, using a system that automates tracking and connects signals across every marketing channel, spend less time on data and more time on budget decisions and ad strategy that drive revenue.
Ready to stop guessing and start tracking? Sign up for Rocket.new and set up your first competitor intelligence monitor today.
Table of contents
- -Why Tracking Competitor Ad Spend Across Ad Platforms Gets Complicated Fast
- -Each Platform Reports Data Differently
- -Attribution Windows Break Comparisons
- -The Manual Google Sheets Trap
- -What Most Teams Do to Track Competitor Ads (And Where It Breaks)
- -Checking Ad Libraries One at a Time
- -Pasting Data Into Spreadsheets
- -Falling Back on Gut Feel Over Real Numbers
- -What Cross-Platform Competitor Ad Tracking Actually Requires
- -Continuous Monitoring Across Meta Ads, Google Ads, and LinkedIn
- -Connecting Spend Shifts to Changes in Direction
- -Mapping the Entire Journey From Ad to Revenue
- -Ad Spend Tracking Metrics That Reveal Competitor Focus
- -How Agencies Manage Tracking Ad Spend for Multiple Clients
- -Working Across Multiple Channels
- -Replacing Manual Reporting With Scalable Systems
- -Using Ad Libraries as Free Advertising Research
- -What You Can Learn Without Spending a Dollar
- -What Ad Libraries Cannot Tell You?
- -Creative Testing and Tracking Which Competitor Ads Run Longest
- -Why Ad Longevity Is the Best Free Spend Signal
- -Spotting Format Shifts and Engagement Signals
- -What Digital Marketers Are Saying
- -How Rocket.new Tracks Competitor Ad Spend Across LinkedIn, Meta, and Google
- -What Rocket.new's Intelligence Feature Monitors
- -Use Cases for Tracking Competitor Ad Spend With Rocket
- -Making Competitor Ad Spend Data Drive Revenue