AdTech Startup Cost Calculator Website Template
Catalyst is a dashboard-style adtech landing page built for growth-stage programmatic platforms. It opens with a live CPM and ROAS calculator that shows visitors their projected savings before asking for anything. A side-by-side comparison grid, case-study data wall, and integration network map work together to build trust and drive audit request conversions.
by Rocket studio
Quick summary
Catalyst is a single-page adtech landing page template designed around a Calculator/Tool First creative direction. The hero is an interactive CPM and ROAS estimator that personalizes the pitch the moment a visitor lands. Every section below deepens that argument with live comparison grids, client data cards, and a glowing integration map, all styled in a dark, information-dense Data Command visual theme.
Who this template is for
This template is built for growth-stage adtech platforms that sell to sophisticated, data-driven buyers. If your product lives in the programmatic advertising space and your prospects already know what bid latency and cost-per-mille (CPM) mean, this template speaks their language directly.
- Performance marketing directors at direct-to-consumer brands spending six figures monthly on paid media
- Agency trading desk teams managing multiple demand-side platforms simultaneously
- Growth leads at Series B startups who need transparent, real-time decisioning they can audit
What problem this template solves
Most adtech landing pages describe their product in abstract terms. Buyers in this space need proof, not promises. They want to see their own numbers, compare platform capabilities side by side, and understand fees before booking a call.
- Generic hero sections fail to engage buyers who already understand programmatic advertising deeply
- Static pages cannot show personalized projected savings or efficiency gains without an interactive tool
- Conversion paths that ask for a meeting before delivering value lose skeptical, analytically minded prospects
What you get with this template
This template delivers a complete, conversion-ready landing page structured around four core content zones. Each zone is designed to advance trust progressively, from a personalized calculator result to a request for a full audit.
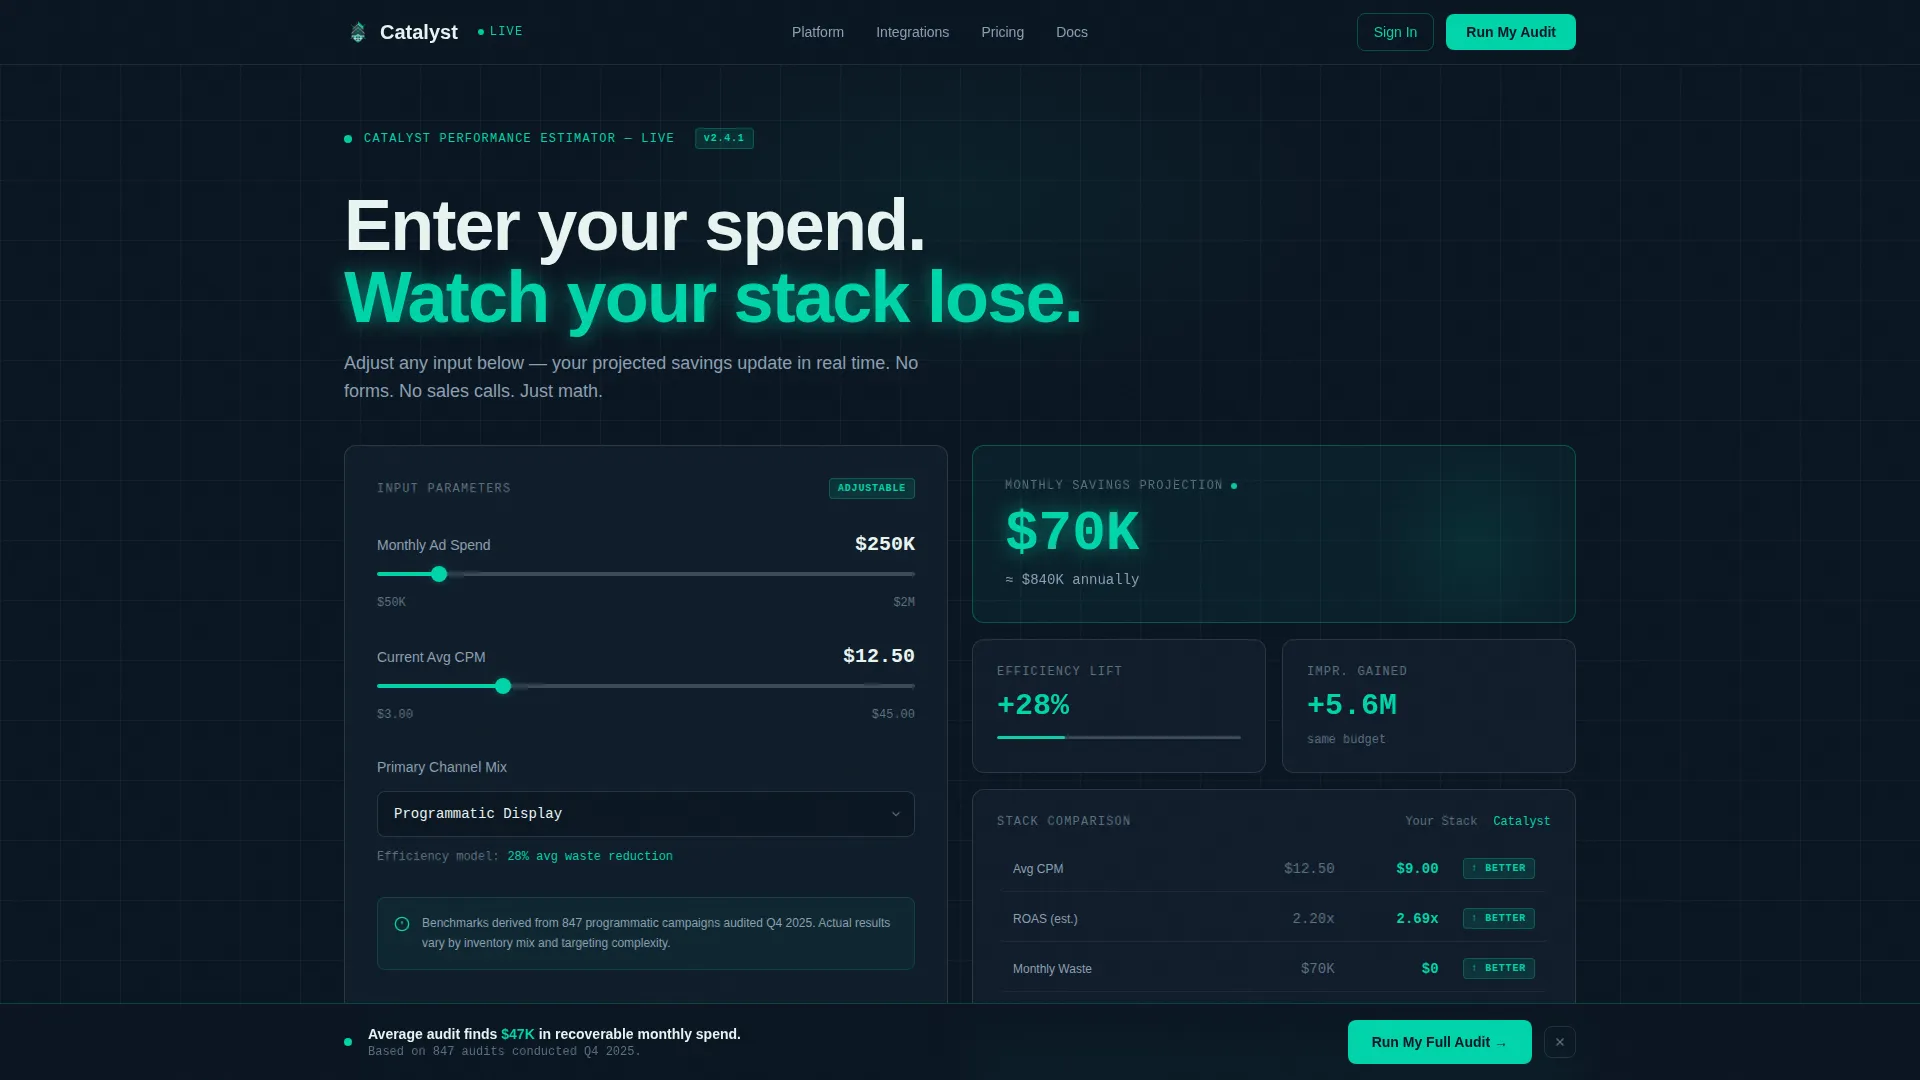
- An above-the-fold interactive calculator with animated output fields showing projected savings and efficiency lift
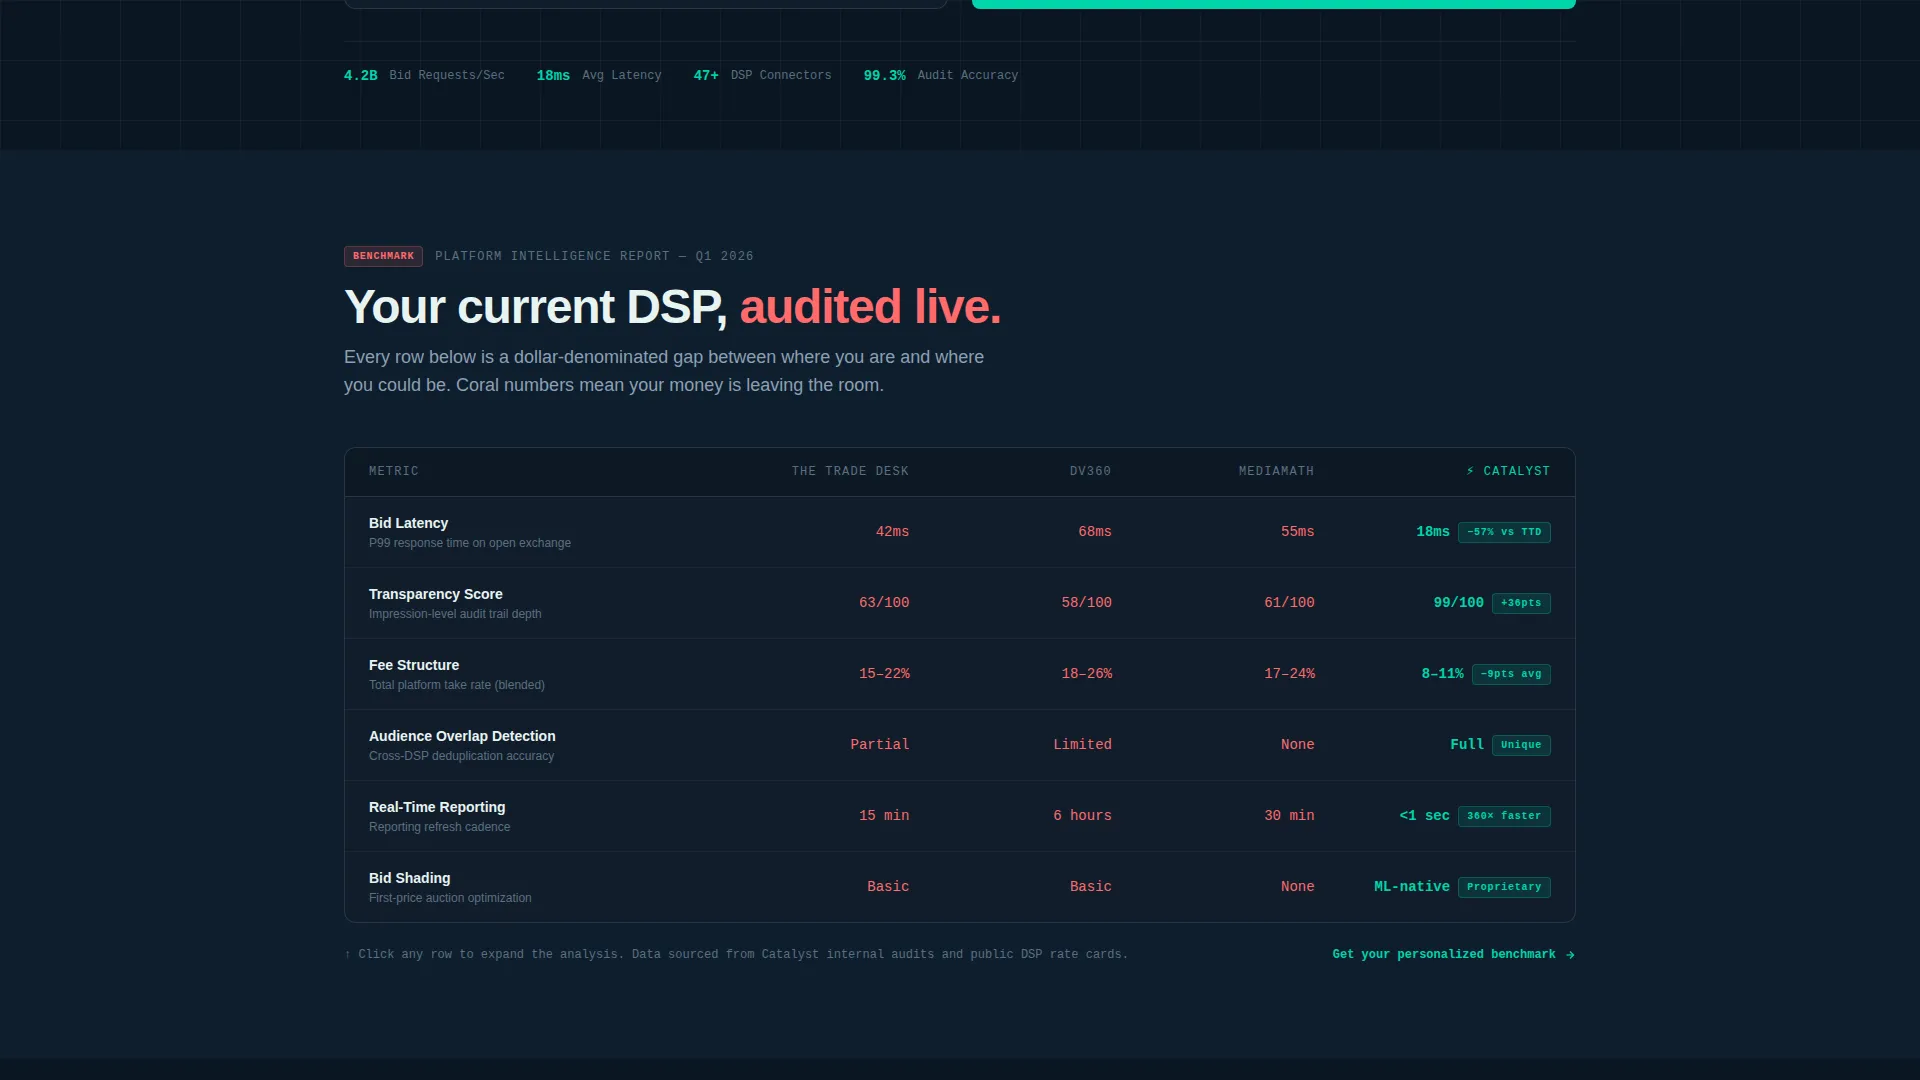
- A live platform comparison grid with teal checkmarks and coral gap indicators across key capability rows
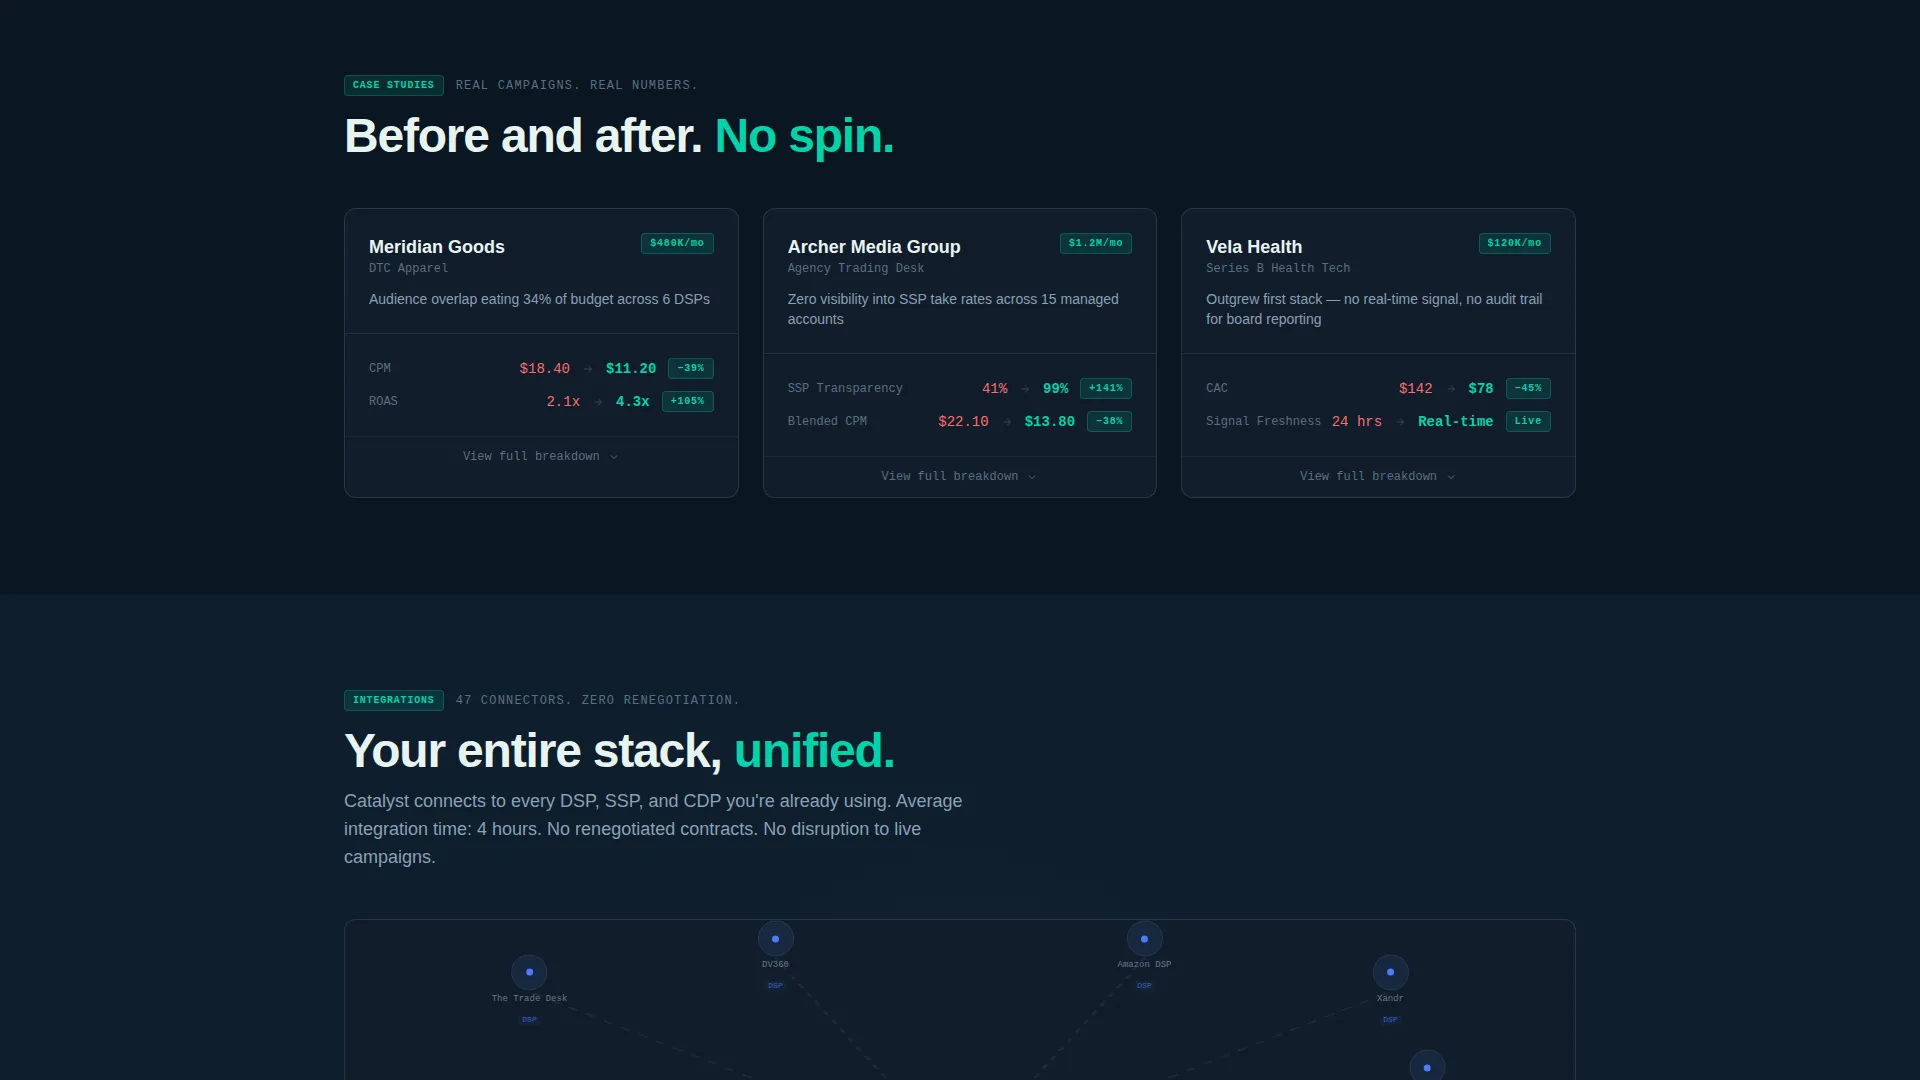
- Three expandable case-study cards and a visual integration network diagram showing connected data sources
Feature list
This template includes six purpose-built sections that work as a layered argument. Each one earns the visitor's attention before the next one asks for more.
Interactive CPM and ROAS Calculator
The hero section loads as a dark card with three input fields: monthly ad spend via slider, current average CPM, and primary channel mix via dropdown. The right half animates with projected savings and efficiency lift the moment any input changes. Numbers tick upward in electric teal, making the value visible before a single word of body copy is read.
Side-by-Side Platform Comparison Grid
Section two is a structured grid comparing bid latency, transparency score, fee structure, audience overlap detection, and real-time reporting. Each row shows typical current-platform performance against Catalyst. Teal checkmarks mark advantages and coral indicators flag gaps, making the competitive differential impossible to miss.
Expandable Case Study Data Wall
Three client cards each display before-and-after dashboard metrics with actual metric movements. Each card is expandable so visitors can go deeper without leaving the page. The format mirrors the data-dense visual language buyers already use inside their own reporting tools.
Glowing Integration Network Map
Section four renders every connected demand-side platform (DSP), supply-side platform (SSP), and customer data platform (CDP) as nodes in an animated network diagram. The visual communicates ecosystem depth without a single line of explanatory text.
Progressive Two-Step Audit Form
The primary call to action is "Run My Full Audit." The form opens with work email and monthly spend, pre-filled from the calculator. The second screen asks for current platform and biggest pain point via dropdown. This structure reduces friction at entry and gathers qualification data before the second screen appears.
Sticky Bottom Conversion Bar
After a visitor scrolls past 40 percent of the page, a persistent bottom bar appears carrying the primary call to action. A secondary path offers a downloadable benchmark report gated behind email-only capture for visitors who are not ready to request an audit.
Page sections overview
| Section | Purpose |
|---|---|
| Calculator Hero | Personalizes value immediately with live CPM and ROAS output |
| Comparison Grid | Shows platform gaps using teal and coral row indicators |
| Case Study Wall | Proves results with before-and-after client metric cards |
| Integration Map | Displays connected DSP, SSP, and CDP nodes visually |
| Audit call to action Form | Captures qualified leads through a two-step progressive form |
| Sticky Bottom Bar | Keeps the primary and secondary calls to action visible after 40% scroll |
Design & branding system
The visual theme is Data Command, built on a dark palette that feels like a professional trading terminal redesigned for readability. Depth comes from layered backgrounds rather than imagery, and every interactive state is deliberately distinct.
- Core palette: deep terminal black (#0B1622) for backgrounds, electric teal (#00D4AA) for interactive states and positive metrics, muted slate (#3A4A5C) for secondary containers and data rows, and hot coral (#FF6B6B) reserved exclusively for delta indicators and cost-spike alerts
- Typography uses monospaced fonts inside data cells for scannability and geometric sans-serif for all body and heading copy
- Teal governs hover glows and upward metric animations; coral appears only when something demands immediate attention
Mobile & speed optimization
The template is structured to scale cleanly from desktop to smaller screens without losing the data-dense visual language that makes it effective. The dark layered background system and grid-based layout adapt well across viewport sizes.
- The calculator inputs, comparison grid rows, and case-study cards are structured for vertical stacking on narrower screens
- The sticky bottom bar remains functional on mobile, keeping the primary call to action accessible throughout the scroll experience
How this template helps you convert
This landing page is engineered around a give-first conversion logic. Visitors receive personalized, data-backed value before any form appears. By the time the call to action is visible, trust has already been built through the visitor's own projected numbers.
- The interactive calculator shows personalized projected savings above the fold, creating immediate relevance before any product claims are made
- The comparison grid and case-study wall layer in social proof and competitive evidence progressively, deepening conviction as the visitor scrolls
- The two-step audit form and sticky bottom bar close the loop by keeping the conversion path clear without overwhelming visitors who are still evaluating
Other information about this template
This template is categorized under Startup and Launch, specifically within the adtech growth-stage startup niche. It is designed to support a Comparison/Versus landing page direction, where the product is positioned against known incumbent platforms through structured side-by-side evidence.
- Template style is Dashboard/Data Grid, making it well-suited for adtech, martech, and data platform products where the audience is analytically fluent
- The color system is named Teal Catalyst and the creative direction is Calculator/Tool First, meaning the interactive estimator is the primary trust-building mechanism, not hero copy or imagery
- The header concept is a Calculator/Estimator rather than a traditional hero, which differentiates this template from standard startup landing page layouts

Theme
Data Command
Creative direction
Calculator/Tool First
Color system
Teal Catalyst
Style
Dashboard/Data Grid
Direction
Comparison/Versus
Page Sections
Interactive CPM and ROAS Calculator Hero
Live Platform Comparison Grid
Expandable Case Study Data Wall
Animated Integration Network Diagram
Progressive Two-step Audit Form
Sticky Conversion Bar with Dual Call to Action Paths
Related questions
Who is this landing page template designed for?
Can I customize the calculator inputs for my platform's metrics?
What conversion paths does this template support?
Does the template include placeholder client case study content?
Is this template appropriate for a non-programmatic adtech product?