D2C Series A Investor Landing Page Template
Traction is a scroll-reveal landing page built for growth-stage direct-to-consumer brands raising Series A capital. It leads with live-feel metric panels, animated data visualizations, and a conviction-building investor flow. The Dashboard Pro theme uses Electric Indigo colors to make every KPI glow. Two gated lead capture paths turn serious investor interest into booked conversations.
by Rocket studio
Quick summary
Traction is a single-page investor landing page designed for direct-to-consumer brands at the Series A stage. It replaces the traditional pitch deck with an animated, data-forward scroll experience. Every section loads progressively, revealing KPIs, charts, and unit economics in sequence. Two lead capture paths collect investor details at peak conviction moments.
Who this template is for
This template is built for operator-founders who know their numbers cold and need a fast, credible way to earn investor attention before a single PDF is opened. It suits brands that have proven product-market fit and are now building the case for scale.
- Direct-to-consumer brand founders preparing a Series A raise
- Growth operators who want to lead with data rather than narrative
- Founding teams replacing a static pitch deck with a living, scrollable investor page
What problem this template solves
Most investor outreach relies on emailed slide decks that arrive cold and compete with hundreds of others. A scrollable landing page lets your unit economics do the convincing before any meeting is scheduled. The template removes the friction between "I saw your link" and "I want to see the full deck."
- Investors skim and move on when decks feel generic or unverifiable
- Founders lose momentum when conviction builds slowly across disconnected formats
- A single link that presents metrics, cohort data, and a clear call to action closes that gap immediately
What you get with this template
You get a fully structured, single-page investor experience built around progressive data disclosure. Each scroll trigger reveals a new module in a deliberate sequence designed to build belief before the ask.
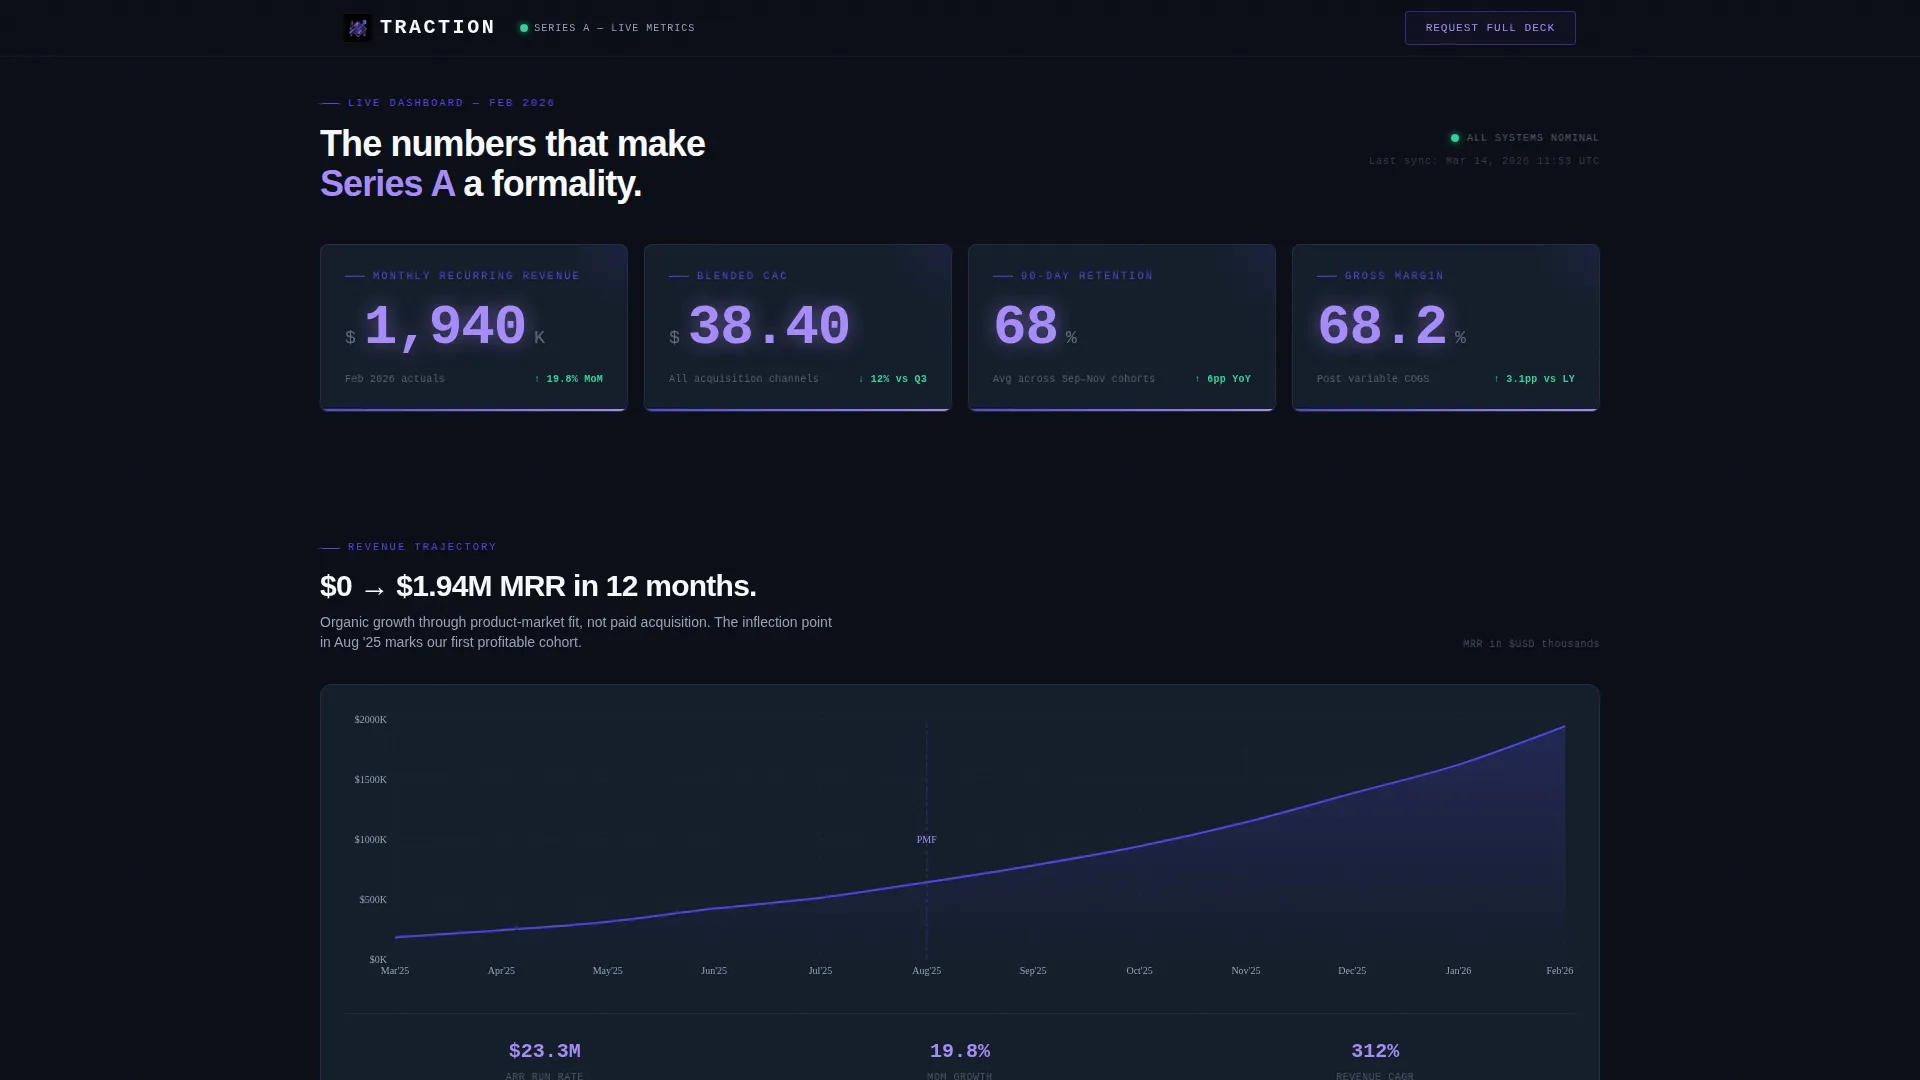
- Four hero metric panels in the header: monthly recurring revenue, customer acquisition cost (CAC), 90-day retention curve, and gross margin percentage
- Animated data visualizations including an area chart, a stacked bar chart, and a cohort retention heatmap that illuminate row by row on scroll
- Two gated lead capture paths: a full deck request modal and a one-pager download gated by email only
Feature list
This section details the core built-in capabilities delivered with the Traction template.
Dark Glass Panel Header
Four translucent, frosted-glass metric cards are arranged in a staggered grid against a void-black background. Each card displays one hero KPI in a large monospaced typeface with a micro-animated counter that ticks upward on page load. The effect is immediate and unmistakable: your numbers command attention before a single word is read.
Progressive Scroll Reveal Flow
Each section of the page is triggered by scroll position, materializing in sequence like a pitch deck unfolding without slides. Revenue trajectory appears first, followed by unit economics, channel mix, and cohort retention. This structure guides the investor through a deliberate conviction arc from first metric to final call to action.
Animated Area Chart Module
The revenue trajectory section features an animated area chart that fills left to right in an indigo gradient as it enters the viewport. It visualizes growth momentum in a single, readable sweep that communicates trajectory faster than a table of figures.
Unit Economics Card Group
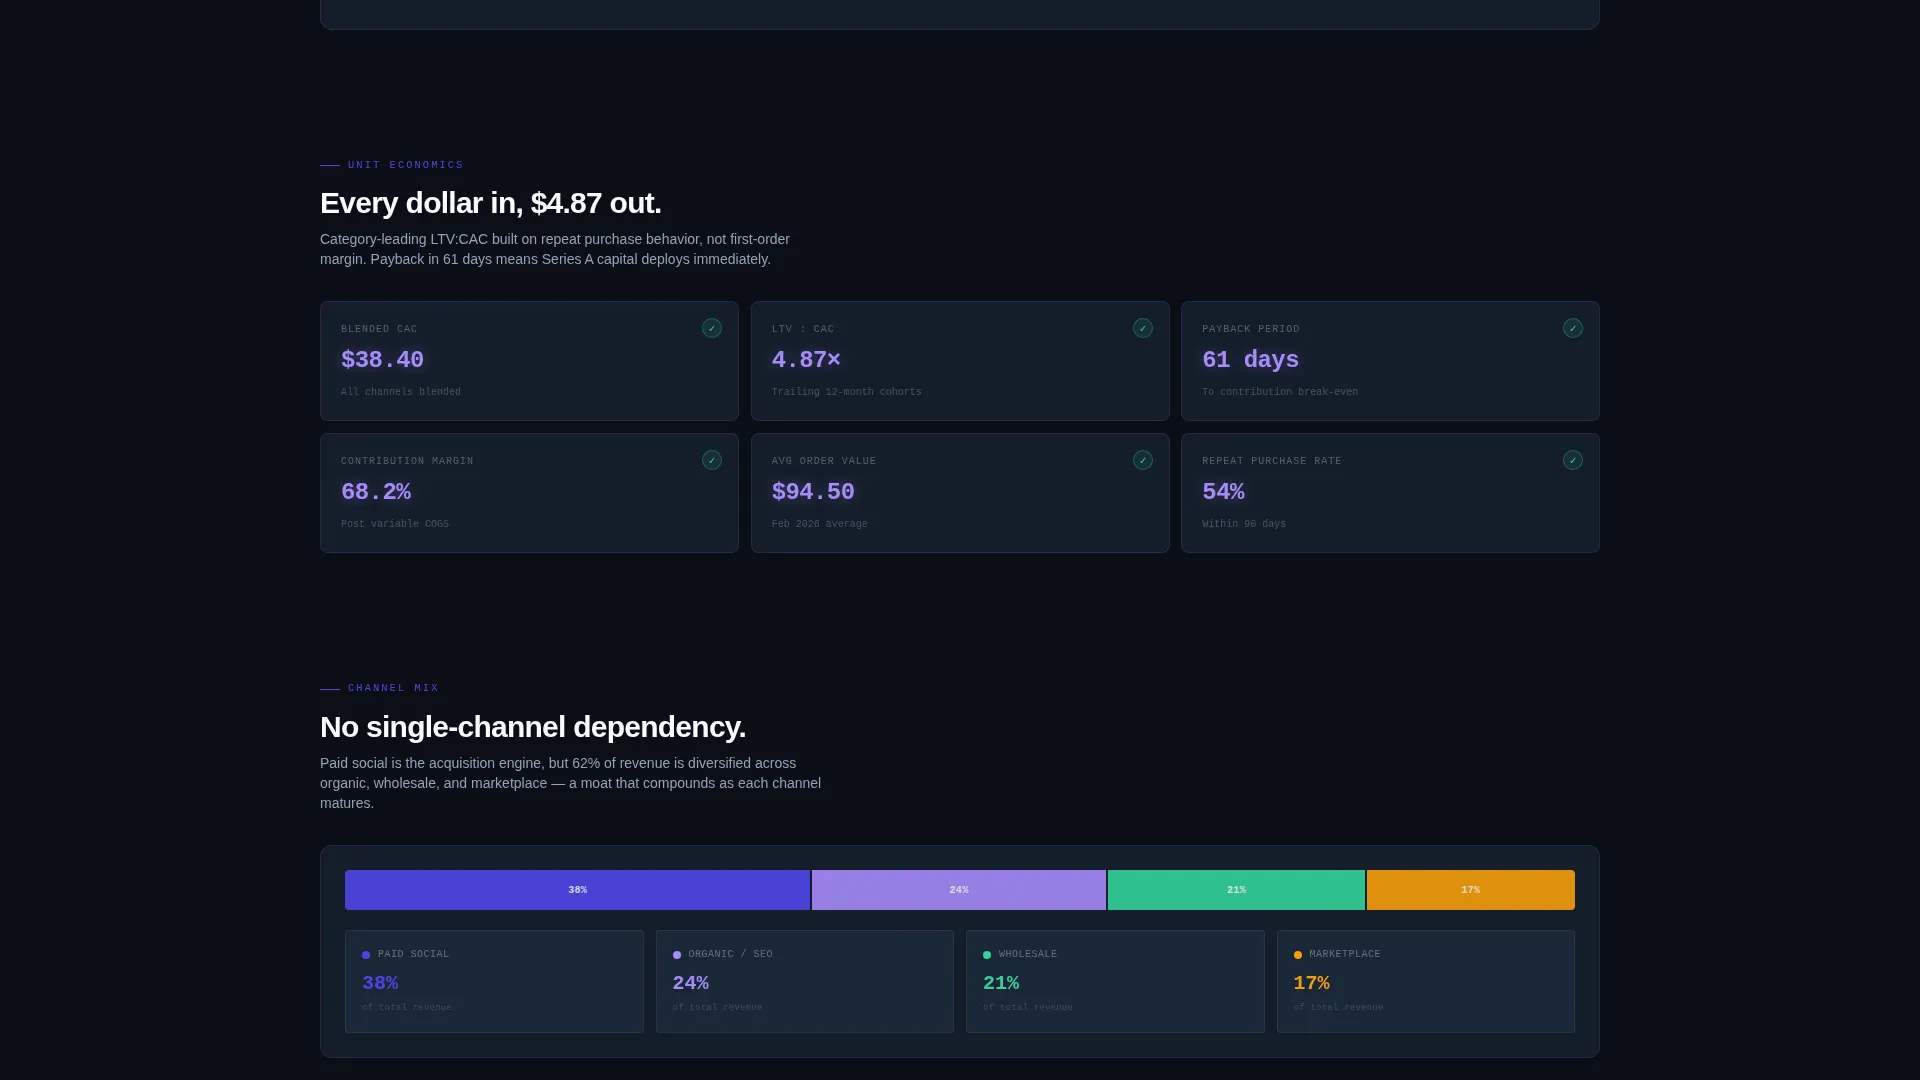
A grouped card module presents blended CAC, payback period, and contribution margin side by side. Each number snaps into place with a departures-board animation, giving the data a sense of live precision that static decks cannot replicate.
Cohort Retention Heatmap
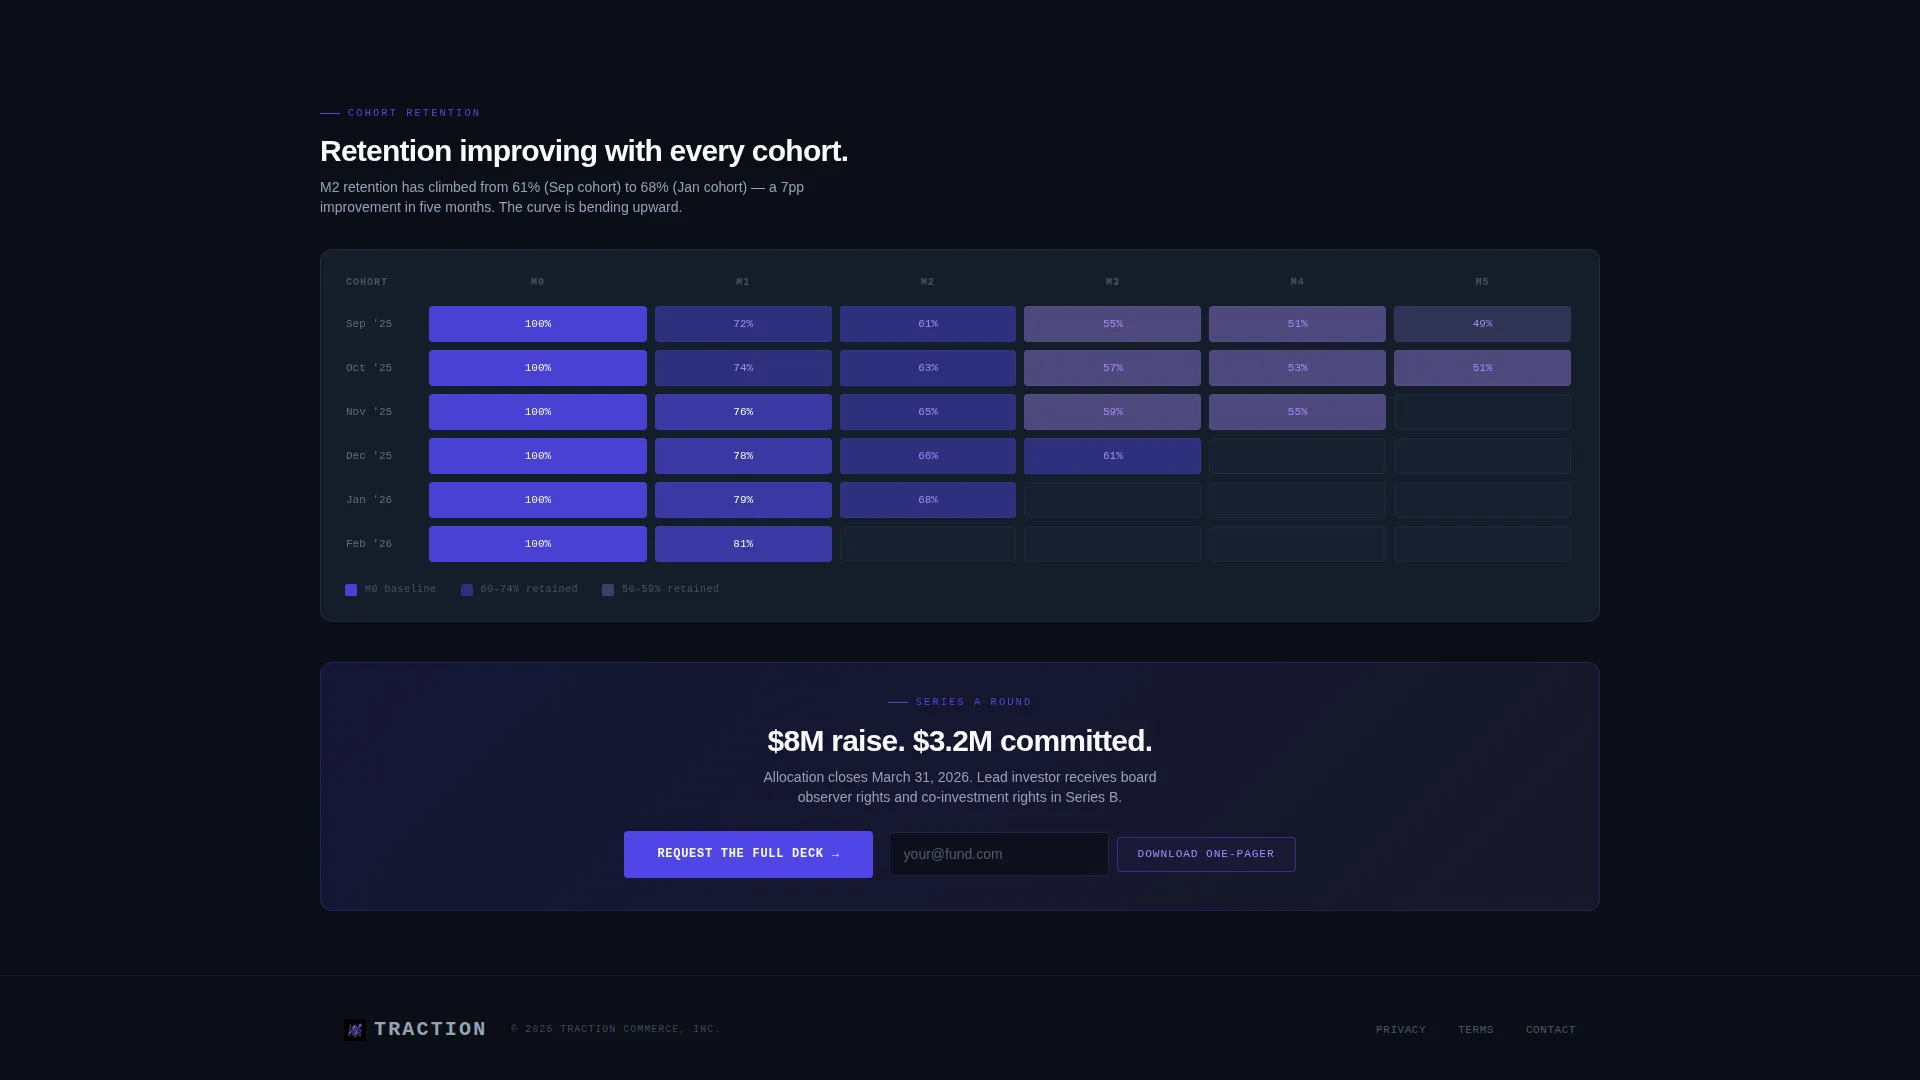
The retention heatmap lights up row by row as the visitor scrolls deeper into the page. This visual structure lets investors read retention depth at a glance and builds strong conviction around long-term customer value before the ask appears.
Dual Lead Capture Paths
The primary call to action, "Request the Full Deck," appears as a sticky ghost-button in the top navigation and again after the retention heatmap. A single-step modal collects fund name, partner name, email, check size range, and an optional open field. A secondary text link, "Download the One-Pager," captures earlier-stage interest with only an email field.
Page sections overview
| Section | Purpose |
|---|---|
| Hero Metric Panels | Open with four glowing KPI cards that establish credibility instantly |
| Revenue Trajectory Chart | Animated area chart shows growth momentum on scroll entry |
| Unit Economics Cards | CAC, payback period, and contribution margin snap into view |
| Channel Mix Bar | Stacked horizontal bar breaks down revenue by acquisition source |
| Cohort Retention Heatmap | Row-by-row heatmap visualizes 90-day customer retention depth |
| Full Deck Modal | Primary lead form collects investor details at peak conviction |
| One-Pager Download | Secondary email gate captures earlier-stage investor interest |
Design & branding system
The template uses an Electric Indigo color system built to feel like a Bloomberg terminal redesigned by a creative agency. Every color choice serves a functional role in data legibility and visual hierarchy.
- Core palette: deep void black (#0B0E17) for backgrounds, charged indigo (#4F46E5) for active elements and hover states, phosphor lilac (#A78BFA) for trend lines and secondary labels, cool slate (#1E293B) for card surfaces, and crisp signal white (#F8FAFC) for typography and data points
- Typography: large monospaced numerals for KPI values, clean sans-serif body copy for labels and descriptions
- Visual language: frosted glass card surfaces, indigo gradient fills on charts, lilac trace lines on heatmaps, and hover-activated indigo pulse states throughout
Mobile & speed optimization
The layout is structured for readability across screen sizes, keeping data panels legible and the scroll-trigger flow intact on smaller viewports.
- Card grids reflow to a single column on mobile so metric panels remain readable without horizontal scrolling
- Sticky navigation with the ghost-button call to action persists across all viewport sizes so the primary conversion path is always accessible
How this template helps you convert
The page is engineered around a single insight: investor conviction builds in layers, and each scroll reveal adds one more layer before the ask arrives.
- The header metric panels qualify interest immediately. An investor who likes what they see in the first four numbers is already leaning forward before any narrative begins.
- The progressive data sequence (revenue chart, unit economics, channel mix, heatmap) mirrors the natural due-diligence mindset. By the time the "Request the Full Deck" call to action appears, the investor has already done a significant portion of their own analysis using the page itself.
Other information about this template
Traction is part of a curated collection of high-converting startup landing page templates built for founders who need to move fast without sacrificing polish. It is designed to be customized with your actual brand metrics, chart data, and fund-targeting copy.
- The template is built in the Dashboard Pro theme and uses the Scroll Reveal (Progressive) style, making it well suited for data-heavy narratives that need pacing
- The Electric Indigo color system is fully documented in the design file, so brand customization follows a clear palette logic rather than guesswork
- The Spec Sheet creative direction means every visual module serves an informational purpose, keeping the page focused and distraction-free
- Founders can adapt the check size dropdown, optional form field, and one-pager gate to match the specific parameters of their raise

Theme
Dashboard Pro
Creative direction
Spec Sheet
Color system
Electric Indigo
Style
Scroll Reveal (Progressive)
Direction
Lead Generation
Page Sections
Dark Glass Panel Header with Live-feel Kpis
Progressive Scroll Reveal Sequence
Animated Revenue Area Chart
Unit Economics Card Group
Cohort Retention Heatmap
Dual-path Lead Capture System
Related questions
Can I replace the placeholder metrics with my actual brand data?
How does the dual lead capture system work?
Is this template suited for a brand that has not yet reached Series A milestones?
Can I change the call-to-action labels and form fields?
Does the scroll-reveal animation work on mobile devices?