D2C Investor Relations Landing Page Template
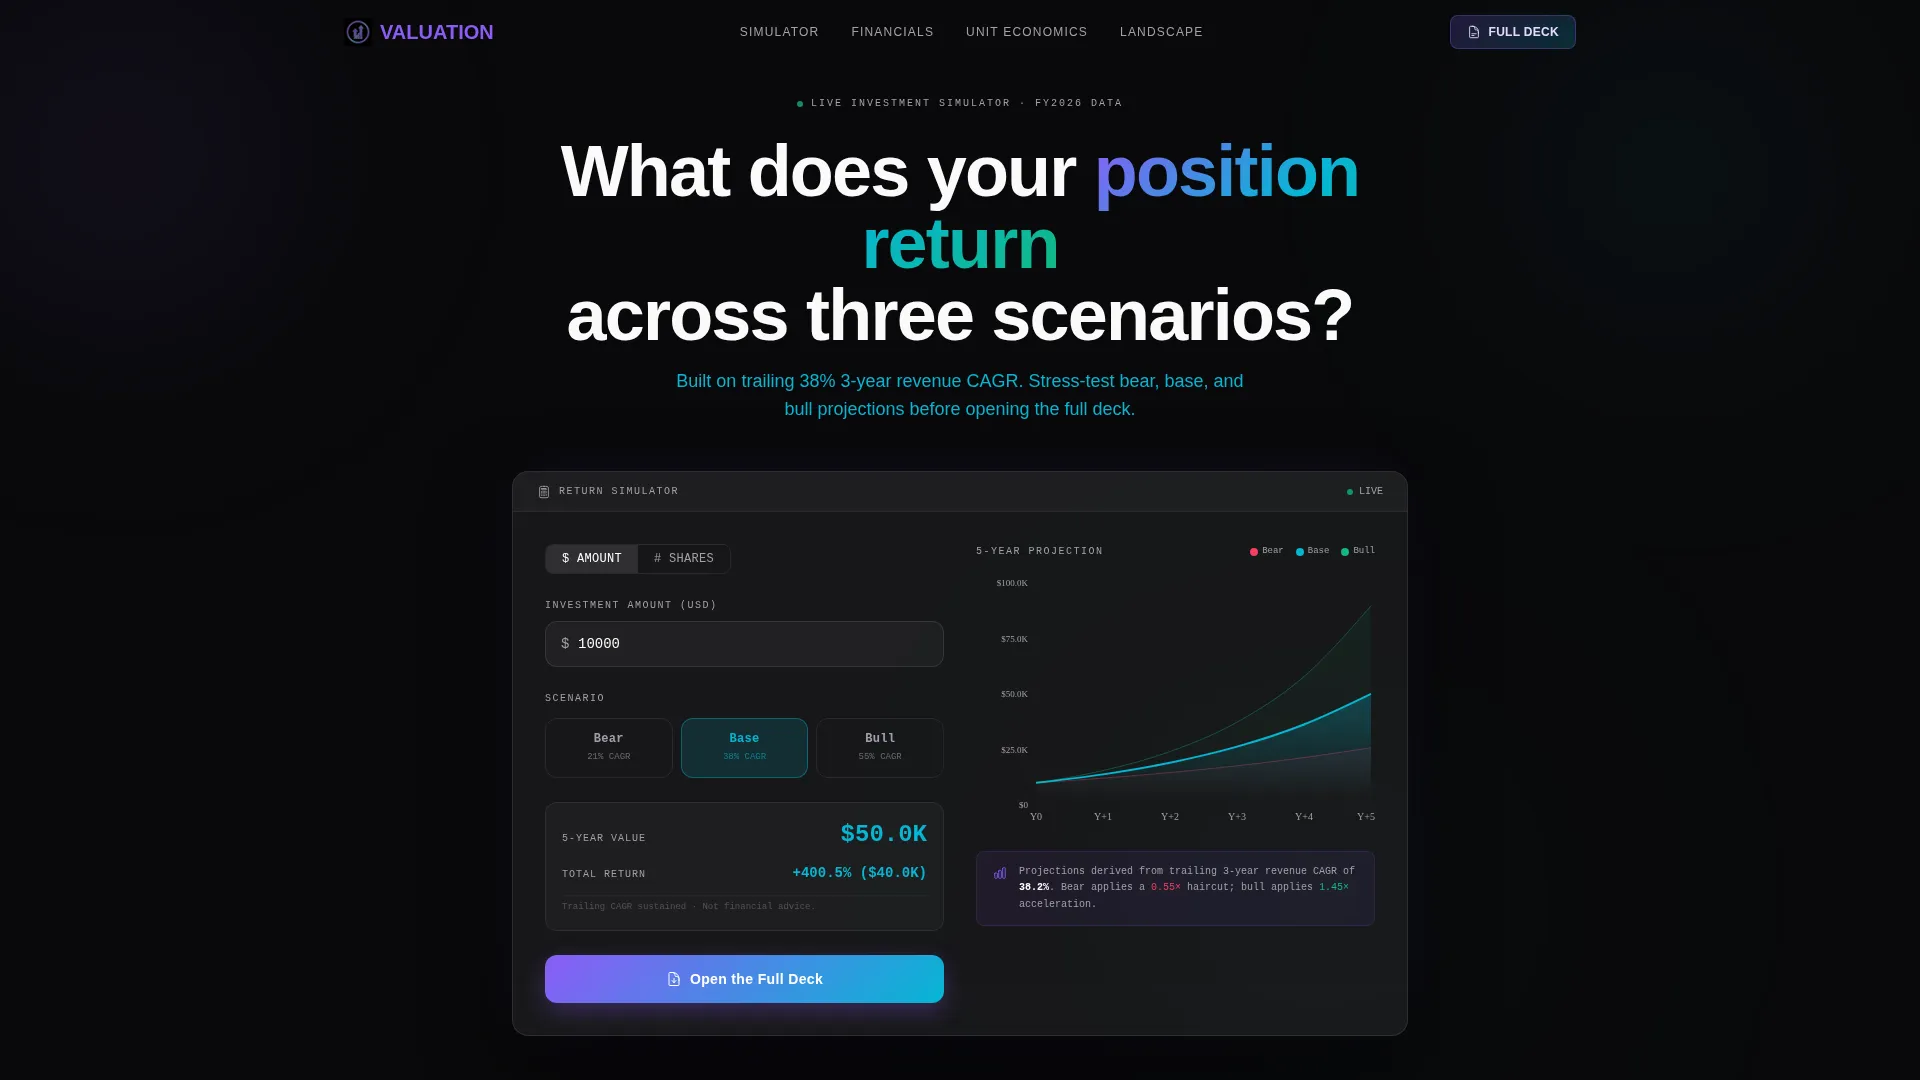
Valuation is a dashboard-style investor relations landing page built for direct-to-consumer brands. It opens with an interactive investment simulator and scrolls through animated financial metrics, unit economics, and competitive positioning data. The design uses a Tech Glass aesthetic with iridescent accents, making dense financial information feel precise and compelling to analysts, fund managers, and retail shareholders alike.
by Rocket studio
Quick summary
Valuation is a single-page investor relations template built for direct-to-consumer brands that need to communicate financial performance with clarity and confidence. It leads with a live investment simulator, then scrolls through earnings trends, unit economics, channel mix, and competitive landscape data. Every section is designed to build an evidence-based investment thesis before the visitor ever reaches a call to action.
Who this template is for
This template is built for founders, investor relations teams, and finance leads at direct-to-consumer brands who need to present financial data to sophisticated audiences. It suits teams preparing for fundraising rounds, coverage by sell-side analysts, or ongoing communication with existing shareholders.
- Institutional investors and fund managers screening emerging direct-to-consumer plays
- Retail shareholders and sell-side analysts building or refreshing coverage models
- Direct-to-consumer brand teams managing ongoing investor communications
What problem this template solves
Most investor-facing pages bury the numbers in static documents or dense slide decks. Sophisticated visitors, the kind running financial screens or building coverage models, need clean, fast access to key metrics without waiting for an earnings filing to process. A generic website layout fails this audience entirely.
- Raw financial data presented without visual hierarchy loses analyst attention quickly
- Static PDF decks cannot front-load interactivity or let investors stress-test assumptions
- There is no standard template that combines equity-research depth with a compelling, modern user experience
What you get with this template
You get a fully structured, single-page investor relations landing page that layers interactive proof, animated data visualization, and strong calls to action into one cohesive scroll experience. Every section is pre-built and ready to populate with your brand's real metrics.
- An interactive investment simulator module as the header, with three-scenario projected return animations
- Four animated content sections covering revenue trends, unit economics, channel mix, and competitive positioning
- Two conversion touchpoints: a primary "Open the Full Deck" call to action and a secondary "Add to Watchlist" email capture
Feature list
This template includes purpose-built components designed specifically for communicating financial data to professional investors. Each element was designed to make dense information feel immediate and credible.
Investment Return Simulator
The header is a glass-paneled calculator module where visitors enter a hypothetical share count or dollar amount. Projected returns animate across bear, base, and bull scenarios using trailing revenue growth rates, with iridescent gradient chart fills and easing number animations.
Animated Revenue and Margin Sparklines
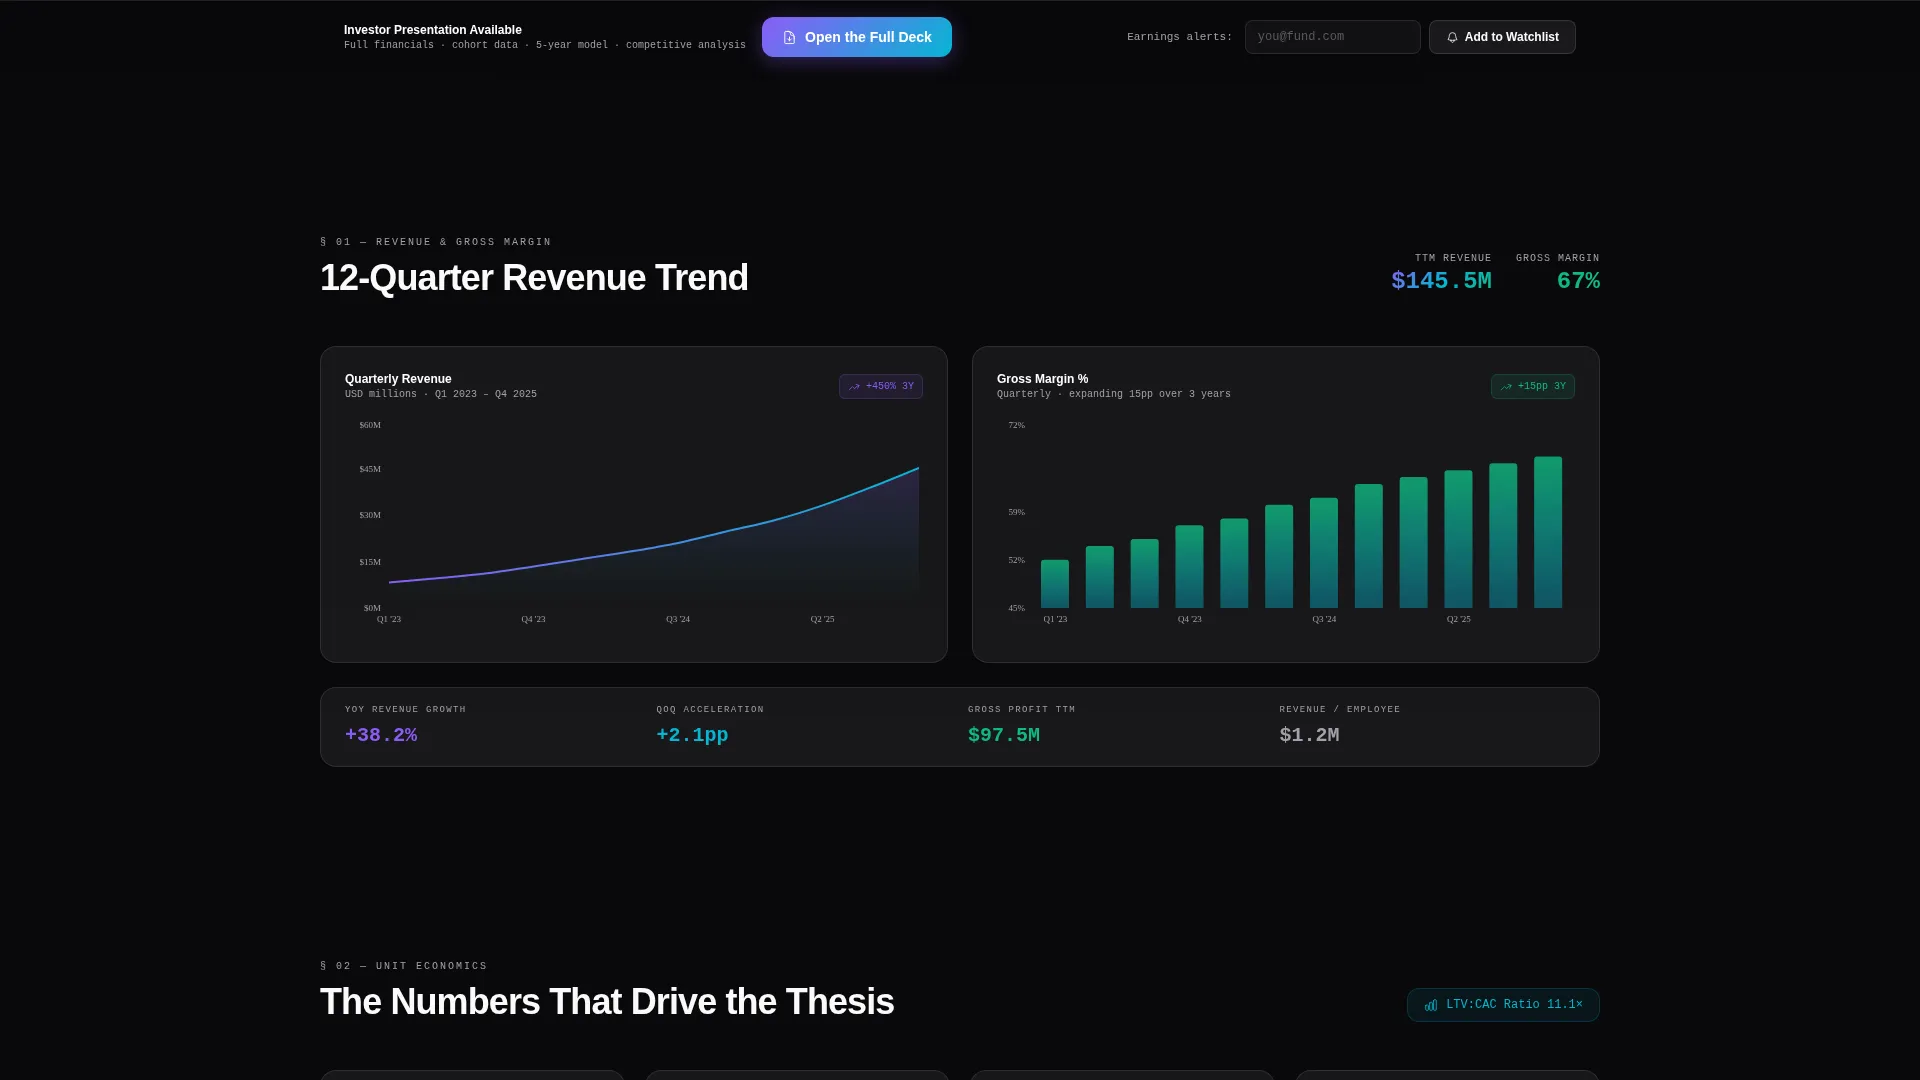
The first content section displays quarterly earnings and gross margin trends as animated sparklines. Data populates left to right on scroll entry, mimicking the feel of a live financial terminal refreshing in real time.
Unit Economics Data Grid
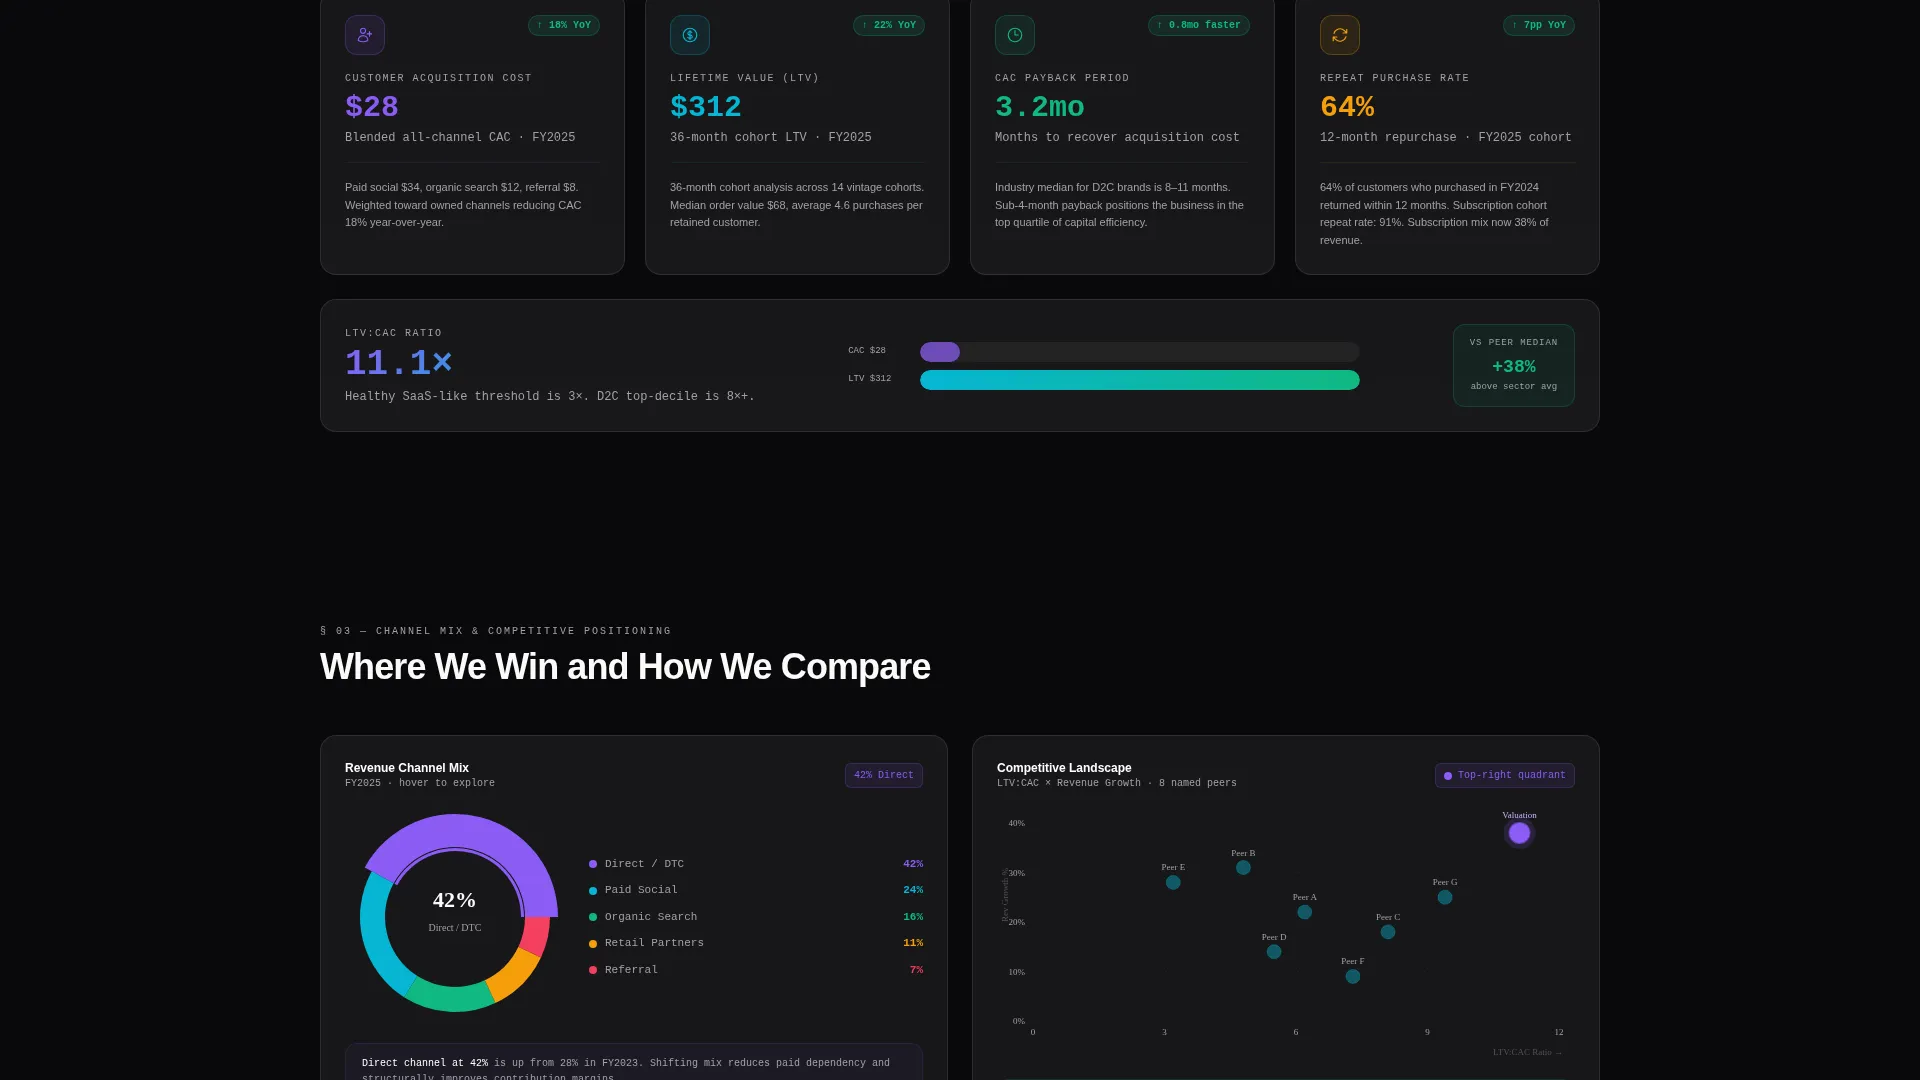
A tight four-card grid presents customer acquisition cost, lifetime value, payback period, and repeat purchase rate in one scannable view. The cards are compact and data-dense, keeping the most critical unit economics visible without scrolling past them.
Channel Mix Donut Chart
A segmented donut chart visualizes revenue by acquisition channel. Segments highlight on hover, letting investors isolate individual channel contributions and understand the brand's traffic and revenue diversification at a glance.
Competitive Landscape Scatter Plot
A scatter plot positions the brand against named market peers across two financial dimensions. This section gives analysts a visual anchor for competitive context without requiring them to build a comparison model from scratch.
Persistent Dual Call-to-Action System
The primary "Open the Full Deck" call to action appears first inside the calculator results panel and reappears as a persistent bottom bar after the second scroll section. A secondary single-field email capture offers earnings alert opt-ins via "Add to Watchlist."
Page sections overview
| Section | Purpose |
|---|---|
| Investment Return Simulator | Interactive header calculator with bear, base, and bull scenario animations |
| Revenue and Margin Trends | Animated sparklines showing quarterly earnings and gross margin trajectory |
| Unit Economics Grid | Four-card data grid for customer acquisition cost, lifetime value, payback period, and repeat rate |
| Channel Mix Chart | Hover-segmented donut chart breaking down revenue by acquisition channel |
| Competitive Landscape Plot | Scatter plot comparing brand positioning against named industry peers |
| Persistent call to action Bar | Bottom-anchored bar with primary deck link and secondary email capture |
Design & branding system
The visual identity follows a Tech Glass theme built on an AI Iridescent color system. The palette is obsessively functional while remaining visually striking, sitting somewhere between a financial data terminal and a high-end product launch page.
- Base layer: void black (#09090B) with frosted glass panels at 6% white opacity and backdrop blur
- Accent system: iridescent shift between violet (#8B5CF6) and cyan (#06B6D4) on hover states and chart highlights
- Secondary text and axis labels rendered in neutral data-ink gray (#A1A1AA) for maximum readability against dark backgrounds
Mobile & speed optimization
The template is structured to maintain data density and readability across screen sizes. Charts, grids, and the simulator module are all designed within a layout that adapts to narrower viewports without collapsing the visual hierarchy.
- The four-card unit economics grid and donut chart are structured to reflow on smaller screens
- Fade-and-rise scroll animations are scoped to individual sections, keeping each load light and sequential
- The persistent bottom call-to-action bar remains accessible throughout the scroll on mobile viewports
How this template helps you convert
The page is built around an evidence-accumulation narrative. By the time a visitor reaches either call to action, they have already interacted with the data and built personal confidence in the numbers.
- The calculator module hooks visitors immediately by making projected returns personal and tangible before any static content appears.
- Each subsequent scroll section adds a new layer of financial evidence, from revenue trends to competitive positioning, so the investment thesis feels self-constructed rather than pitched.
- The persistent "Open the Full Deck" bar keeps the primary conversion action in view without interrupting the analytical flow, capturing intent at the moment it peaks.
Other information about this template
This template fits naturally into a broader direct-to-consumer brand launch or fundraising workflow. It is particularly well suited for brands that already have a data room or investor presentation PDF ready to link, since the "Open the Full Deck" call to action is the primary conversion goal.
- The template is categorized under Startup and Launch, specifically within the D2C Brand Investor Relations niche
- It pairs well with a separately designed product or brand landing page, as this template is purpose-built for the investor audience only
- The creative direction follows an Industry Report cadence, meaning content sections are ordered to mirror the flow of a professional equity research document
- Template style is Dashboard and Data Grid, making it distinct from narrative-led or editorial startup templates in the same category

Theme
Tech Glass
Creative direction
Industry Report
Color system
AI Iridescent
Style
Dashboard/Data Grid
Direction
Click-Through
Page Sections
Investment Return Simulator Header
Animated Financial Sparklines
Unit Economics Four-card Grid
Hover-segmented Channel Mix Chart
Competitive Landscape Scatter Plot
Persistent Dual Call to Action System
Related questions
Who is this landing page template designed for?
Does this template include the actual financial data?
Can I use this template without an investor presentation PDF ready?
What makes this template different from a standard startup landing page?
How customizable is the iridescent color system?