Detection Landing Page Template for Technical Platforms
Anomaly is a single-page landing page template built for intelligent detection platforms. It combines a live ROI estimator, a twelve-row capability comparison table, and a dark Data Command visual identity to guide site reliability engineers, security analysts, and DevOps teams from curiosity to signup in one focused, evidence-driven scroll.
by Rocket studio
Quick summary
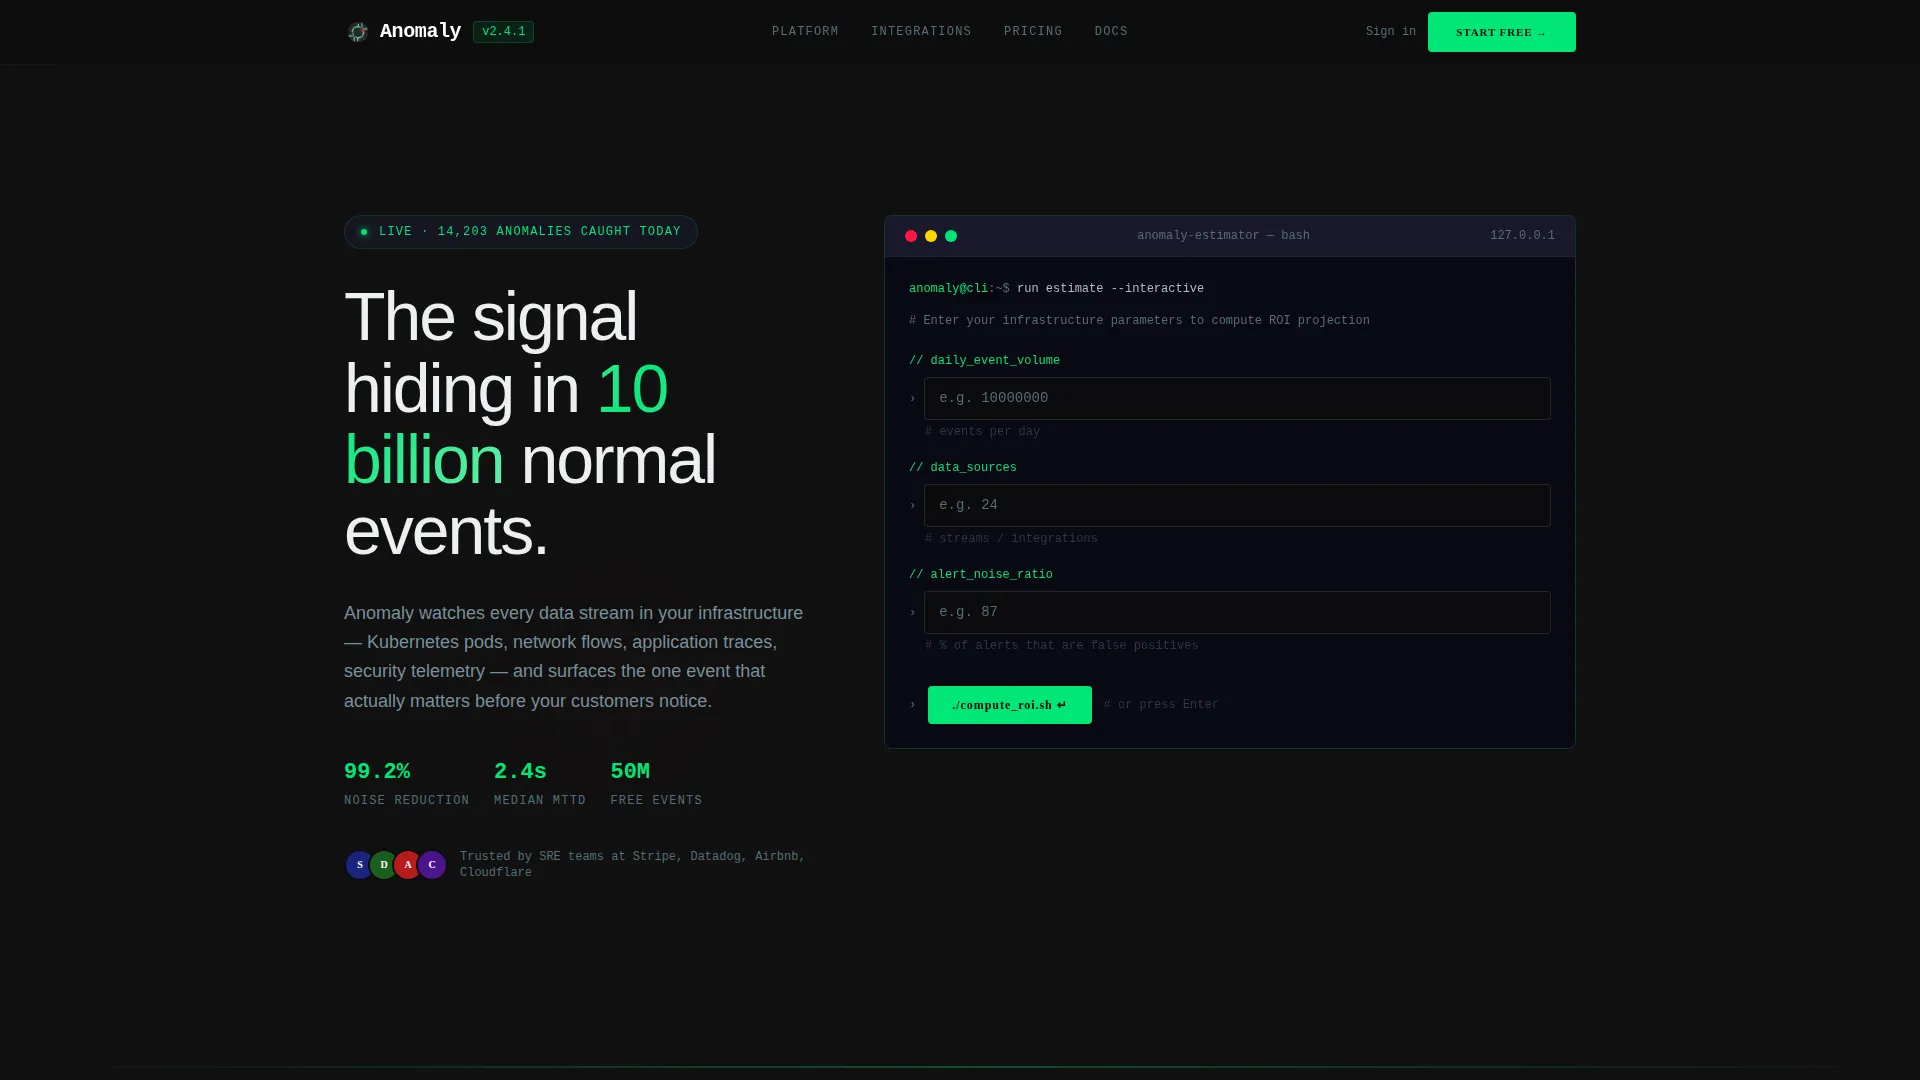
Anomaly is a high-impact landing page template for anomaly detection platforms. It opens with an interactive calculator that turns each visitor's own infrastructure numbers into a personalized ROI projection. A scrollable feature matrix then builds the case row by row, and two conversion paths close the page with clarity and confidence.
Who this template is for
This template is built for technical go-to-market teams launching or repositioning an anomaly detection platform. It speaks directly to buyers who live inside complex infrastructure and need proof, not promises.
- Site reliability engineers (SREs) who fight alert fatigue and false positives on overnight shifts
- Security analysts managing hybrid cloud environments and high-volume alert queues
- DevOps engineers who need to distinguish a deploy spike from a genuine service degradation
What problem this template solves
Most detection platform pages rely on generic benefit statements that never connect to a buyer's real environment. Visitors leave without understanding what the product actually changes for them. This template closes that gap.
- It replaces vague claims with a personalized ROI calculator the visitor fills out themselves
- It replaces competitor comparisons with a structured, animated matrix that accumulates evidence row by row
- It replaces single-call to action dead ends with two conversion paths serving both self-serve and enterprise buyers
What you get with this template
You get a complete, conversion-focused landing page template ready to adapt for your anomaly detection platform. Every section serves a purpose and nothing is decorative for its own sake.
- An interactive estimator section with three terminal-styled input fields and animated output metrics
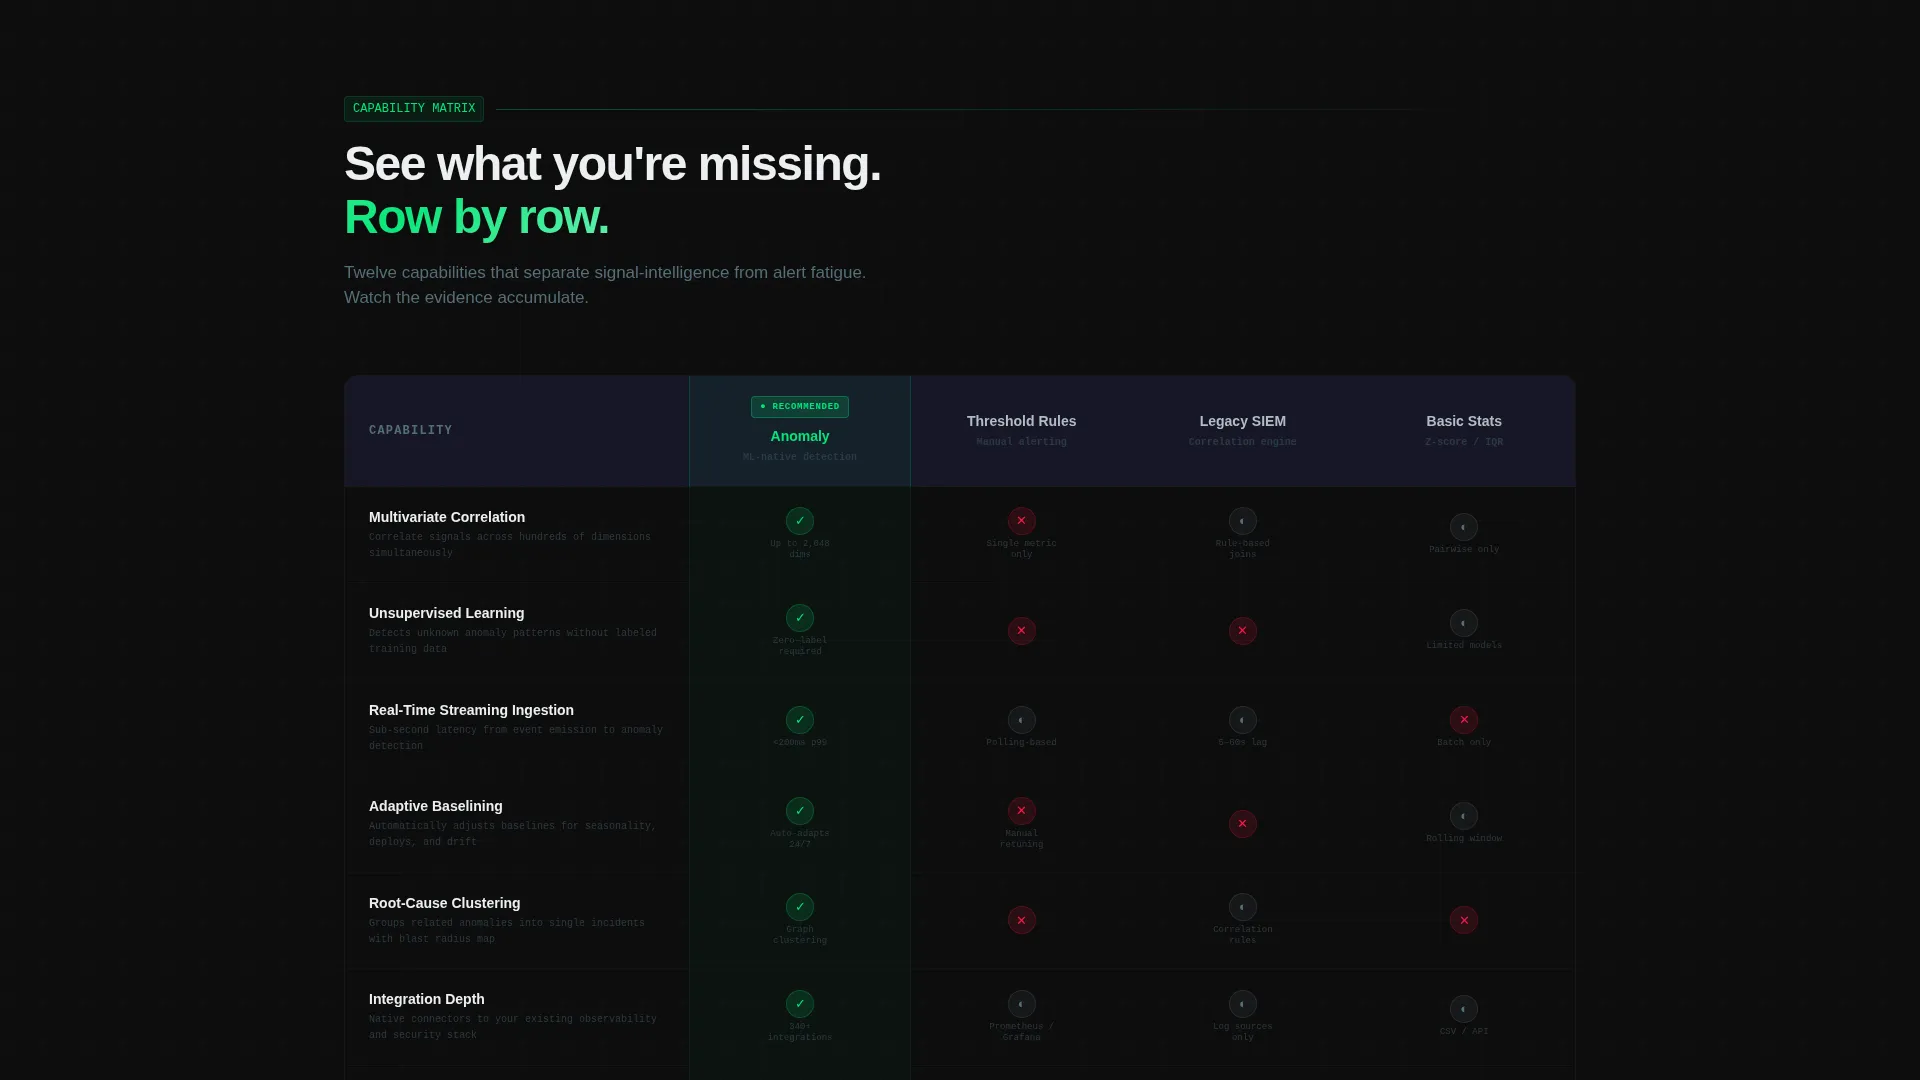
- A twelve-row comparison table that animates on scroll against three named competitor archetypes
- Two distinct call-to-action paths: a free-signup prompt and a guided demo booking option
Feature list
This template ships with six purpose-built components that work together to move a technical buyer from skepticism to action.
Live ROI Estimator Header
Visitors input their daily event volume, number of data sources, and current alert noise ratio. On submit, the estimator renders three personalized outputs: false positives eliminated per week, mean-time-to-detect improvement in seconds, and estimated annual hours reclaimed. The numbers animate upward in telemetry green, making the visitor's own data the hero of the page.
Animated Comparison Matrix
A twelve-row feature matrix compares the platform against manual threshold rules, legacy SIEM (Security Information and Event Management) correlation, and basic statistical monitoring. Rows cover multivariate correlation, unsupervised learning, real-time streaming ingestion, adaptive baselining, root-cause clustering, integration depth, noise reduction ratio, time-to-value, alert fatigue index, explainability scoring, deployment flexibility, and cost-per-ingested-GB. Each row animates on scroll so the platform's column fills progressively while competitor columns thin out.
Dual Conversion Path Design
A slim carbon-dark sticky bar pins the primary call to action after the estimator interaction. The same call to action repeats below the comparison table with supporting reassurance copy. A secondary path offers a guided demo booking for enterprise buyers who need deeper proof before provisioning.
Data Command Visual Theme
The Carbon Fiber color system uses deep carbon black and woven graphite as base surfaces, telemetry green for healthy-state indicators and active user interface elements, and incident red used sparingly on anomaly highlights. The palette evokes a stealth aircraft cockpit at night, with matte dark surfaces and phosphorescent readouts that draw the eye before the brain catches up.
Terminal-Styled Input Fields
The estimator inputs are styled like terminal prompts, reinforcing the platform's technical authority without relying on stock imagery or illustrations. The design communicates precision and keeps the visual language consistent with the Data Command theme throughout.
Scroll-Triggered Animation System
Checkmarks and capability badges animate left to right as the visitor scrolls through the comparison matrix. This pacing is intentional: by the time the visitor reaches the bottom of the table, the evidence has accumulated naturally and the conclusion feels logical rather than marketed.
Page sections overview
| Section | Purpose |
|---|---|
| ROI Estimator Header | Personalizes value with visitor-input metrics |
| Sticky call to action Bar | Keeps primary action visible post-estimator |
| Comparison Matrix | Builds evidence across twelve capability rows |
| Below-Table call to action | Reinforces signup with reassurance copy |
| Demo Booking Path | Captures enterprise buyers needing guided proof |
Design & branding system
The visual identity follows a Data Command theme built on the Carbon Fiber color system. Every design decision reinforces the feeling of precision, control, and immediate situational awareness.
- Deep carbon black (#0D0D0D) and woven graphite (#1A1A2E) form the base surface layers, crossed by faint grid lines
- Telemetry green (#00E676) marks healthy states, active elements, and animated metric outputs; incident red (#FF1744) appears only on anomaly highlights
- Cool aluminum gray (#B0BEC5) carries body text and secondary labels, keeping readability high against the dark backgrounds
Mobile & speed optimization
The template is designed to remain functional and readable across screen sizes. The terminal-styled inputs, sticky bar, and animated matrix are all structured to adapt without breaking the visual hierarchy.
- Input fields and estimator outputs reflow cleanly for smaller viewports
- The comparison matrix is structured for horizontal scroll on mobile without losing row context
- The sticky call to action bar remains visible and tappable at mobile breakpoints
How this template helps you convert
The conversion logic is built into the page's sequence, not bolted on at the end. Each section moves the visitor one step closer to a decision they already feel informed enough to make.
- The estimator turns abstract platform claims into a personal number tied to the visitor's own infrastructure, making the value concrete before a single feature is listed
- The animated comparison matrix layers evidence progressively so the platform's advantage accumulates with each scroll step, reducing the need for the visitor to do their own research
- Two conversion paths serve two distinct buyer types at the same time: a free self-serve signup for individuals ready to act, and a demo booking for enterprise teams that need internal justification first
Other information about this template
This template is categorized under Technology, specifically within the Advanced Tech and Artificial Intelligence Platforms subcategory, targeting the anomaly detection platform niche. It is designed as a single-page, section-led landing page and is not a multi-page website.
- The creative direction follows a Feature Matrix structure, meaning the comparison table is the primary persuasion engine, not a secondary supporting element
- The header concept is a Calculator or Estimator, making it distinct from hero-image or video-led templates in the same category
- The landing page direction is Click-Through, with both calls to action routing visitors toward a signup page or a demo booking flow
- The template contains no stock photography and no illustration; the visitor's own inputted data serves as the visual hero throughout
- The template style is a Comparison Table layout, which suits platforms competing in a crowded detection tooling market where differentiation requires direct, side-by-side evidence


Theme
Data Command
Creative direction
Feature Matrix
Color system
Carbon Fiber
Style
Comparison Table
Direction
Click-Through
Page Sections
Live ROI Estimator with Animated Outputs
Twelve-row Animated Comparison Matrix
Dual Call-to-action Conversion Paths
Carbon Fiber Data Command Visual Identity
Scroll-triggered Animation System
No-imagery Terminal Design Language
Related questions
Who is this landing page template designed for?
What does the ROI estimator actually do?
Can I adapt the comparison table for my specific competitors?
What are the two conversion paths included in this template?
Does this template use any imagery or illustrations?



