Computer Vision Open Source Landing Page Template
Detect is a scroll-reveal landing page template built for a production-grade, open-source computer vision library. It leads with an interactive model performance estimator, then walks visitors through benchmark charts, inference comparisons, and integration cards. The design uses a dark terminal aesthetic with active teal highlights, and every call to action drives toward a one-click install or a reproducible Colab notebook.
by Rocket studio
Quick summary
Detect is a single-page, scroll-reveal landing page template for an open-source computer vision library. It opens with a live performance estimator and unfolds like an industry report, presenting benchmark data, inference comparisons, and ecosystem integrations in sequence. The design feels like a dark-mode IDE, and every section builds a tighter case for adoption.
Who this template is for
This template is built for technical projects that need to earn trust through evidence, not marketing copy. It fits teams and individuals who want their landing page to do the heavy lifting with real numbers.
- Machine learning engineers who benchmark inference speed against competing libraries
- Startup founders and engineering leads evaluating whether to build or adopt a perception stack
- Hobbyist developers and makers building computer vision projects on edge devices
What problem this template solves
Most open-source project pages ask visitors to trust a README. This template replaces that leap of faith with interactive data and reproducible results. The page turns skeptical technical readers into active users.
- Visitors cannot easily verify performance claims on a static page
- Competing libraries look similar on paper until benchmark numbers are placed side by side
- A cold install ask fails when engineers have not yet seen the library in action
What you get with this template
You get a fully structured, scroll-reveal landing page layout designed specifically for a computer vision open-source project. Every section is purposeful and ordered to convert through demonstration.
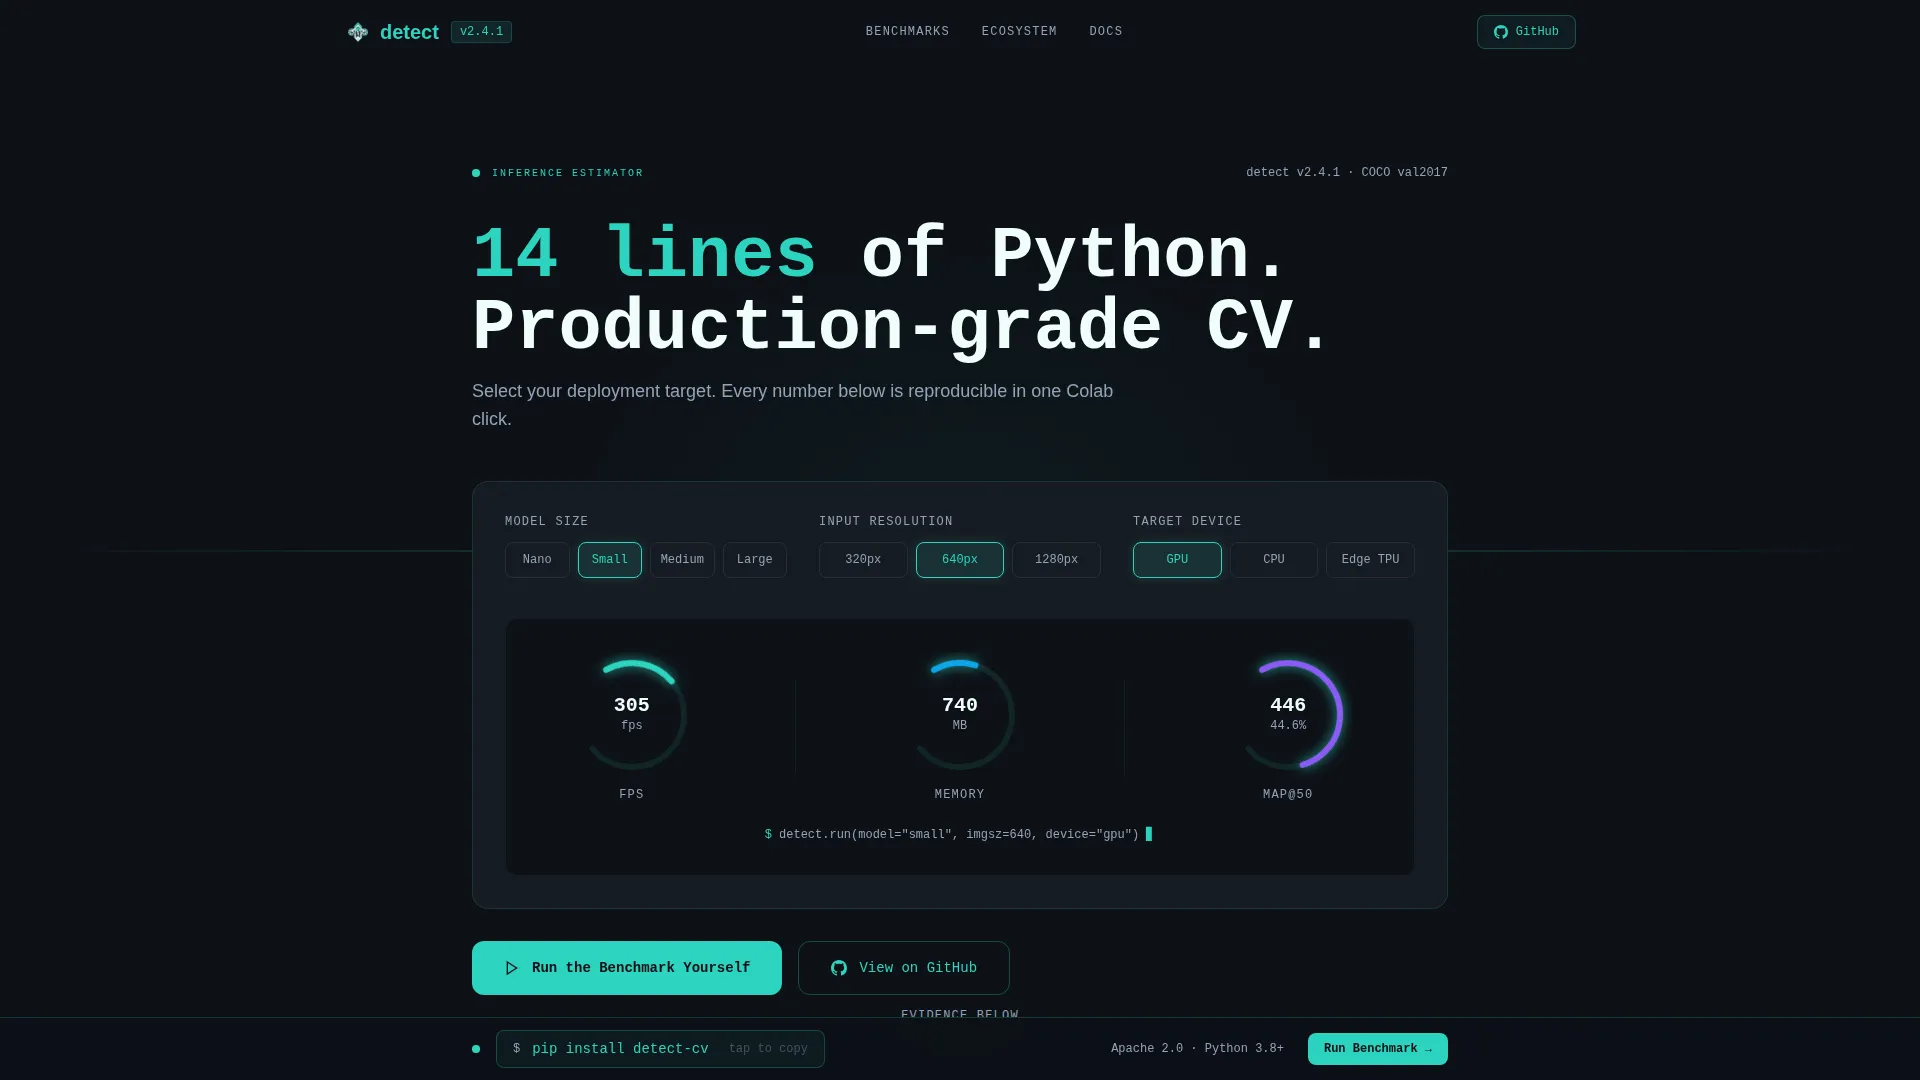
- A live calculator header that returns predicted frames per second, memory footprint, and mean average precision score
- Progressive benchmark sections including scatterplots, side-by-side inference comparisons, and an integration card directory
- A persistent sticky bottom bar with a copyable install command and a primary call-to-action linking to a reproducible Colab notebook
Feature list
This template ships with purpose-built components that reflect the structure, tone, and conversion goals described in the brief.
Live Performance Estimator Header
Visitors select a model size (nano, small, medium, or large), an input resolution, and a target device such as a graphics processing unit (GPU), central processing unit (CPU), or edge tensor processing unit (TPU). The estimator instantly returns predicted frames per second, memory footprint, and mean average precision (mAP) score as animated gauge dials. There is no hero image above the fold; the tool itself is the opening pitch.
Scroll-Reveal Benchmark Sections
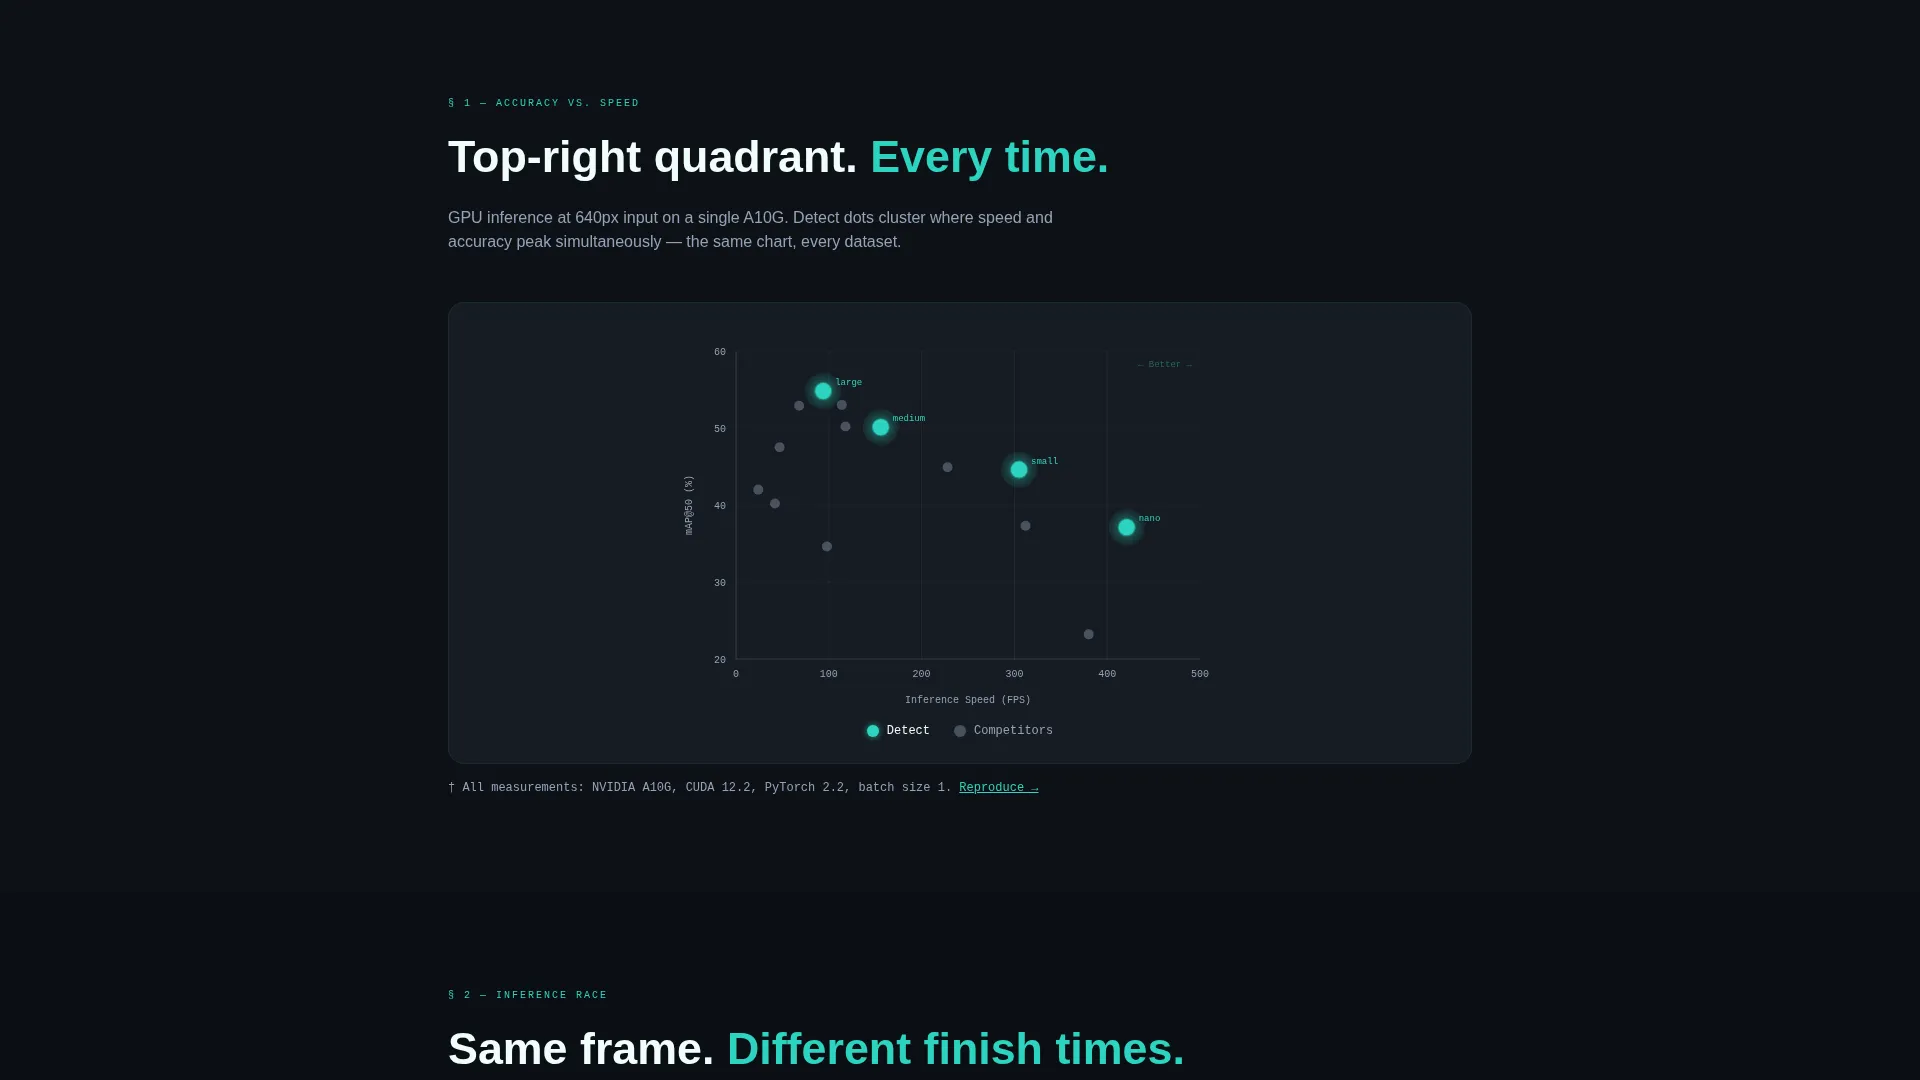
Each section fades and slides upward as it enters the viewport, following an industry report cadence. Accuracy-versus-speed scatterplots appear first, placing this project's results in the top-right quadrant. The progressive reveal keeps readers moving through the evidence.
Side-by-Side Inference Comparison
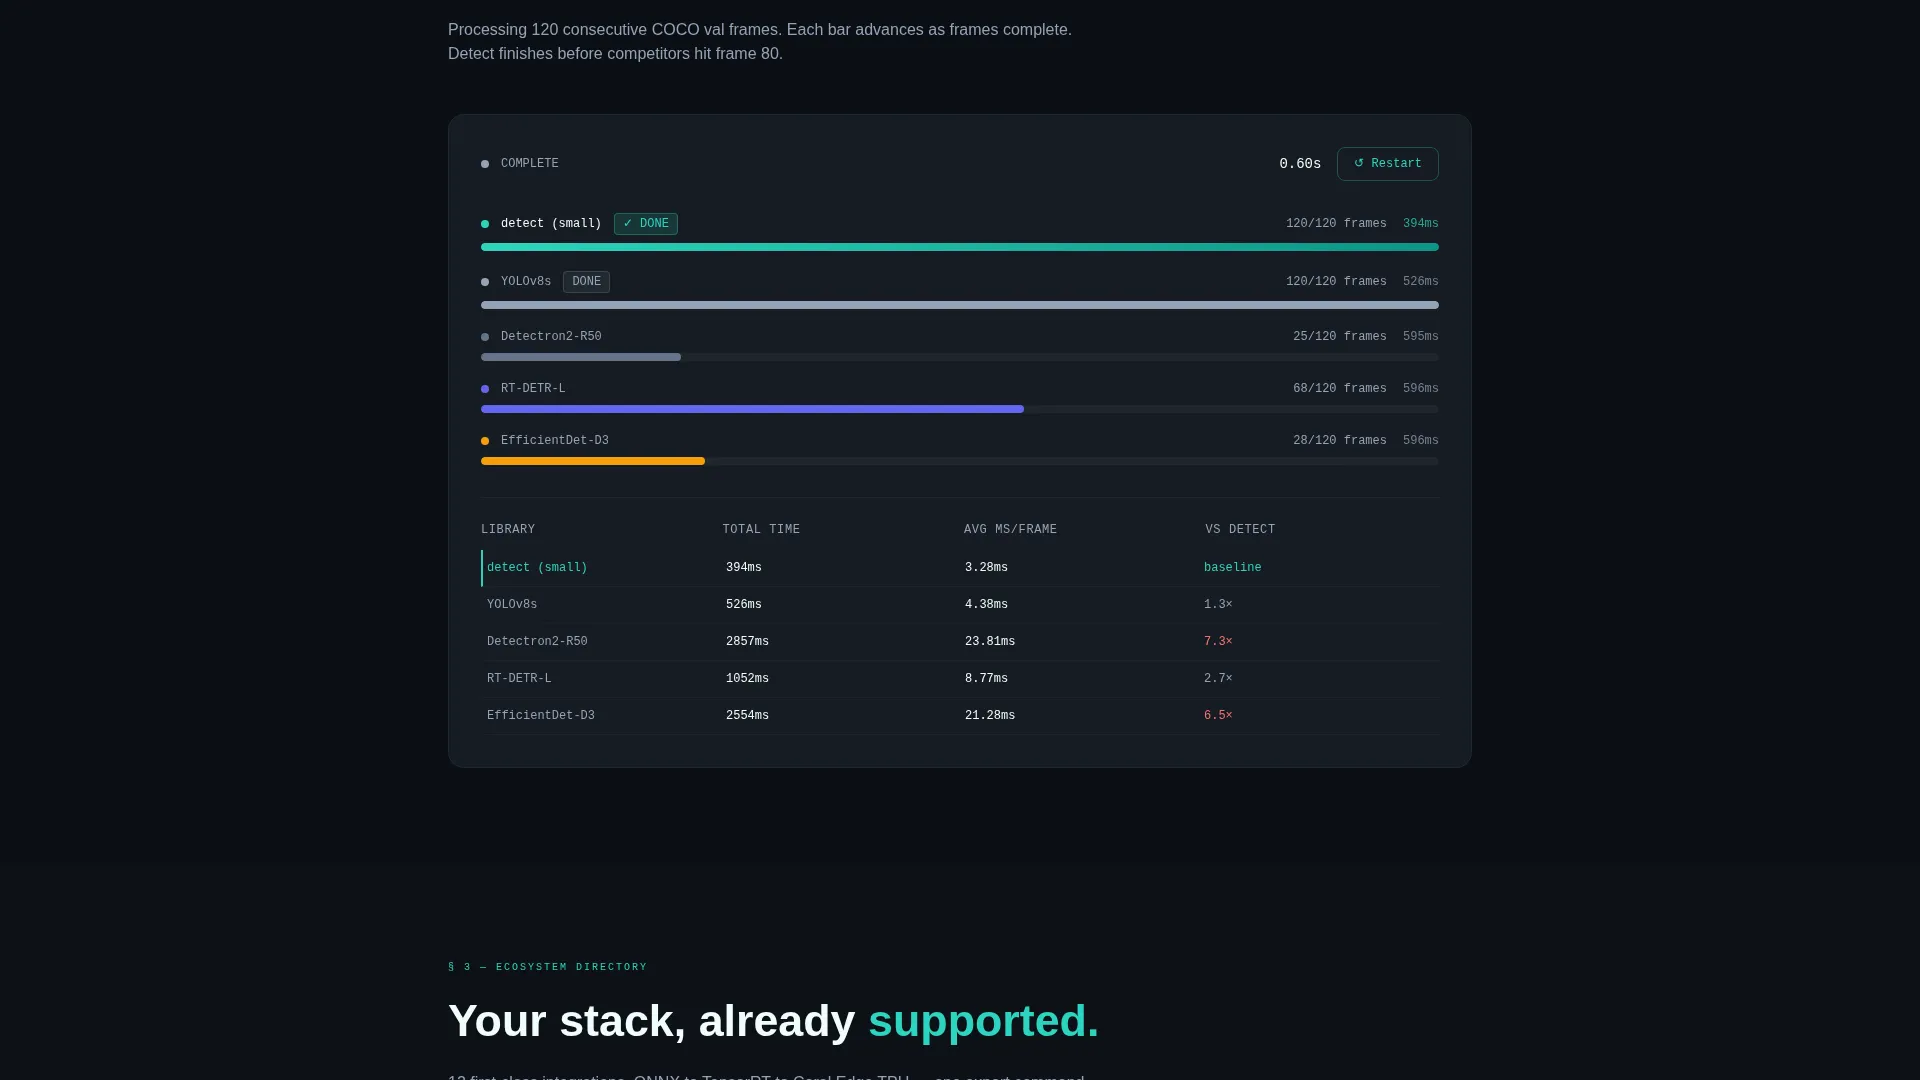
Identical frames are shown processed by competing libraries, with millisecond counters visible in the corner of each video. This component makes performance differences concrete and immediately readable without requiring the visitor to run anything locally.
Integration Ecosystem Directory
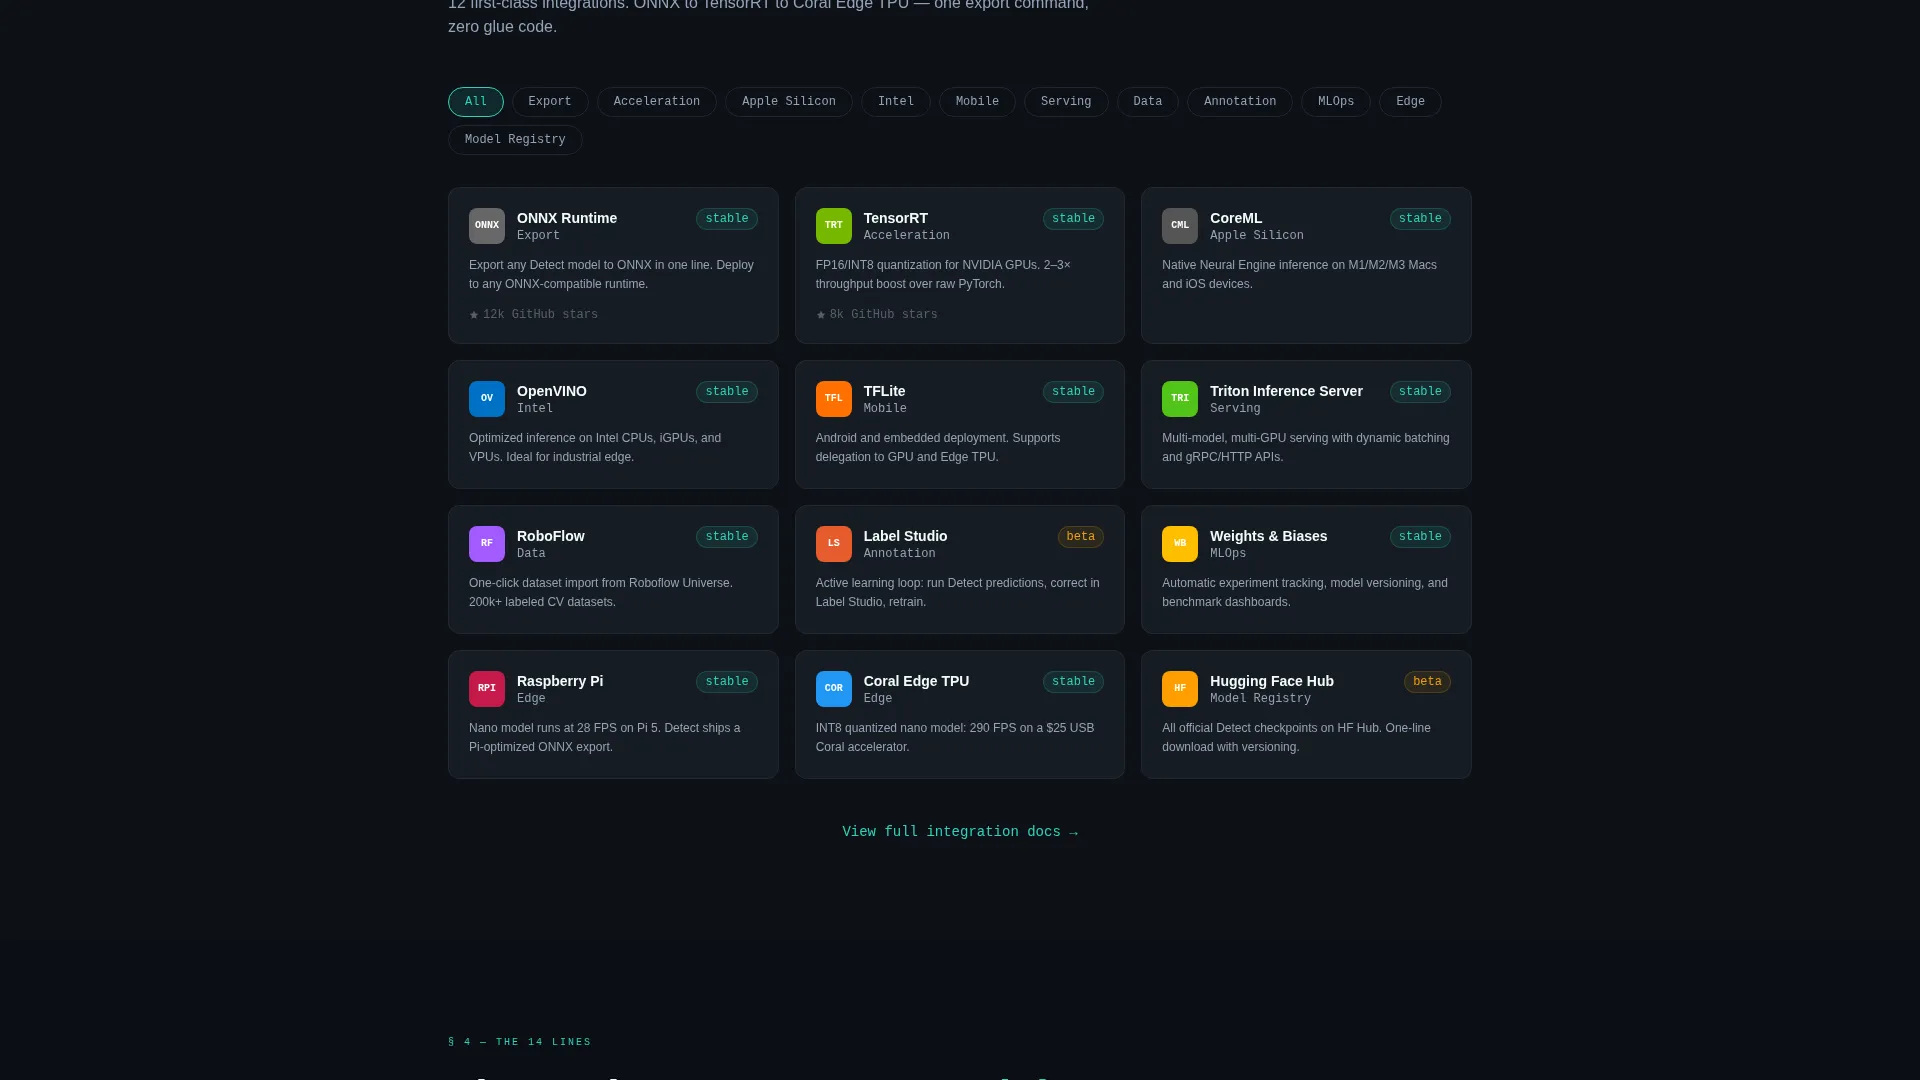
A grid of clickable cards reveals supported export and deployment targets including ONNX, TensorRT, and CoreML. The cards are styled to match the Directory and Discovery theme and appear progressively as the visitor scrolls.
Sticky Install Command Bar
A persistent bottom bar keeps the install command visible throughout the entire scroll session. The command block is copyable on tap and outlined in active teal so it never disappears into the background.
Dual Call-to-Action Structure
The primary call to action, "Run the Benchmark Yourself," links to a Google Colab notebook that reproduces every chart on the page. A secondary install command sits alongside it in the sticky bar. There is no email gate or signup requirement.
Page sections overview
| Section | Purpose |
|---|---|
| Performance Estimator Header | Let visitors calculate predicted speed, memory, and accuracy before scrolling |
| Accuracy versus. Speed Scatterplot | Show this library's results clustered in the top-right performance quadrant |
| Inference Comparison Video | Compare processing speed against competing libraries using live millisecond counters |
| Integration Cards Directory | Reveal supported deployment targets as a scrollable grid of clickable cards |
| Sticky Install Bar | Keep the copyable install command and primary call to action persistently visible |
Design & branding system
The visual identity follows a Directory and Discovery theme built on the Teal Catalyst color system. The palette is designed to feel like a dark-mode code editor late at night, where one color carries all the energy.
- Deep terminal black (#0D1117) for backgrounds, active teal (#2DD4BF) for interactive elements and highlights, muted slate (#94A3B8) for secondary text and chart axis labels, and signal white (#F0FDFA) for card surfaces and key metrics
- Teal pulses through progress bars, benchmark chart lines, and hover states to create a sense of live voltage across the page
- The overall tone matches an indexed research paper: clean, confident, and structured so every visual argument points toward the same conclusion
Mobile & speed optimization
The template is structured for a smooth scroll experience across screen sizes. Progressive reveal animations are tied to viewport entry, which keeps the page feeling responsive and intentional on smaller displays.
- Animated gauge dials and scroll-triggered reveals are designed to perform cleanly on both desktop and mobile viewports
- The sticky install bar and copyable command block are optimized for tap interaction on touch screens
- Chart and comparison sections are laid out to remain readable when resized, without requiring horizontal scrolling
How this template helps you convert
This template converts through demonstration rather than persuasion. Every scroll interaction produces new evidence, and every call to action removes friction from the adoption path.
- The performance estimator at the top gives visitors a personalized result before they read a single word of copy, creating immediate relevance and investment in the page
- The progressive benchmark sequence builds a cumulative argument so that by the time the visitor reaches the install command, they have already seen the numbers reproduced in multiple formats
- The zero-friction conversion model (no email gate, no signup, just a copy-and-paste install or a one-click Colab run) removes the last barrier between interest and adoption
Other information about this template
This template is categorized under Technology and is specifically designed for the computer vision open-source project niche. It pairs well with projects that want to demonstrate production-grade capabilities to a technical audience.
- The template style is Scroll Reveal (Progressive), meaning sections animate into view as the visitor scrolls rather than loading all at once
- The creative direction follows an Industry Report cadence, making it a strong fit for projects with real benchmark data to present
- The header concept is a Calculator/Estimator, which differentiates this template from standard hero-image landing pages and is especially effective for performance-focused libraries
- The conversion direction is Comparison versus competitors, positioning the library against alternatives through reproducible, on-page evidence rather than written claims
Theme
Directory & Discovery
Creative direction
Industry Report
Color system
Teal Catalyst
Style
Scroll Reveal (Progressive)
Direction
Comparison/Versus
Page Sections
Live Performance Estimator Header
Scroll-reveal Benchmark Sections
Side-by-side Inference Comparison
Integration Ecosystem Card Grid
Persistent Sticky Install Bar
Dual No-friction Call-to-action Structure
Related questions
Does this template require a backend to power the performance estimator?
Can I replace the benchmark charts with my own project's data?
Is the sticky install bar visible throughout the entire page on mobile?
Who is this template best suited for?
Can I link the primary call to action to something other than a Colab notebook?



