Government AI Inventory Forecasting Landing Page
Forecast is a bento grid landing page template built for government AI inventory forecasting platforms. It opens with a live savings estimator, delivers stats-first proof tiles, and closes with a head-to-head comparison of legacy versus AI-driven procurement methods. Every section is designed to move federal logistics decision-makers from skepticism to a calculated, confident action.
by Rocket studio
Quick summary
Forecast is a single-page bento grid template purpose-built for AI-powered procurement intelligence platforms targeting federal and state supply chain audiences. It leads with an interactive savings calculator, escalates through hard-number proof tiles, and anchors conversion around a direct comparison between legacy reorder methods and AI-driven demand sensing.
Who this template is for
This template is built for teams selling predictive procurement or government AI inventory forecasting solutions to institutional buyers. It speaks to audiences who evaluate tools by numbers, not marketing language.
- Federal logistics officers and Defense Logistics Agency (DLA) program managers who need proof before a conversation starts
- State-level procurement directors defending budget variances to oversight committees
- Platform vendors and agency contractors presenting AI forecasting solutions to Department of Defense (DOD) stakeholders
What problem this template solves
Federal procurement teams lose millions annually to overstocked warehouses and emergency reorders. No off-the-shelf template is designed to communicate that pain with the specificity, gravity, and institutional tone these buyers require.
- Generic SaaS templates lack the credibility signals and data-forward structure that government decision-makers trust
- Procurement platform pages often bury the ROI case in text, while buyers need to see fiscal-year numbers immediately
- There is no standard template that combines an inline savings estimator, stat-led proof tiles, and a structured method comparison in a single focused layout
What you get with this template
You get a fully structured bento grid landing page with distinct functional zones, each engineered to advance a skeptical government buyer toward a single, calculable action.
- A live header calculator that projects agency-specific savings from three inputs: annual procurement spend, number of stock-keeping units (SKUs) managed, and current stockout frequency
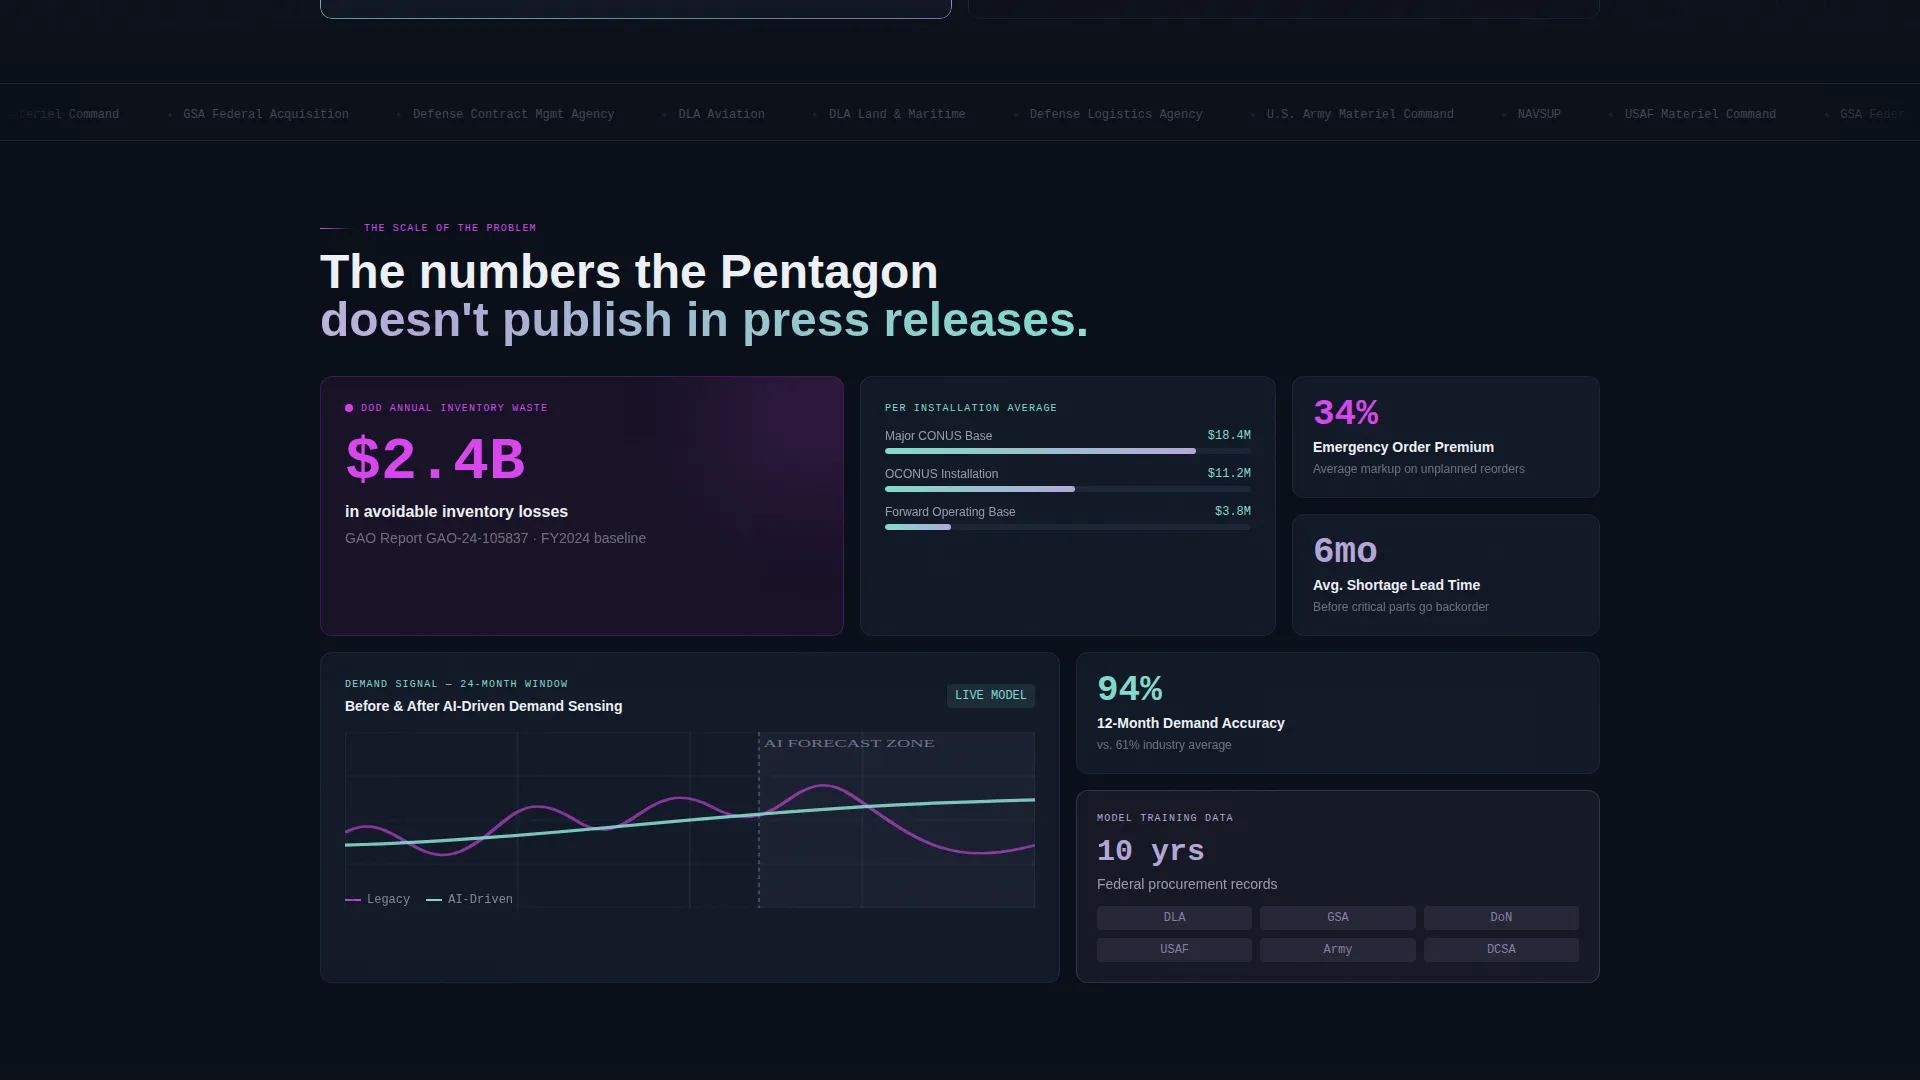
- A staggered bento tile grid that moves from industry-wide waste figures down to model-specific accuracy metrics, with animated before-and-after demand curves
- A persistent split-view comparison row, a gated benchmark report download, and dual call-to-action (call to action) placements anchored to the estimator result
Feature list
This section describes the core functional and design components included in the Forecast template.
Live Savings Estimator Header
The header is a functioning calculator tile. Visitors enter their agency's annual procurement spend, number of SKUs managed, and stockout frequency. The tool instantly renders a projected savings figure and waste-reduction percentage inside an animated bento tile. The result card carries an iridescent border that pulses once as the estimate appears.
Staggered Bento Grid Proof Tiles
The bento grid reveals tiles in a staggered sequence as the visitor scrolls. Each row escalates from industry-wide pain data to agency-specific proof figures to model accuracy metrics. One tile shows the scale of annual DOD inventory waste, the adjacent tile breaks that into per-base figures, and the tile below animates a before-and-after demand curve.
Comparison Split-View Row
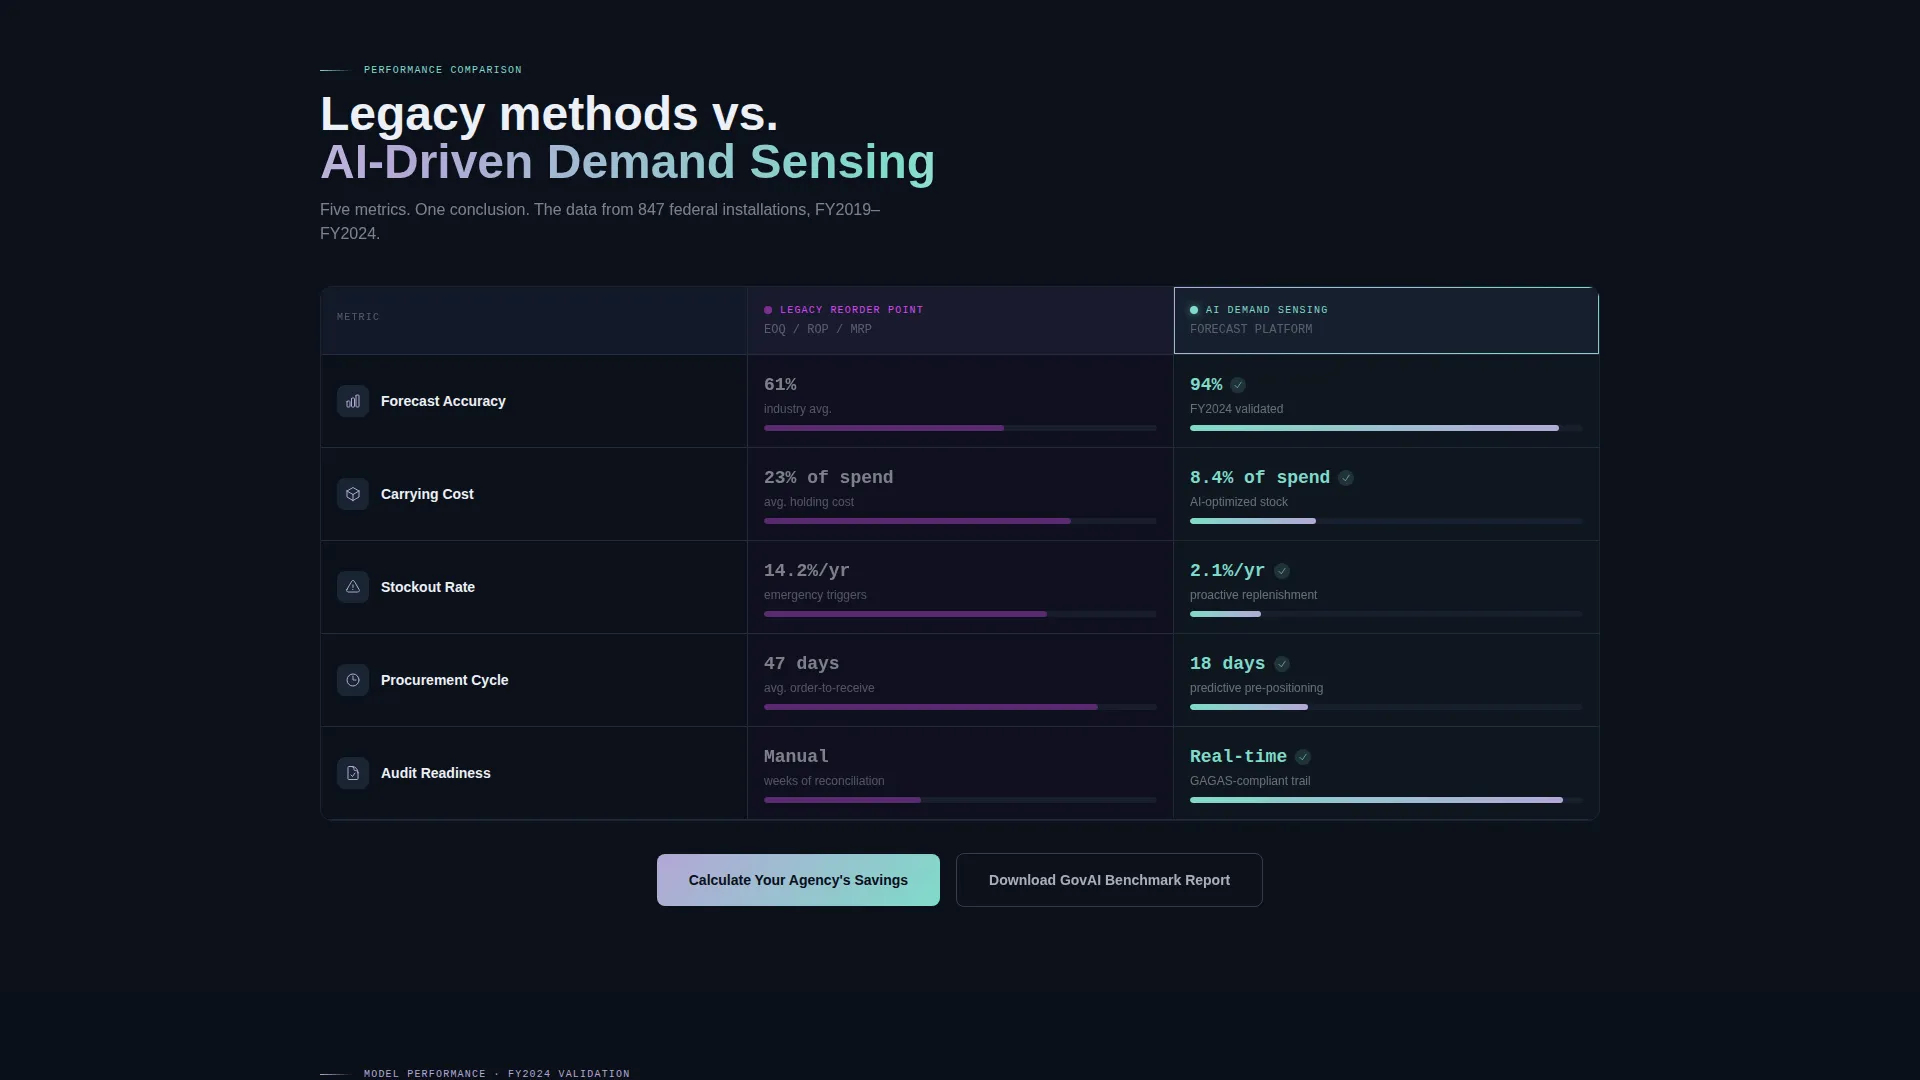
A persistent bento row places "Legacy Reorder Point Methods" directly against "AI-Driven Demand Sensing" across five labeled metrics: forecast accuracy, carrying cost, stockout rate, procurement cycle time, and audit readiness. This row does the persuasive work before any call to action is presented.
Dual call to action Architecture
The primary call to action, "Calculate Your Agency's Savings," is anchored to the top estimator and repeated after the comparison grid. A secondary path offers "Download the GovAI Benchmark Report" behind a gated field requiring a.gov or.mil email address and agency name.
Stats-First Scroll Experience
Every scroll depth opens with a hard number before any explanatory copy arrives. This Stats-First Impact creative direction is built into the tile sequencing, so the data leads and the narrative follows, matching the analytical read pattern of procurement professionals.
AI Iridescent Visual Identity
The color system uses deep federal midnight (#0B0F1A) as the base, iridescent lilac (#B4A7D6) shifting to holographic teal (#7FDBCA) across gradient surfaces, signal white (#EDF0F5) for data cards, and anomaly magenta (#D946EF) reserved exclusively for alerts and interactive hotspots. Every shimmer is purposeful against an otherwise austere background.
Page sections overview
| Section | Purpose |
|---|---|
| Header Estimator Tool | Captures inputs and renders personalized savings projection |
| Industry Waste Tiles | Opens scroll with hard DOD inventory waste figures |
| Per-Base Breakdown | Translates national figures into agency-level context |
| Demand Curve Animation | Shows before-and-after forecasting accuracy visually |
| Comparison Grid Row | Contrasts legacy methods against AI demand sensing |
| Primary call to action Block | Repeats savings calculator prompt after comparison proof |
| Benchmark Report Gate | Collects.gov/.mil email behind secondary content offer |
Design & branding system
The Forecast template uses an AI Iridescent color system built on institutional restraint with precise moments of futuristic contrast. The palette is designed to feel like a classified intelligence briefing viewed through a prism, credible and authoritative with just enough light to signal technological edge.
- Base and surface colors: deep federal midnight (#0B0F1A) for backgrounds, signal white (#EDF0F5) for data cards, and iridescent lilac-to-teal gradients (#B4A7D6 to #7FDBCA) across interactive and gradient surfaces
- Accent and alert color: anomaly magenta (#D946EF) used exclusively for alerts, pulsing borders on the estimator result card, and interactive hotspot highlights
- Theme and layout direction: Directory and Discovery theme expressed through a bento grid layout where each tile functions as a labeled, navigable data object
Mobile & speed optimization
The bento grid layout is structured to reflow naturally across viewport sizes, keeping data tiles readable and the estimator functional without losing the visual sequencing that drives the scroll experience.
- Tile stagger animations and the estimator render are contained within the layout grid, so they adapt to narrower screens without breaking the Stats-First reveal sequence
- Large, government-formatted fiscal-year numbers and the comparison table are set in a type scale that remains legible on small screens
- The gated report form uses minimal fields, keeping the mobile conversion path short and uncluttered
How this template helps you convert
The Forecast template converts by making the financial case before asking for anything. Every structural choice reduces friction for a buyer who needs internal justification, not just inspiration.
- The header estimator personalizes the value proposition in seconds. Visitors see their own agency's projected savings figure before reading a single marketing claim, which grounds the conversation in numbers they can defend to a budget committee.
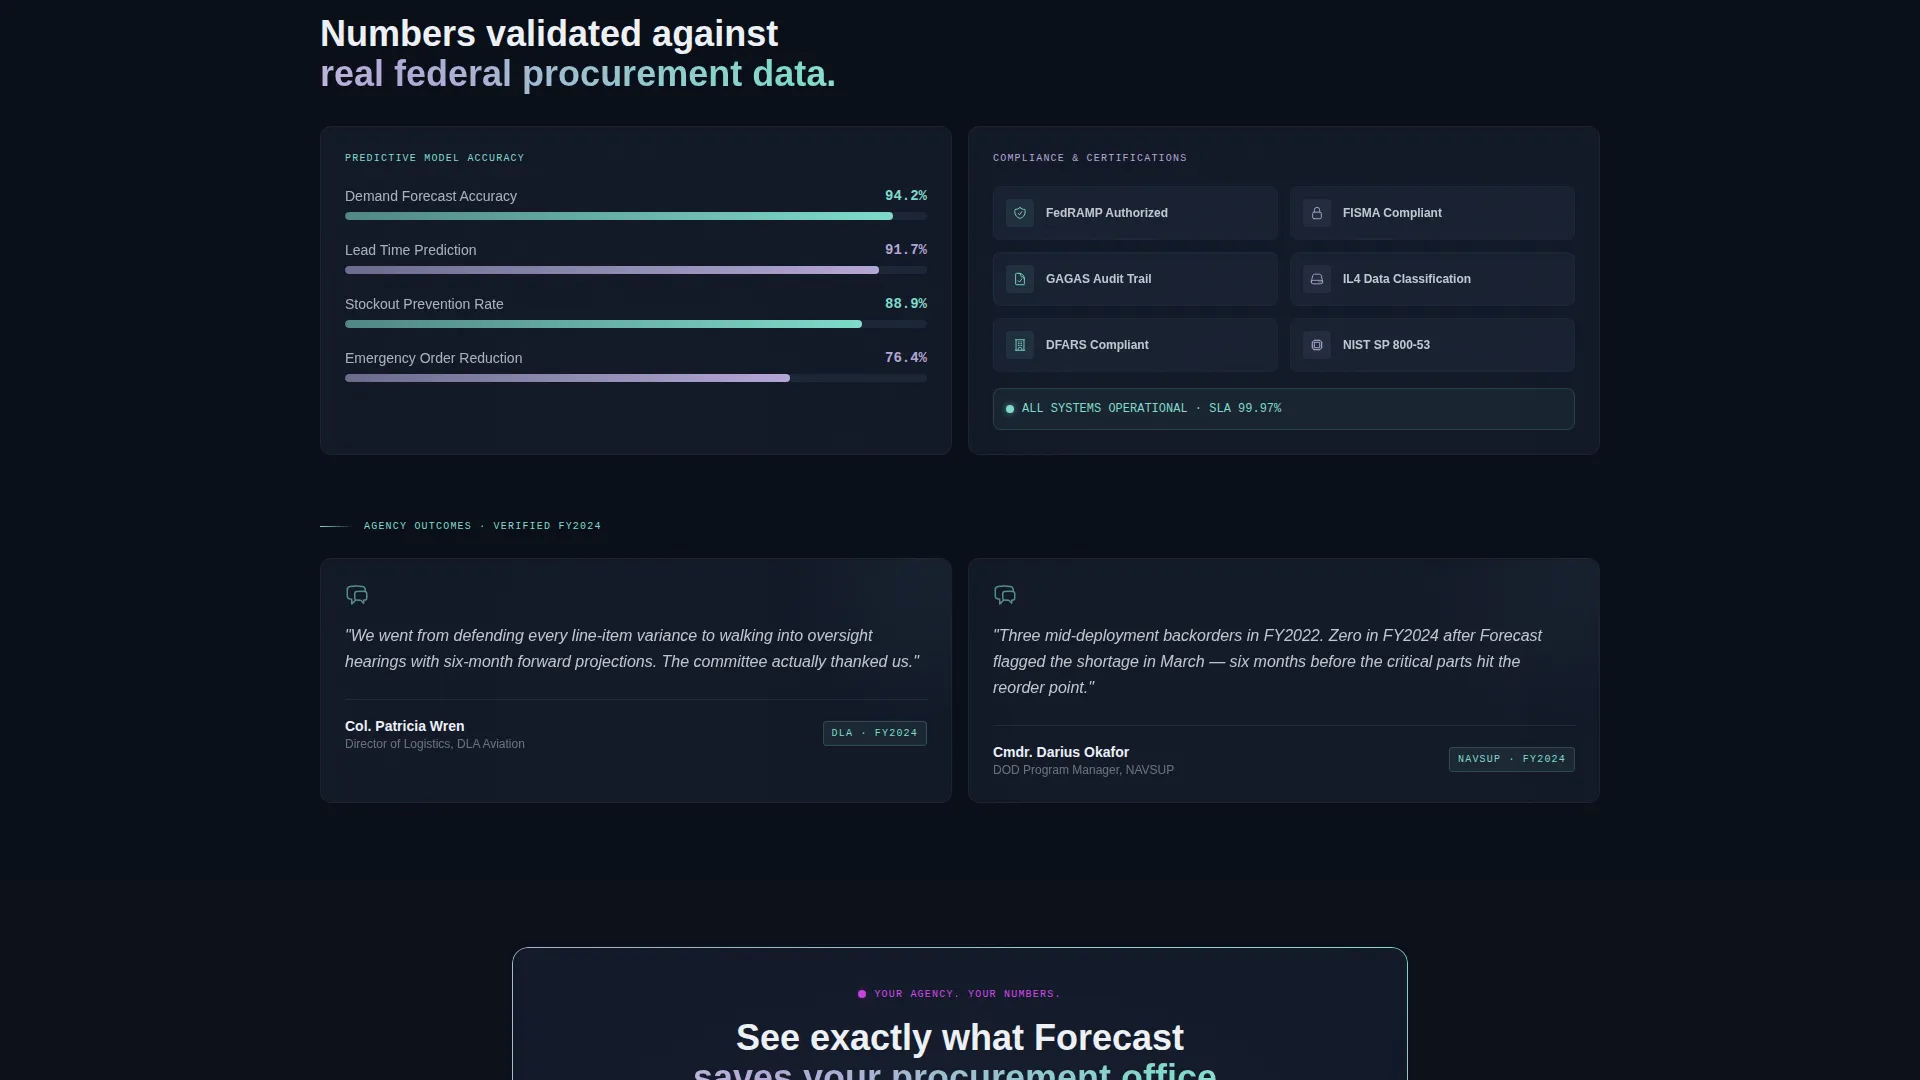
- The staggered proof tile sequence and the comparison grid build layered credibility. By the time the primary call to action appears, the visitor has already processed the industry waste scale, the per-agency breakdown, and a five-metric head-to-head comparison.
Other information about this template
The Forecast template is designed specifically for the government AI inventory forecasting space. It suits vendors, contractors, and platform teams operating in federal and state procurement technology markets.
- The template style is a bento grid, which organizes dense data into distinct, scannable tiles rather than long-form prose sections
- The header concept is a Calculator and Estimator, a format shown to increase engagement on pages where return on investment is the primary buying criterion
- The landing page direction is Comparison and Versus, making it well suited for markets where buyers are actively evaluating legacy methods against newer AI-driven alternatives
- This template is built under the Directory and Discovery theme, which supports a layout where every tile is a named, purposeful object rather than decorative content

Theme
Directory & Discovery
Creative direction
Stats-First Impact
Color system
AI Iridescent
Style
Bento Grid
Direction
Comparison/Versus
Page Sections
Live Header Savings Estimator
Staggered Bento Proof Tile Grid
Comparison Split-view Row
Dual Conversion Path Design
Stats-first Scroll Architecture
AI Iridescent Color System
Related questions
Who is the Forecast template designed for?
Does the estimator tool require custom development to function?
Can I update the comparison grid metrics for my platform?
What makes this different from a standard SaaS landing page template?
Is the gated benchmark report download included in the template?



