Synth - Brutalist AI Research Landing Page Template
Synth is a brutalist dashboard landing page built for generative AI research labs. It leads with a tab-switching benchmark grid, a live model comparison builder, and interactive inference cost calculators. The design runs on void black and electric indigo with monospaced type throughout. Every section hands visitors a tool to interrogate the data themselves before any conversion is asked.
by Rocket studio
Quick summary
Synth is a single-page brutalist dashboard template for a generative AI research lab. It opens with a feature tab switcher that surfaces live benchmark grids, then deepens into an interactive model comparison builder with toggleable competitor columns, draggable cost sliders, and expandable evaluation methodology cards. The visual language is dark, monospaced, and strictly functional.
Who this template is for
This template is built for technical audiences who distrust marketing and trust numbers. It speaks directly to the people responsible for picking and validating foundation models.
- Machine learning engineers who need to compare inference latency and token costs side by side
- Chief technology officers weighing open-weight models against closed ones and needing data to justify the call
- Research leads running their own internal evaluations and benchmarking context window performance
What problem this template solves
Most AI product pages lead with hero images and vague capability statements. Technical buyers skip past those sections immediately. They want raw benchmark scores, reproducible methodology, and direct access to the model before they commit.
- Glossy marketing pages lose credibility with engineers who know what the numbers should look like
- Scattered documentation makes it hard for a research lead to compare models in one place
- Gated claims without verifiable data stall procurement decisions before they start
What you get with this template
The template delivers a complete, scroll-driven dashboard landing page where interactivity replaces passive reading. Every component is built to let a skeptical technical buyer poke the data themselves.
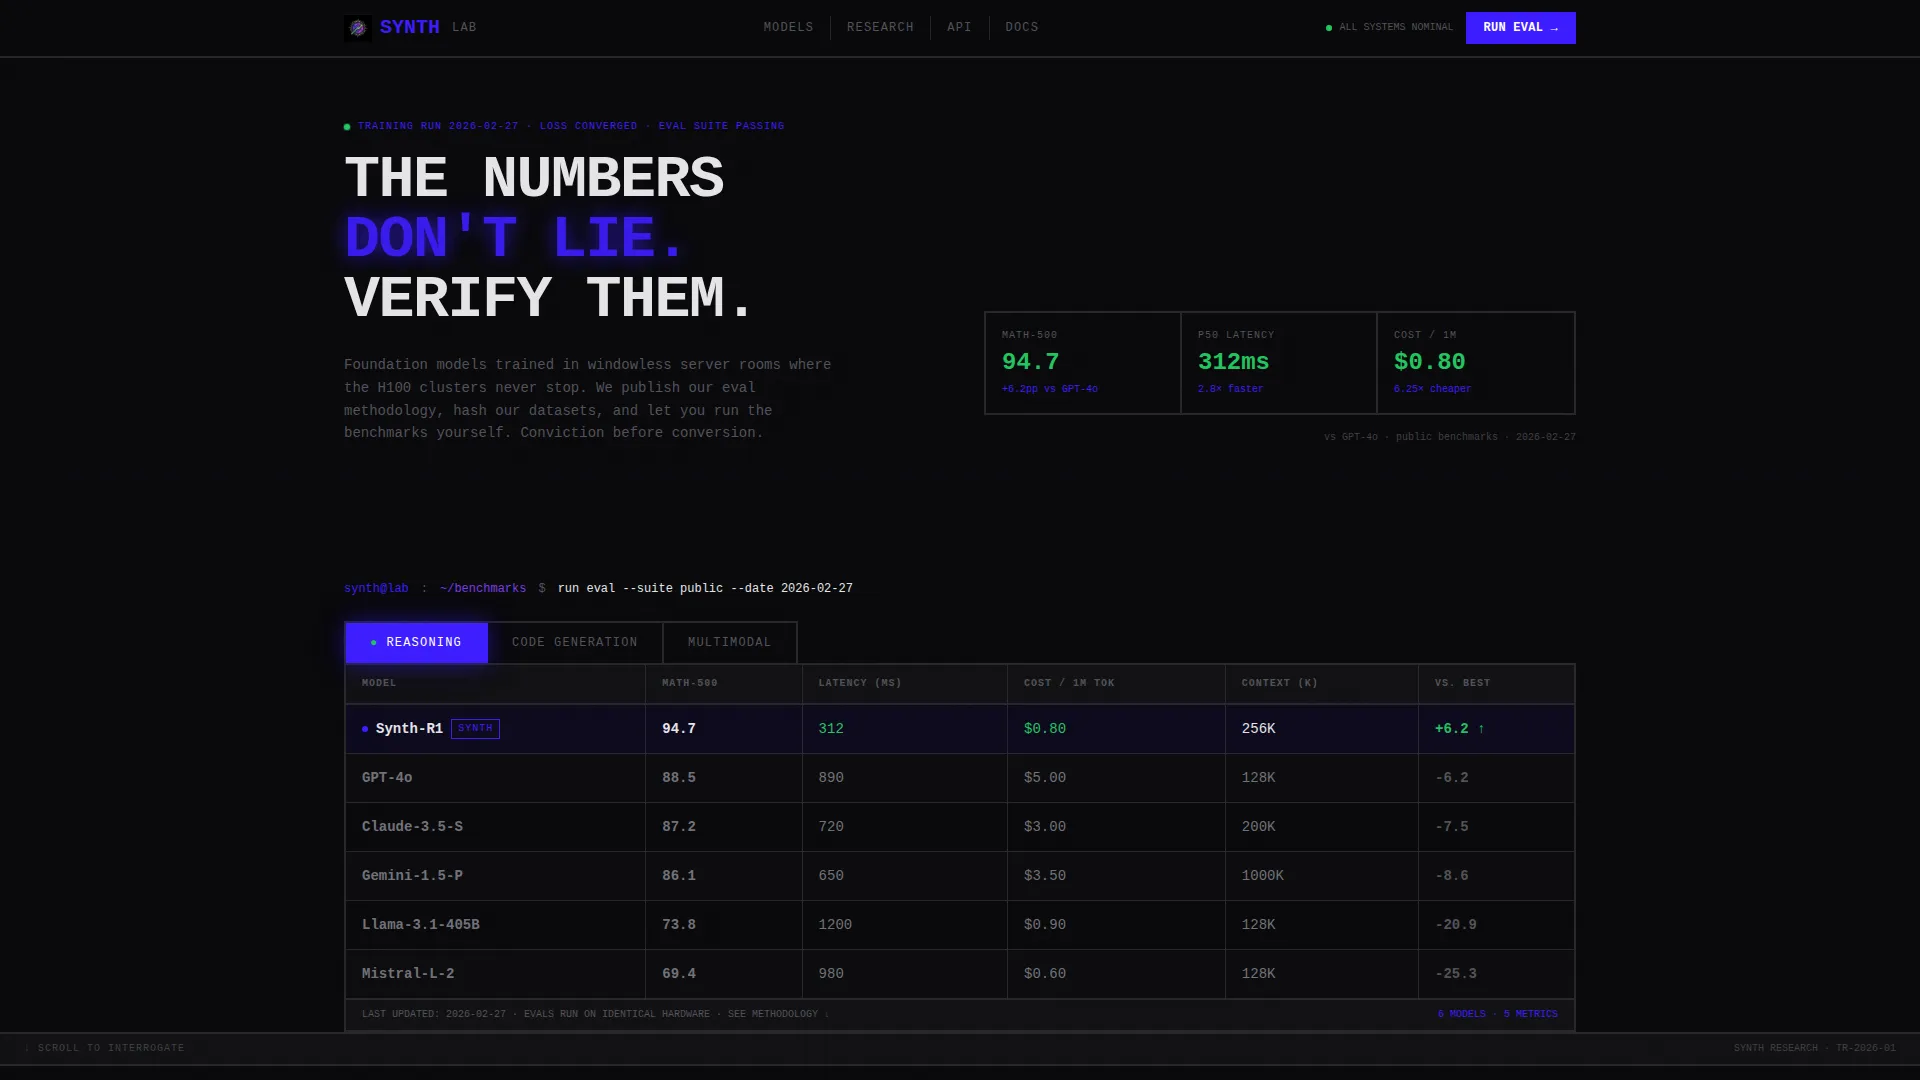
- A three-tab benchmark grid header that animates live score counts across Reasoning, Code Generation, and Multimodal categories
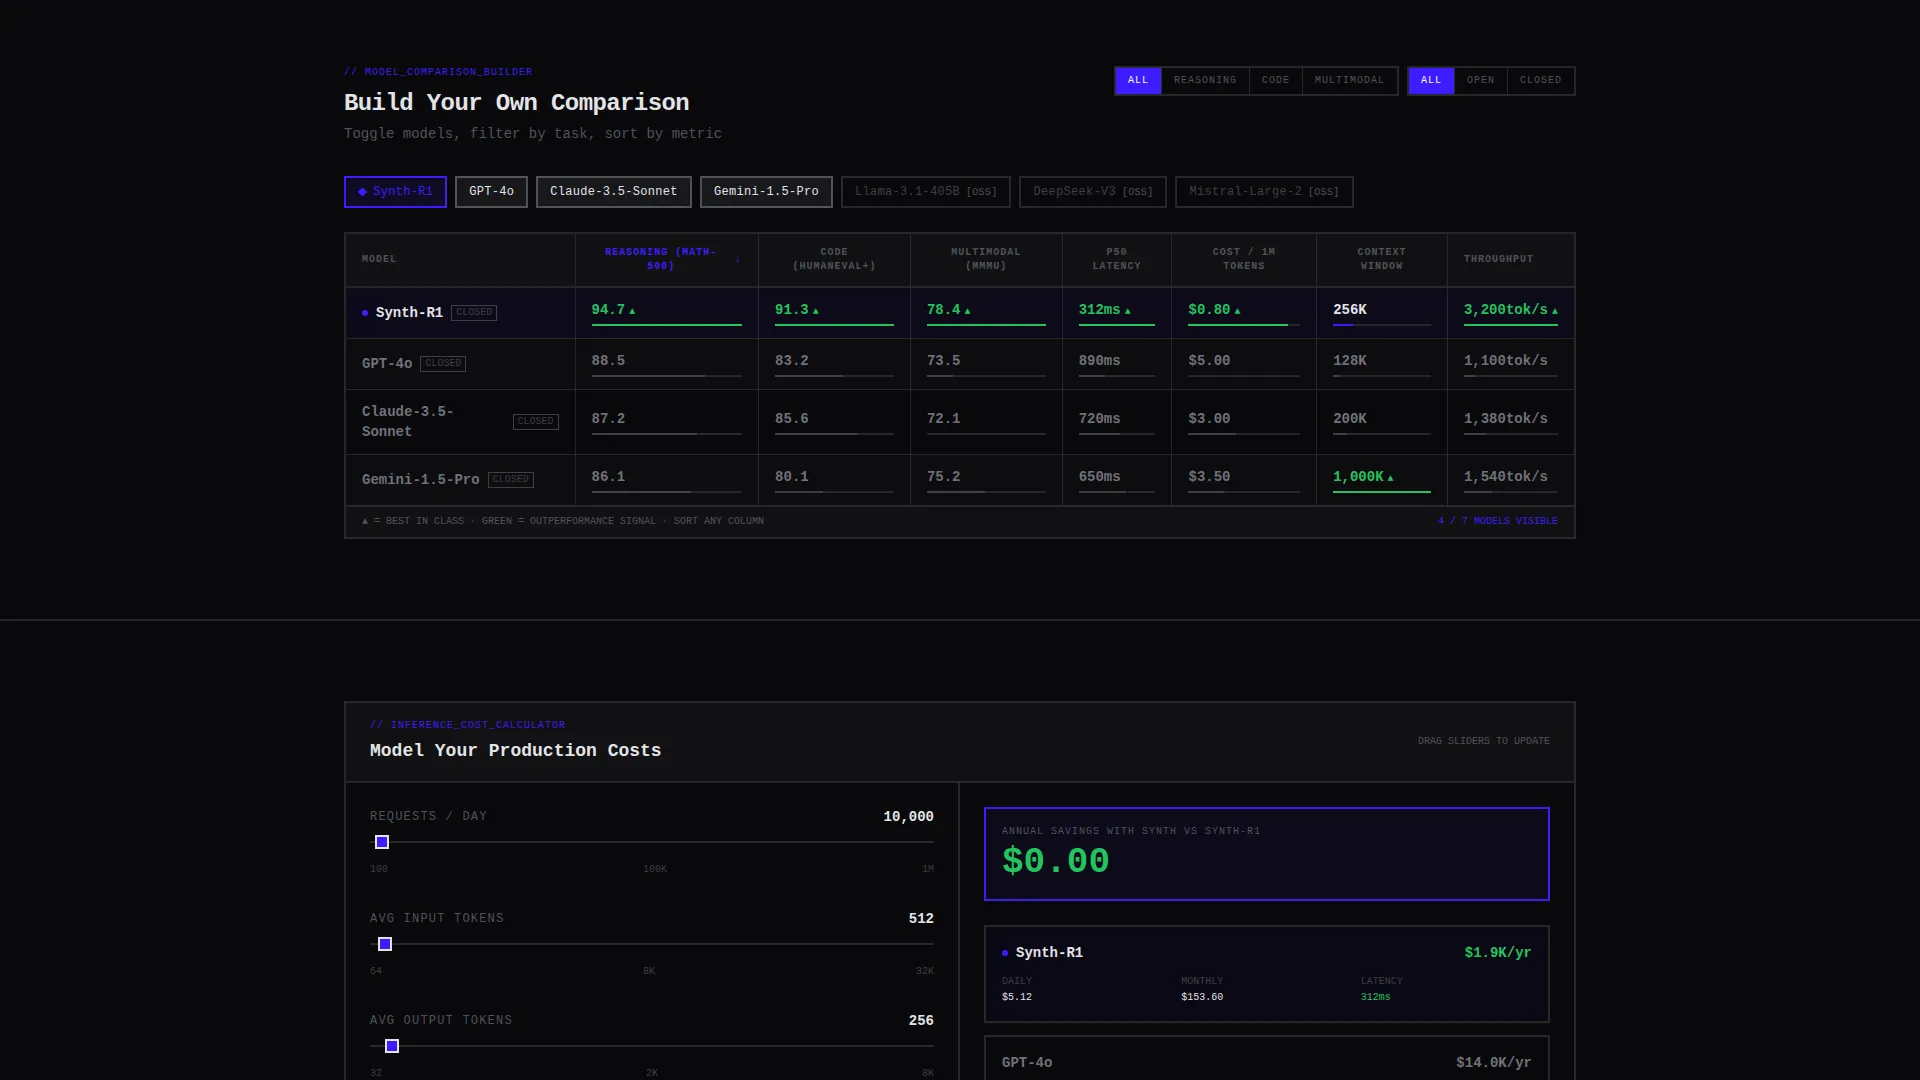
- A model comparison builder with toggleable competitor columns, task-type filters, and sortable metrics
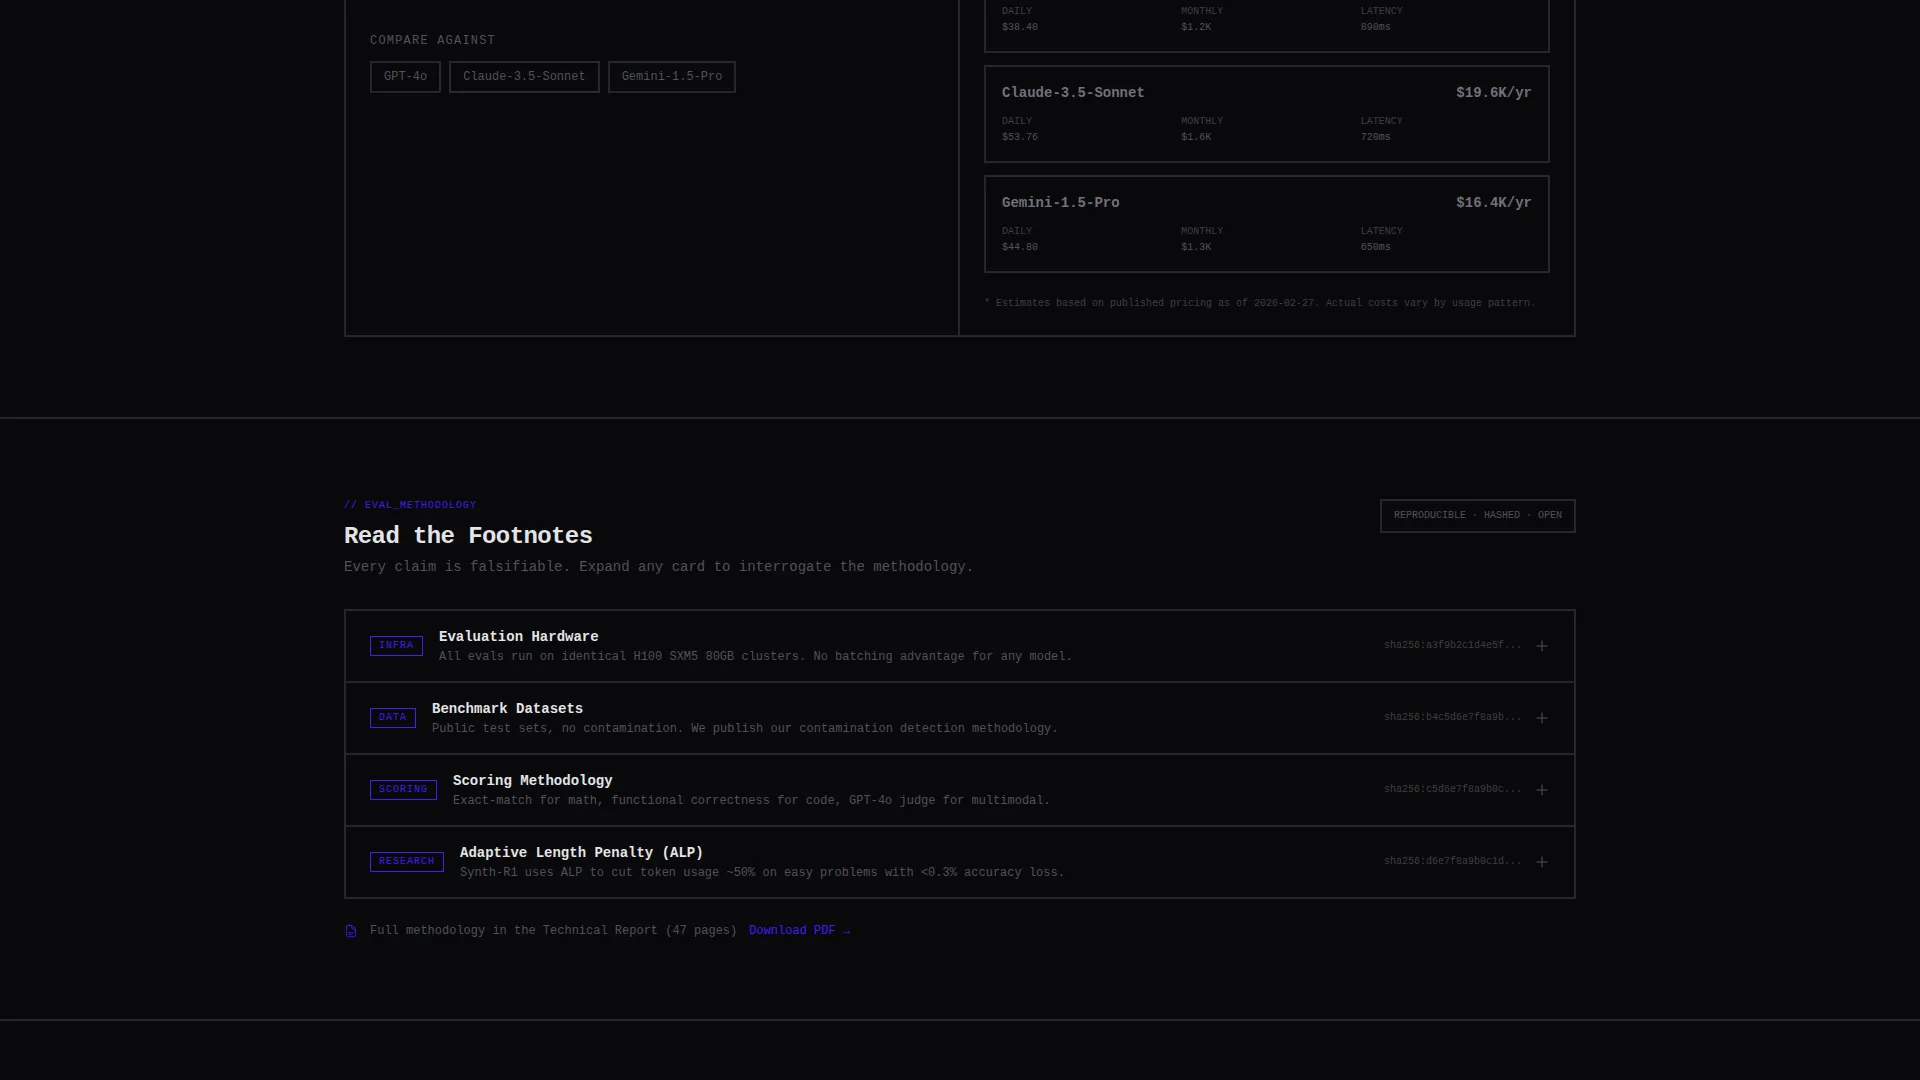
- An inference cost calculator with draggable sliders, zoomable architecture diagrams, and expandable evaluation methodology cards
- Two conversion paths: a primary "Run Your Own Eval" API sandbox call to action and a secondary "Download the Technical Report" gated PDF form
Feature list
This template packages several interactive components that work together to build conviction through exploration rather than assertion.
Tab-Switching Benchmark Grid
Three labeled tabs sit inside a hard-bordered brutalist container. Clicking any tab instantly swaps the live data grid below it. Numbers count up to their final values on each switch, giving the leaderboard a live-refresh feel without a page reload.
Model Comparison Builder
Visitors can toggle competitor columns on and off, filter rows by task type, and sort the entire grid by whichever metric matters most to them. The builder puts the visitor in control of the comparison rather than presenting a curated highlight reel.
Inference Cost Calculator
A draggable slider lets users input their own usage assumptions and watch the cost output update in real time. This moves the conversation from abstract pricing tiers to a concrete number tied to the visitor's own workload.
Zoomable Architecture Diagrams
Technical diagrams are embedded as zoomable components rather than static images. A research lead or engineer can inspect model architecture details at the level of precision they actually need.
Expandable Eval Methodology Cards
Each benchmark claim links to an expandable card that explains exactly how the evaluation was run. This satisfies the skeptics who read footnotes and builds trust through transparency rather than assertion.
API Sandbox call to action with Split-Pane Output
The primary call to action loads a pre-populated prompt into an API sandbox. A split-pane view shows Synth's output alongside a leading competitor's output in real time, converting conviction into action without requiring a sales call.
Page sections overview
| Section | Purpose |
|---|---|
| Tab Benchmark Header | Switches live score grids across three capability categories |
| Comparison Builder | Lets visitors filter, toggle, and sort model metrics |
| Cost Calculator | Translates usage inputs into real-time inference cost estimates |
| Architecture Diagrams | Provides zoomable technical diagrams for deeper inspection |
| Eval Methodology Cards | Expands benchmark context for skeptical, detail-oriented readers |
| API Sandbox call to action | Primary conversion point with live split-pane model output |
| Technical Report Gate | Secondary conversion form collecting a single work email |
Design & branding system
The visual identity is built on a dark-mode IDE aesthetic. Every color, typeface choice, and spacing decision reinforces the sense that you are looking at a precision instrument, not a marketing brochure.
- Color system uses void black (#09090B) as the base, deep indigo (#3D1DFF) and phosphor violet (#7C3AED) for interactive elements, raw titanium (#E4E4E7) for inactive states, and signal green (#22C55E) used exclusively for outperformance indicators
- Typography runs entirely in monospaced typeface with no decorative serifs, no gradients, and no illustrations anywhere on the page
- Active tabs glow electric indigo against the black background; inactive tabs remain titanium, creating a clear visual hierarchy that feels native to a dark-mode development environment
Mobile & speed optimization
The template is structured for fast visual parsing on any screen size. The brutalist grid layout translates naturally to narrower viewports without losing the data-first hierarchy.
- Monospaced grid cells and hard borders maintain visual clarity at reduced widths without relying on decorative scaling effects
- Interactive components such as the comparison builder and cost calculator are designed to remain functional and legible on touch-screen devices
- The absence of hero images, gradients, and illustrations reduces visual load and keeps the data grid as the immediate focal point on every device
How this template helps you convert
Synth converts by removing the gap between a claim and its proof. Every conversion step is earned through direct interaction, not persuasion.
- The benchmark grid and comparison builder give technical visitors something to do within seconds of arriving, which holds attention and builds engagement through exploration rather than passive scrolling.
- The inference cost calculator makes the value concrete and personal by anchoring the conversation to the visitor's own usage numbers before any sales conversation begins.
- Both conversion paths appear only after the visitor has already interrogated the data, so the "Run Your Own Eval" sandbox and the technical report download feel like natural next steps rather than interruptions.
Other information about this template
This section covers additional context that helps teams plan their build and understand where this template fits within a broader product or research communication strategy.
- The template is categorized under Generative AI Technology and is specifically designed for the generative AI research lab niche
- The Bold Brutalist theme and Electric Indigo color system are part of a matched intersection set that aligns template style, creative direction, and header concept into a cohesive visual system
- The Interactive Explorer creative direction means that scroll behavior is designed to hand the visitor controls progressively, not simply reveal more content
- The Comparison/Versus landing page direction makes this template well suited for any AI lab that needs to position its models transparently against alternatives in the current foundation model market

Theme
Bold Brutalist
Creative direction
Interactive Explorer
Color system
Electric Indigo
Style
Dashboard/Data Grid
Direction
Comparison/Versus
Page Sections
Tab-switching Live Benchmark Grid
Interactive Model Comparison Builder
Draggable Inference Cost Calculator
Zoomable Architecture Diagrams
Expandable Eval Methodology Cards
Split-pane API Sandbox Call to Action
Related questions
Who is the primary audience for the Synth template?
Can the benchmark tabs be customized for different capability categories?
How does the secondary conversion path work?
Does the template include the API sandbox functionality out of the box?
Is this template suitable for a lab that only covers one model category?



