Golf Booking Landing Page Template | Dashboard SaaS Design
Tee is a dashboard-style golf booking landing page built for course operators who lose revenue every time a tee time goes unfilled. It opens with a live Revenue Estimator, moves into an industry-data briefing, and closes with a direct app download call to action. Every section is designed to turn a course manager's curiosity into a conversion.
by Rocket studio
Quick summary
Tee is a single-page, data-driven landing page template for a golf booking system. It leads with an interactive Revenue Estimator, flows through an industry-report briefing packed with booking-crisis data, and ends with a focused app download prompt. The design runs on a deep command-center teal palette that feels like a SaaS dashboard at dawn.
Who this template is for
This template is built for teams launching a golf vertical SaaS product that targets course operators directly. It speaks to the specific pressures of running a busy tee sheet at scale.
- Course managers at municipal and semi-private clubs running 50,000 or more rounds per year
- Assistant professionals juggling multiple legacy tee-sheet systems at once
- Regional golf groups consolidating several courses onto one unified booking platform
What problem this template solves
Empty tee times are quiet revenue losses that compound every single day. Operators often have no clear visual proof of what those gaps cost them until they see a number calculated in real time.
- No single view connects no-show rates, green fee pricing, and lost annual revenue in one place
- Legacy tee-sheet software comparisons are hard to find in a format that is immediately credible
- Course managers need a reason to act now, not after a lengthy sales call
What you get with this template
This template delivers a complete, section-led landing page that walks a course operator from problem awareness to app download in one confident scroll. Each section is a self-contained dashboard card.
- A live Revenue Estimator header with animated data visualization and a personalized output line
- An industry-report scroll section with heat maps, trend lines, and a legacy-versus-modern comparison grid
- Dual app download calls to action with smart device detection plus a one-field lead capture form
Feature list
This landing page is built around active data components and editorial credibility. Every feature below comes directly from the template brief.
Live Revenue Estimator Header
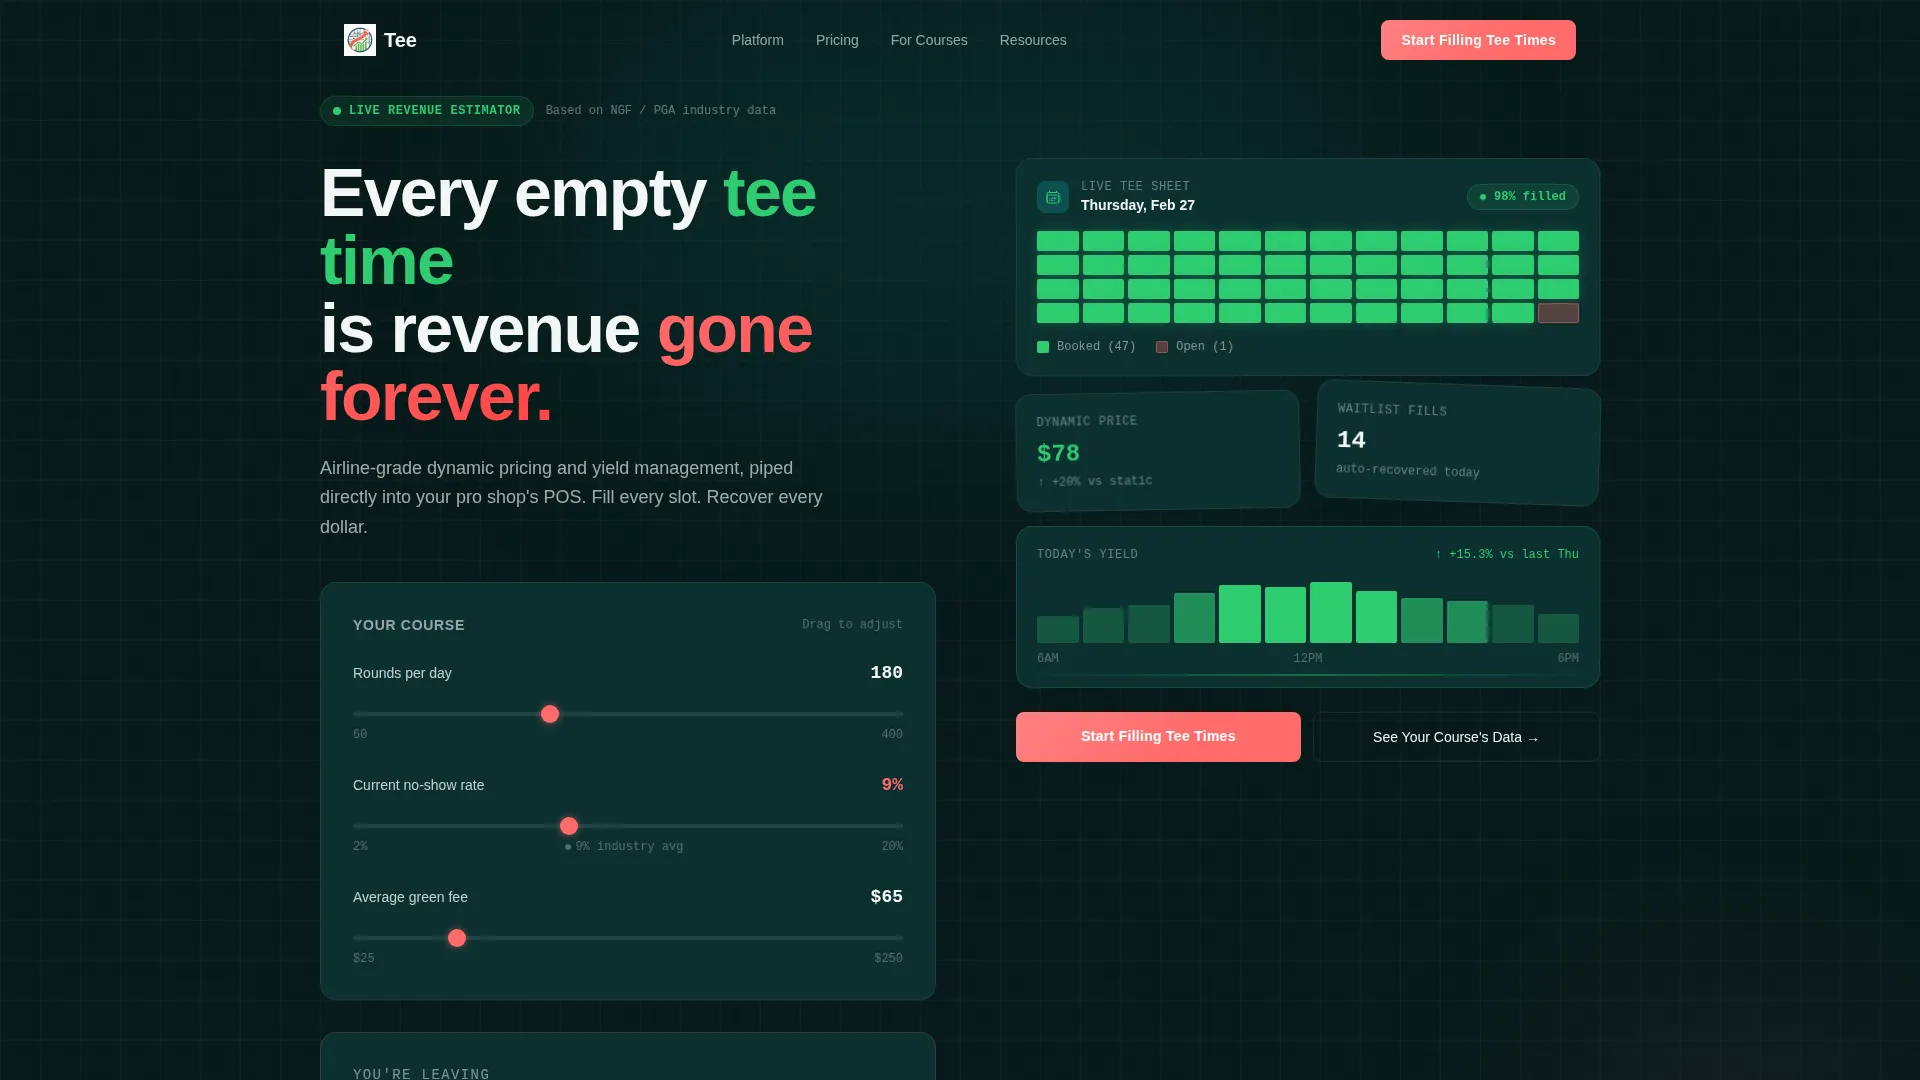
Visitors enter their course's average rounds per day, current no-show rate, and green fee price. An animated visualization calculates recovered annual revenue in real time, with the figure ticking upward in catalyst coral inside a monospaced financial-terminal font. The closing line reads: "You're leaving $_____ on the fairway."
Industry-Report Data Briefing
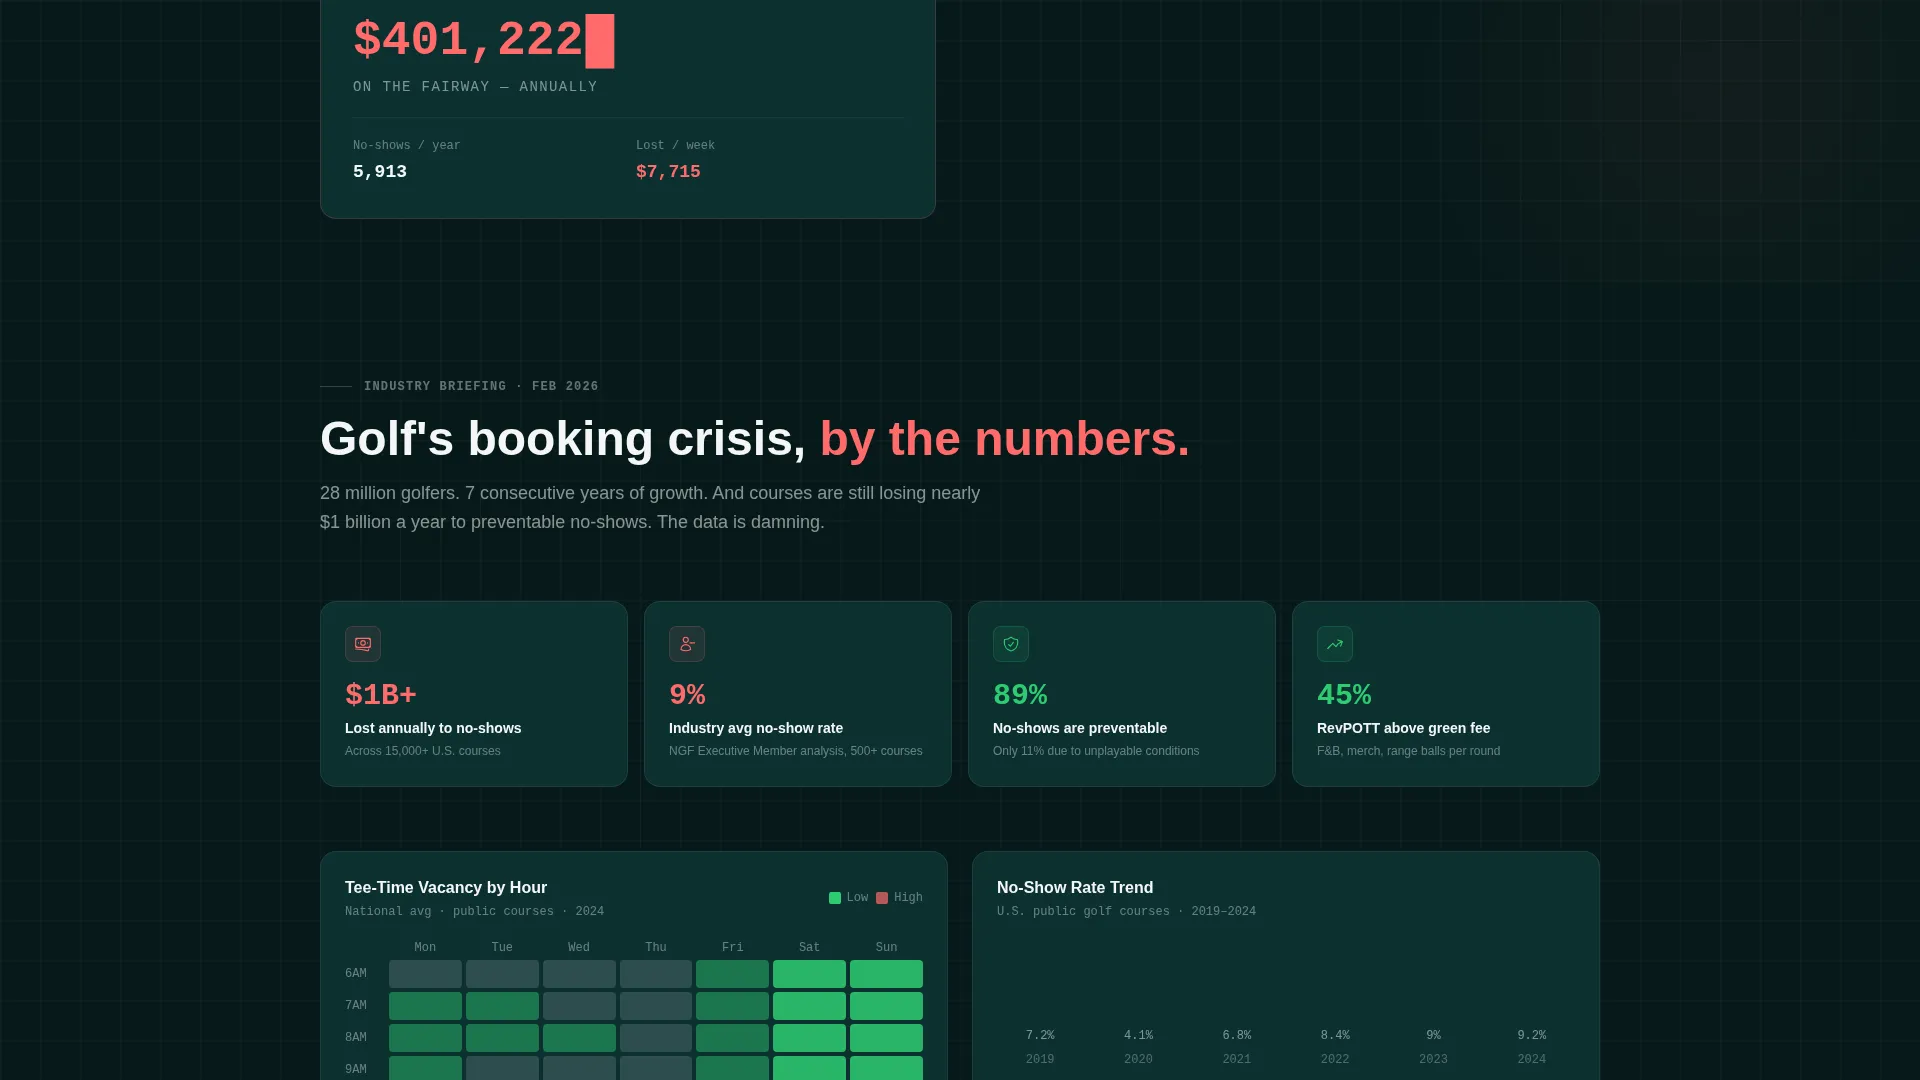
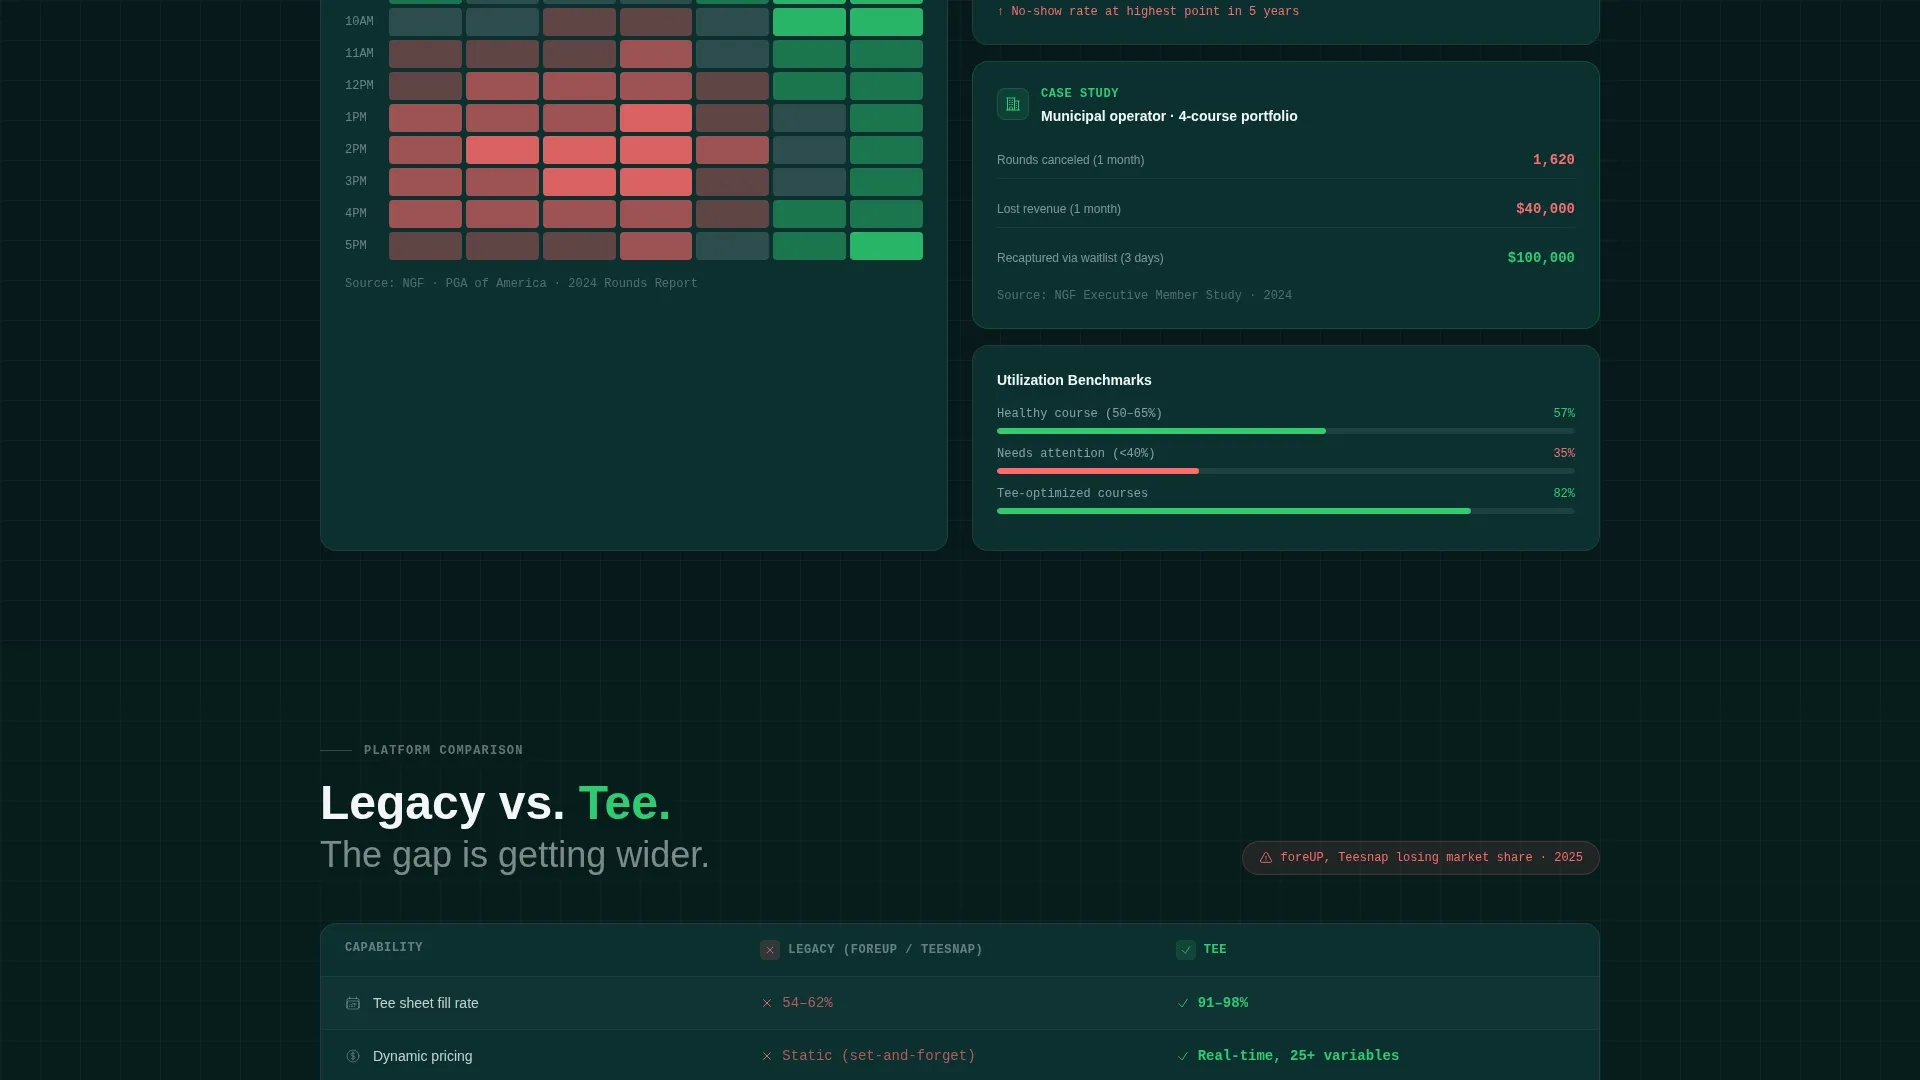
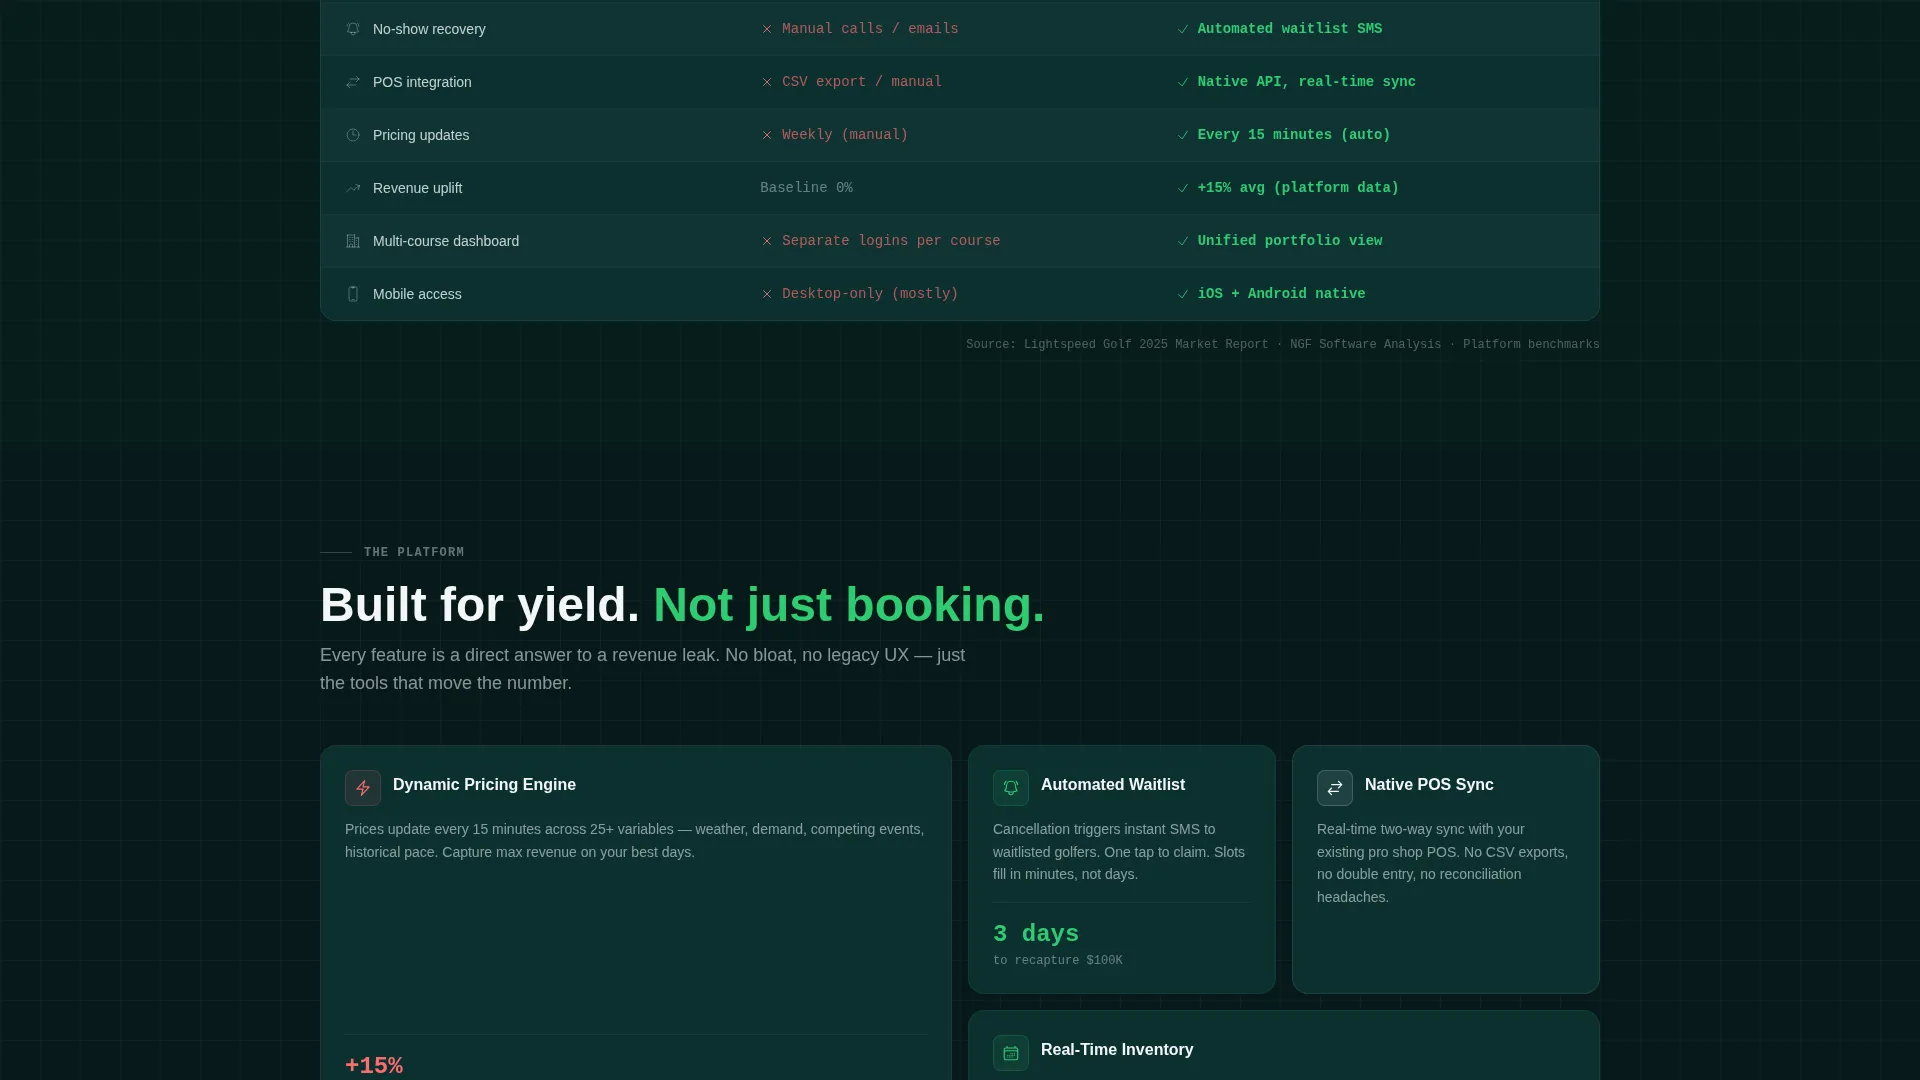
The page scrolls like a data-driven briefing deck on golf's booking crisis. Sections include a heat map of national tee-time vacancy rates by hour, a trend line of no-show percentages across course types, and a comparison grid of legacy tee-sheet software versus modern fill rates, all sourced from National Golf Foundation and PGA data references.
Dashboard Card Layout
Each content section is presented as a distinct dashboard card. The layout mirrors a command-center interface, making complex data easy to scan. Product features arrive after the data sections, framed as direct answers to the evidence already presented.
Dual App Download Call to Action
The primary conversion path is "Start Filling Tee Times," linking to both the App Store and Google Play. Smart device detection routes mobile visitors to the correct store automatically, reducing friction at the final step.
Personalized Vacancy Report Form
A secondary lead capture path offers "See Your Course's Data." A one-field form with course name autocomplete generates a personalized vacancy report. This delivers immediate value to the visitor while capturing a qualified lead for the product team.
Teal Catalyst Color System
The palette uses deep command-center teal, live-data white, revenue-positive green, and catalyst coral reserved for alerts, key metrics, and calls to action. The color logic is functional: coral appears only where action or urgency is required, keeping every other element calm and credible.
Page sections overview
| Section | Purpose |
|---|---|
| Revenue Estimator Header | Personalizes the cost of inaction with a live animated calculation |
| "You're Leaving $___" Line | Anchors the financial stakes in a single, impossible-to-ignore stat |
| Vacancy Heat Map | Shows national tee-time gaps by hour to establish the crisis scale |
| No-Show Trend Line | Visualizes no-show rate patterns across different course types |
| Legacy versus. Tee Grid | Compares fill rates between old software and the modern platform |
| Product Feature Cards | Presents each feature as a direct data-backed solution |
| App Download call to action | Drives conversion to App Store and Google Play with device detection |
| Vacancy Report Form | Captures leads via a one-field course name autocomplete input |
Design & branding system
The visual identity follows a Startup Velocity theme built around the Teal Catalyst color system. The palette is functional and intentional, drawing from a SaaS command-center aesthetic.
- Deep command-center teal (#0D4F4F) anchors the background and navigation for a focused, dark interface
- Live-data white (#F4F7F7) handles body text and data labels for high contrast readability
- Revenue-positive green (#2ECC71) marks positive outcomes and filled-slot indicators throughout the data sections
- Catalyst coral (#FF6B6B) is reserved strictly for alerts, calls to action, and key metrics that demand immediate attention
- Monospaced typography is used for the Revenue Estimator output, reinforcing a financial-terminal credibility
Mobile & speed optimization
The dashboard card layout is built to translate cleanly from a wide command-center desktop view to a single-column mobile scroll. Operators checking this page on a phone between rounds should encounter no layout friction.
- Stacked dashboard cards reflow naturally into a vertical mobile reading order
- Smart device detection on the app download call to action routes visitors to the correct store without an extra tap
- The one-field vacancy report form stays fully accessible on small screens without requiring complex input
How this template helps you convert
The page is structured to close the gap between curiosity and commitment before the visitor reaches the bottom. Each phase of the scroll earns the next click.
- The Revenue Estimator personalizes the cost of inaction the moment a visitor lands, making the value case feel immediate and specific to their course rather than generic.
- The industry-report data sections build credibility by presenting real-world booking-crisis evidence, so by the time the product features appear, the visitor already understands the problem at a data level.
- The dual conversion paths, one for app download and one for a personalized vacancy report, give every visitor a next step that matches their readiness to commit.
Other information about this template
This template is part of a broader set of Golf Vertical SaaS landing page designs built on the Startup Velocity theme. It is designed specifically for teams operating in the golf booking system space.
- The Industry Report creative direction makes this template suitable for conference landing pages, investor pitch support pages, and direct-to-operator acquisition campaigns
- The Calculator/Estimator header concept can be adapted to different green fee ranges and round volumes without changing the underlying layout structure
- The Dashboard/Data Grid template style means the page reads as a credible operational tool rather than a generic marketing page, which builds trust with a professional audience
- This template works alongside other golf booking system and golf vertical SaaS templates in the same marketplace collection
Theme
Startup Velocity
Creative direction
Industry Report
Color system
Teal Catalyst
Style
Dashboard/Data Grid
Direction
App Download
Page Sections
Live Revenue Estimator with Animated Output
Industry-report Data Briefing Sections
Dashboard Card Page Structure
Dual App Download Call to Action
One-field Lead Capture Form
Teal Catalyst Visual Identity
Related questions
Who is this landing page template designed for?
Can I adapt the Revenue Estimator for different pricing models?
What conversion paths does this template include?
Does this template include the data visualizations like the heat map and trend line?
Is this template suitable for a single course or a multi-course platform?



