Vector - Highperformance Database Landing Page Template
Vector is a high-performance vector database landing page template built for teams shipping semantic search, retrieval-augmented generation pipelines, and large-scale similarity search. The Tech Glass design and live interactive header make infrastructure power immediately visible. A two-step lead capture form and gated benchmark report turn serious technical visitors into qualified pipeline.
by Rocket studio
Quick summary
Vector is a single-page, dashboard-style landing page template for a high-performance vector database framework. It pairs a live interactive header with benchmark-driven scroll sections and a two-step lead generation form. The carbon fiber color system and Tech Glass visual identity signal serious infrastructure credibility from the first pixel.
Who this template is for
This template is built for technical teams who need to communicate the real performance of a vector database product. It speaks directly to builders and decision-makers who evaluate infrastructure on numbers, not marketing language.
- Machine learning engineers building retrieval-augmented generation (RAG) pipelines who need proof before they commit
- Platform teams at growth-stage startups evaluating self-hosted alternatives to managed vector database services
- Research organizations running large-scale similarity search across genomic data, satellite imagery, or other high-dimensional datasets
What problem this template solves
Most infrastructure landing pages bury their strongest evidence behind walls of prose. By the time a skeptical engineer finds the benchmark numbers, they have already opened a competitor tab. This template puts performance data front and center and keeps every scroll segment interactive.
- Visitors cannot passively skim past the evidence because each section invites direct interaction with the data
- Technical buyers who want proof before filling out a form get a gated benchmark report as a low-friction second conversion path
- The two-step progressive disclosure form captures dataset size and deployment preference without overwhelming a first-time visitor
What you get with this template
You get a fully structured, single-page lead generation layout designed for a vector database product. Every section is purpose-built to carry technical credibility and move qualified visitors toward a deployment conversation.
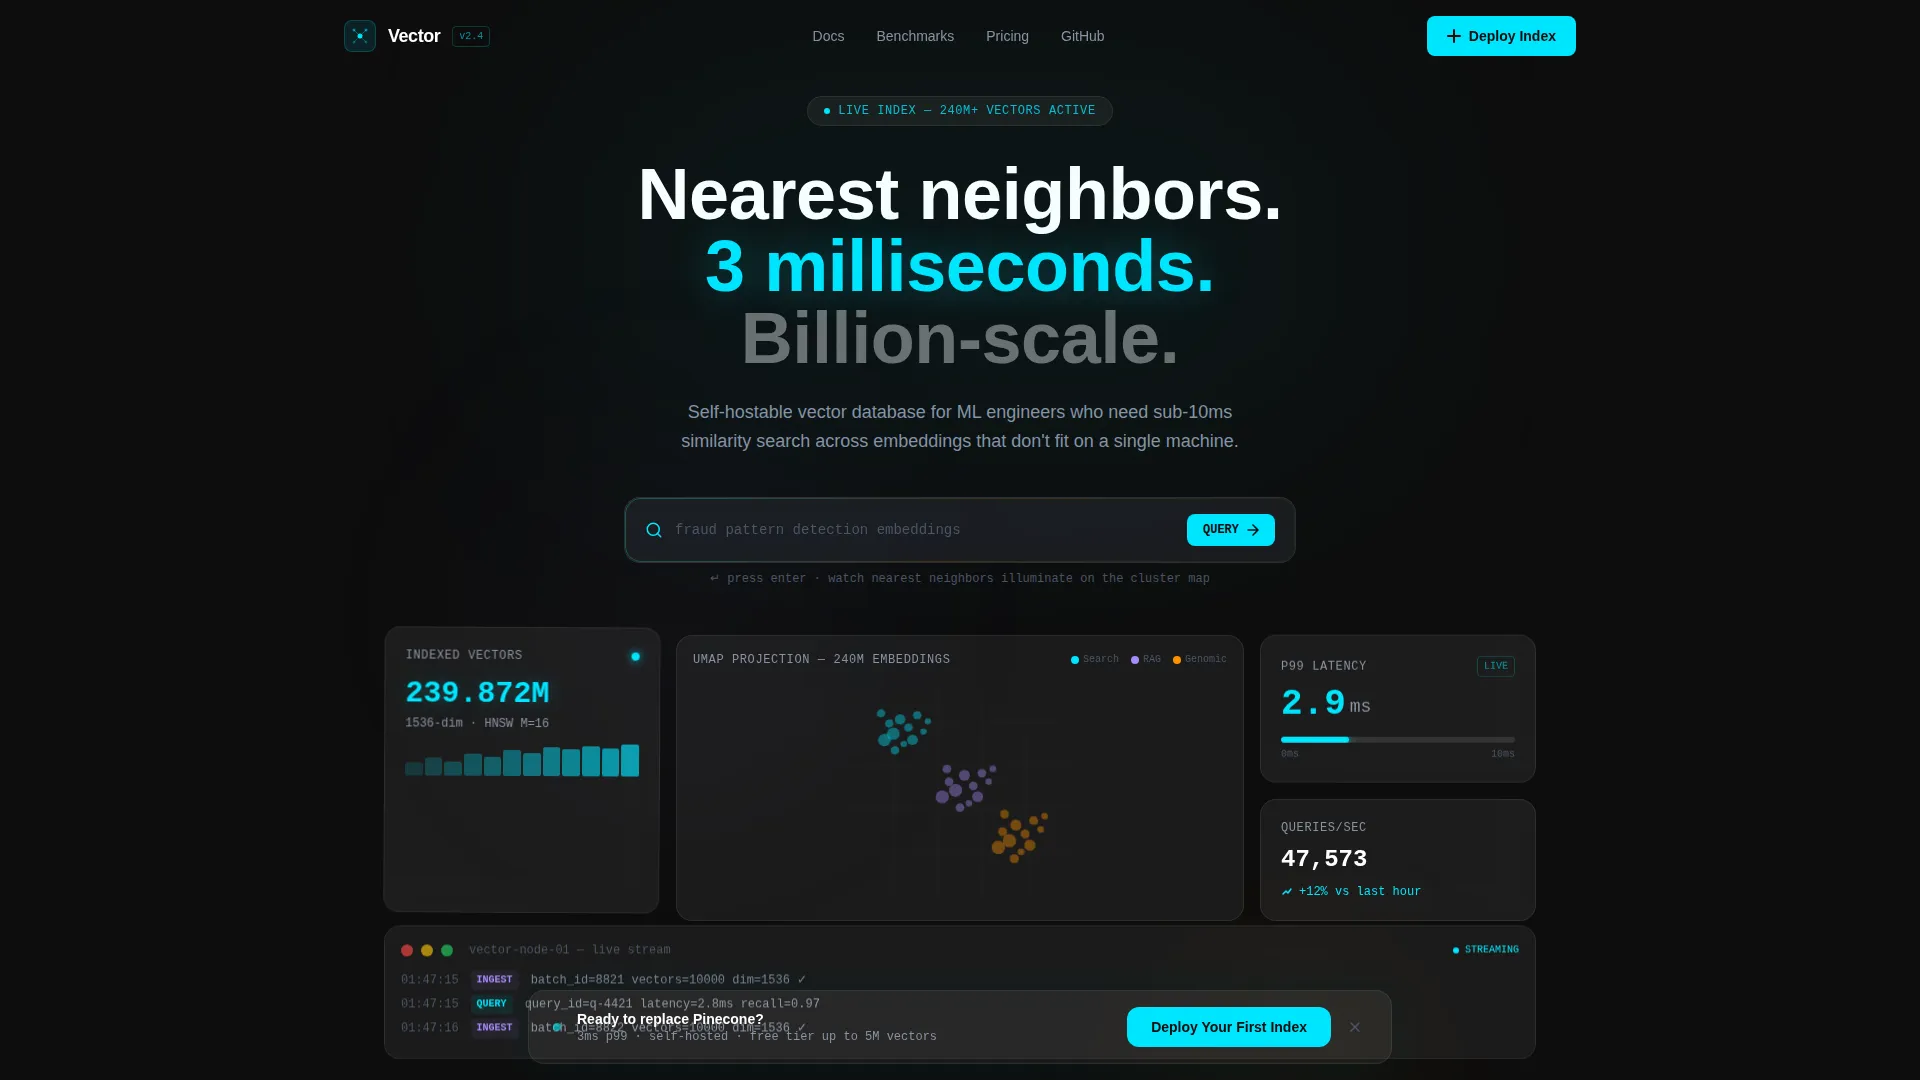
- An interactive header with a live-rendered dashboard, a query search bar, and a real-time cluster visualization
- Benchmark comparison grids, architecture cards, a cost calculator, and case study sections built into the scroll flow
- A primary call-to-action (call to action) placed inside the header and again as a persistent bottom bar that activates after 40 percent scroll depth
Feature list
This template ships with a focused set of interactive and structural components derived directly from the design brief.
Live Interactive Header Dashboard
The hero section renders a live-looking dashboard showing an embedding count ticking past 240 million, a latency gauge holding at 3 milliseconds, and a slowly rotating 3D cluster projection. Visitors can type a natural-language query into the embedded search bar and watch nearest-neighbor points illuminate across the map.
Benchmark Comparison Data Grid
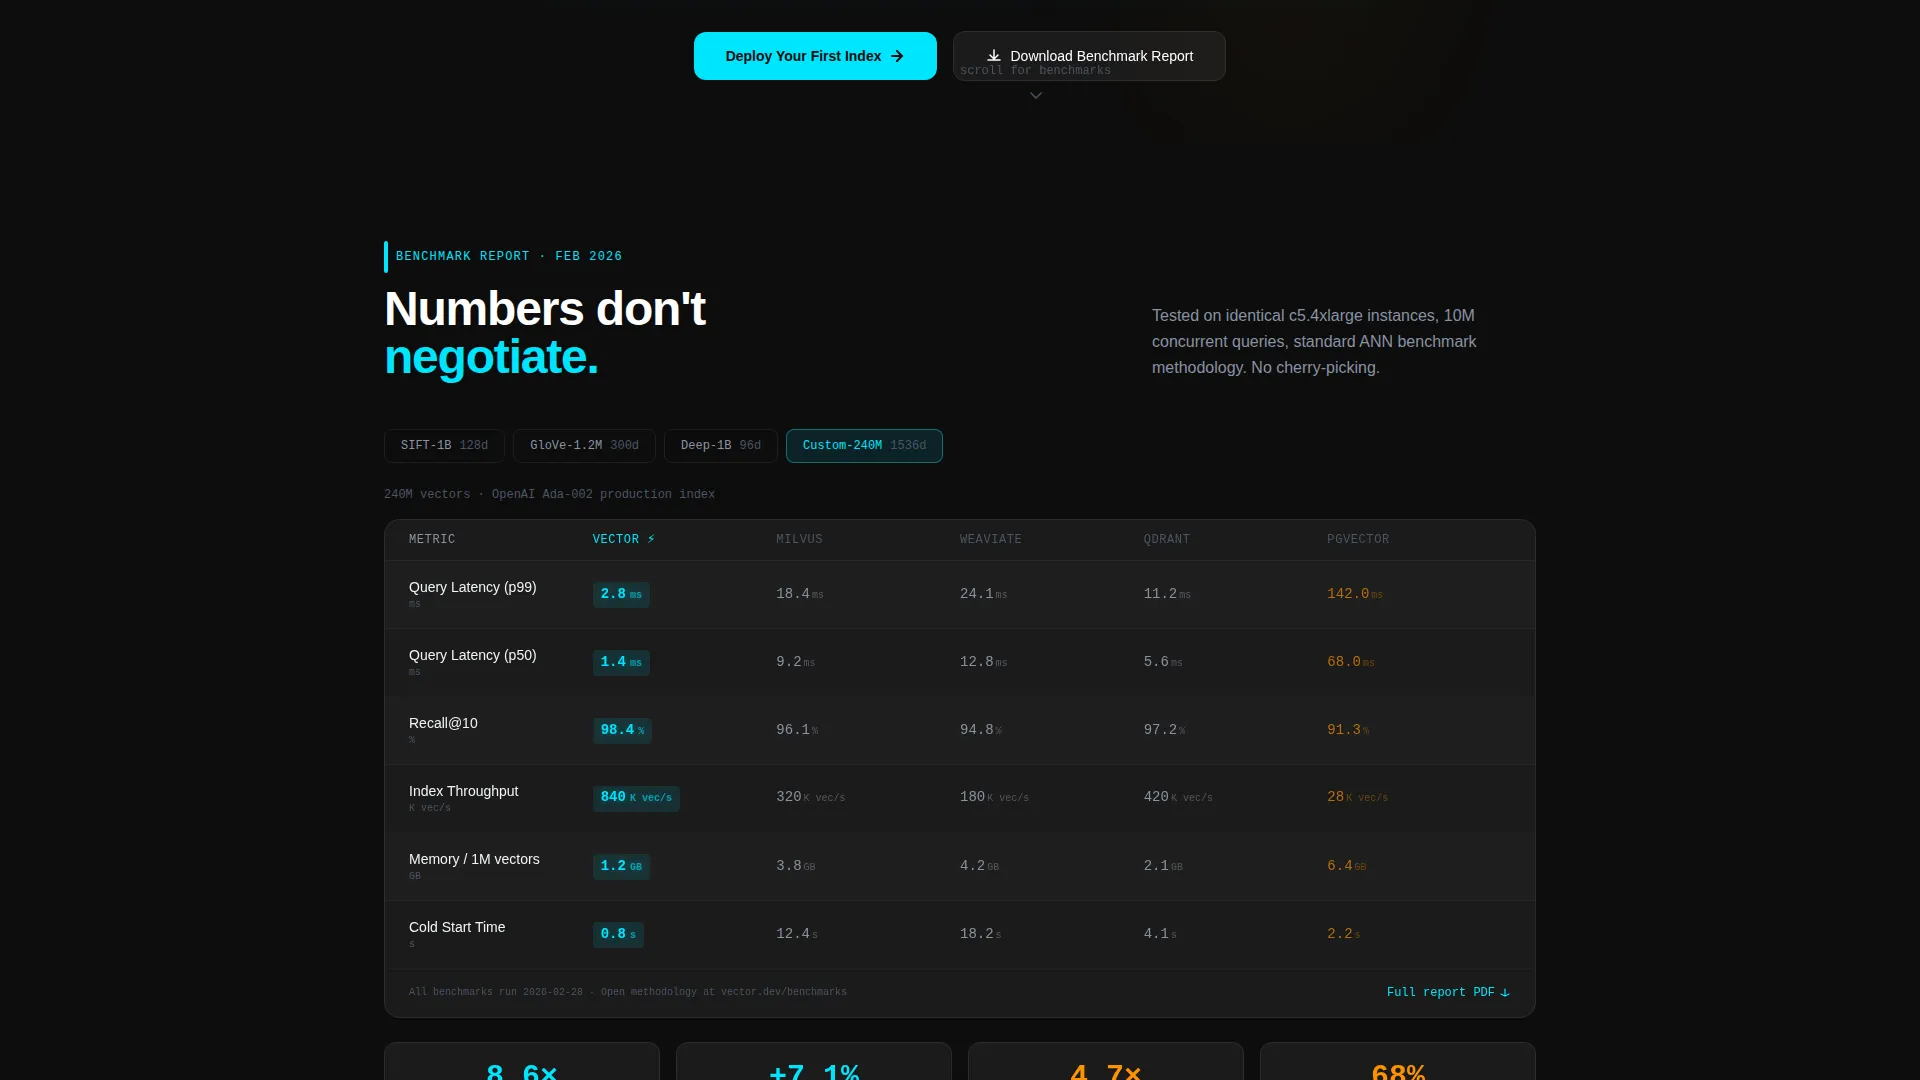
A carbon-fiber-striped data table compares query latency, recall at 10 results, and indexing throughput across multiple vector database options. Winning metrics are highlighted in electric cyan so the performance advantage reads instantly without any explanation.
Interactive Cost Calculator
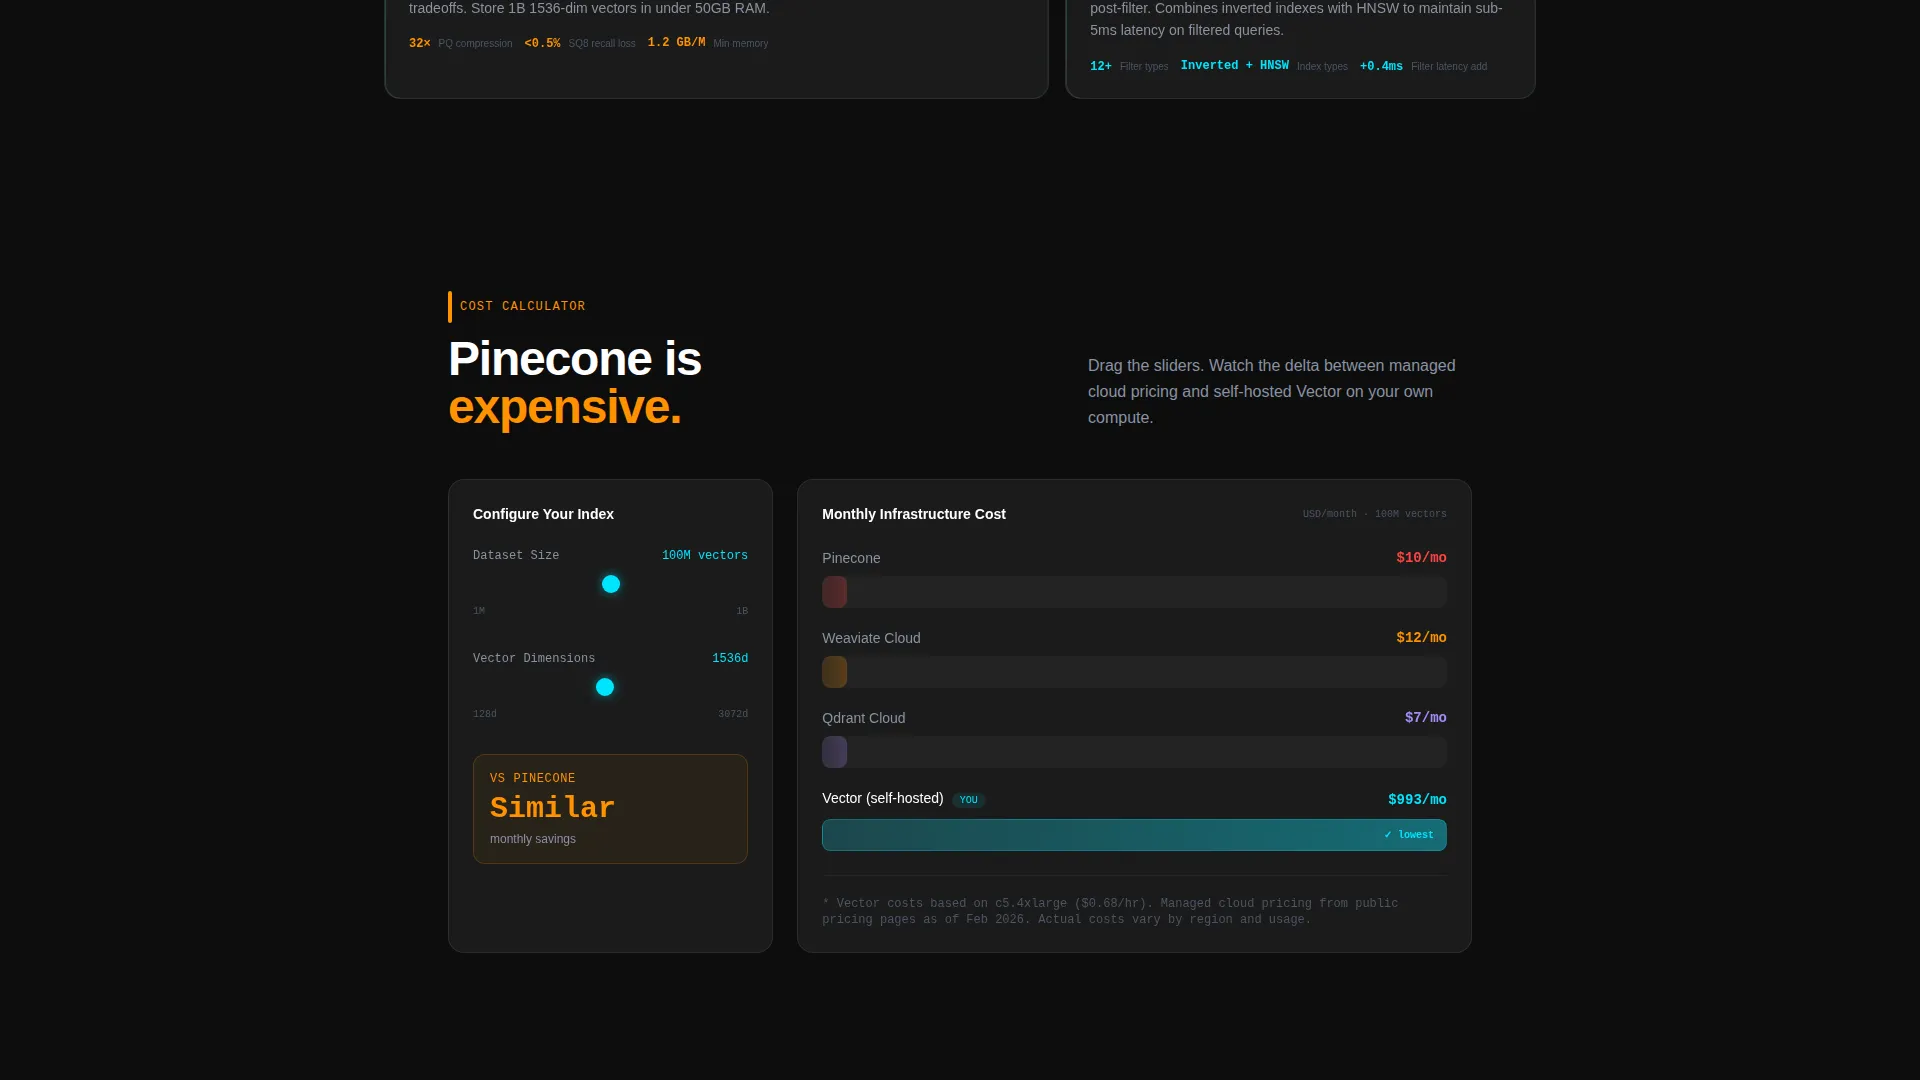
A draggable dataset-size slider updates filtering cost estimates in real time. This gives platform engineers a tangible, personalized reason to move forward rather than a generic pricing page.
Two-Step Progressive Lead Capture Form
Step one collects a work email and estimated dataset size from a dropdown covering ranges from under one million vectors to one billion or more. Step two asks about deployment preference (self-hosted, managed cloud, or hybrid) and primary use case, keeping early friction low while gathering high-quality qualification data.
Gated Benchmark Report Download
A secondary conversion path offers a downloadable benchmark report (PDF) gated behind an email-only form. This catches engineers who want independent proof before committing to a deployment conversation.
Terminal-Style Case Study Blocks
Customer deployment stories are presented as terminal log outputs showing before-and-after performance numbers. The format feels native to the audience and makes results concrete rather than anecdotal.
Page sections overview
| Section | Purpose |
|---|---|
| Interactive Hero Header | Live dashboard, query bar, and cluster visualization to demonstrate real query performance |
| Benchmark Data Grid | Side-by-side latency, recall, and throughput comparison table with highlighted winning metrics |
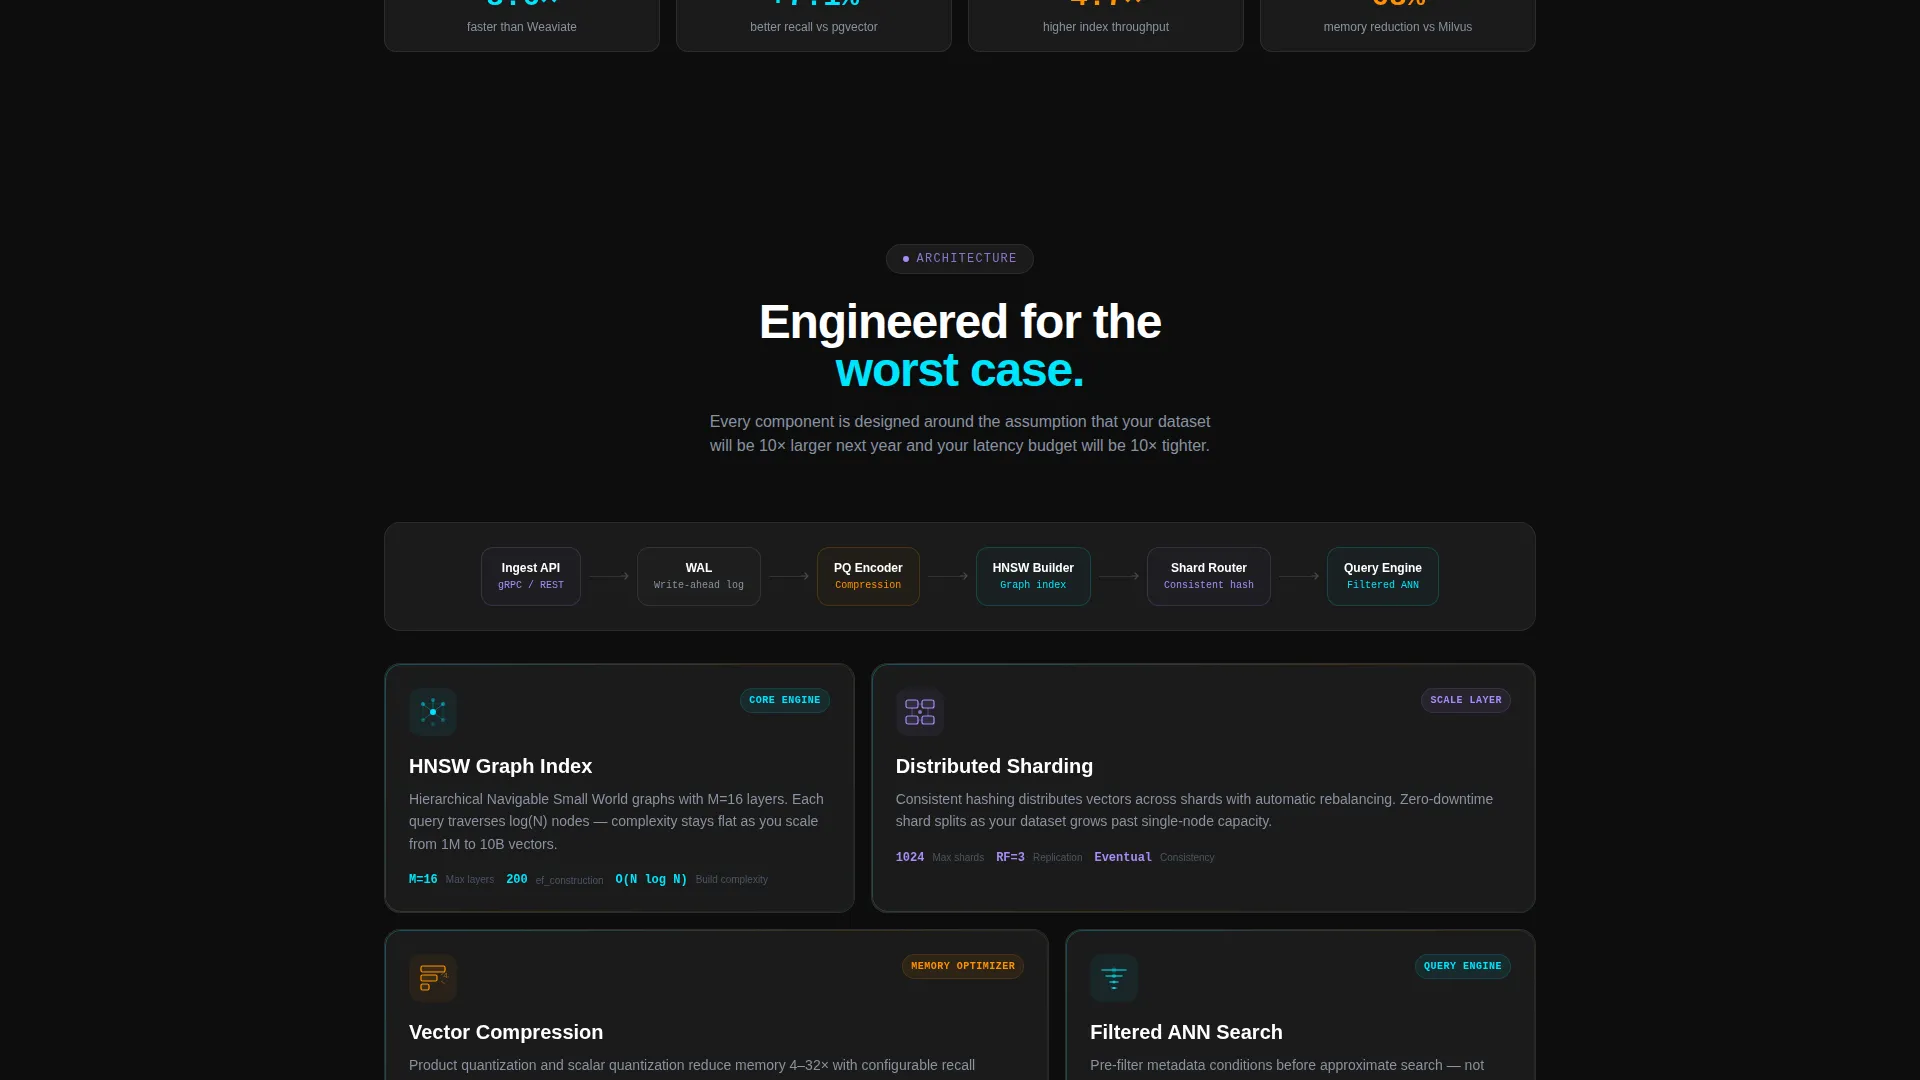
| Architecture Diagram Cards | Frosted glass cards explaining the indexing framework and system design |
| Cost Calculator Section | Slider-driven estimator that personalizes filtering cost by dataset size |
| Case Study Log Outputs | Terminal-style before-and-after deployment results from real use cases |
| Lead Capture Form | Two-step progressive disclosure form with deployment preference and use case fields |
| Persistent call to action Bar | Bottom bar activating at 40 percent scroll depth with primary deploy action |
| Benchmark Report Gate | Email-only download form for the gated PDF benchmark report |
Design & branding system
The template follows a Tech Glass theme built on a Carbon Fiber color system. Every surface is designed to absorb light except the data itself, which glows against the dark background.
- Core palette: deep carbon black (#0D0D0D) base, woven graphite (#1A1D23) for panel backgrounds, frosted glass panels using white at 6 percent opacity layered over blur, electric cyan (#00E5FF) for live data accents and interactive affordances, and ignition amber (#FF9100) for benchmark highlights and hover states on comparison tables
- Visual metaphor follows the feeling of looking through a smoked polycarbonate panel into a server rack, everything backlit by status LEDs
- No stock photography or illustration is used anywhere; the running product interface is the visual hero throughout
Mobile & speed optimization
The template is structured to remain readable and functional across screen sizes while keeping the dashboard-heavy layout performant.
- The interactive header components and data grid are designed to reflow cleanly on smaller viewports without losing the core benchmark evidence
- The persistent call to action bottom bar is particularly effective on mobile where scroll depth triggers are well-supported and thumb-reachable placement matters
- Heavy visual components like the 3D cluster projection are framed so they degrade gracefully when rendered on lower-powered devices
How this template helps you convert
The page is built around a clear rhythm: make a claim, deliver proof, then invite interaction. This structure respects the technical buyer's skepticism and earns trust before asking for contact details.
- The interactive header lets visitors experience query performance directly before any form is presented, removing the biggest objection (does this actually work?) before it forms
- The gated benchmark PDF creates a second, lower-commitment conversion entry point that captures engineers in research mode who are not yet ready to deploy
- The two-step form collects meaningful qualification data (dataset size, deployment model, use case) without front-loading friction, making follow-up conversations more targeted and useful for both sides
Other information about this template
This template is designed to serve teams in the vector database space who are competing on technical credibility. A few additional details are worth noting before you deploy it.
- The Industry Report creative direction means every scroll segment is structured as a claim followed by evidence followed by an interactive proof point, keeping even deeply technical visitors engaged
- The amber highlight color (#FF9100) is specifically reserved for benchmark metrics that beat competitor results and for hover states on comparison rows, so the color carries meaning throughout the page
- The dashboard-style layout is suited to audiences familiar with tools like monitoring platforms and data infrastructure consoles, making the visual language immediately legible to the target persona
- The template is category-matched to Vector Database Technology and is well-suited for teams positioning a self-hosted or hybrid deployment model against managed cloud-only alternatives
Theme
Tech Glass
Creative direction
Industry Report
Color system
Carbon Fiber
Style
Dashboard/Data Grid
Direction
Lead Generation
Page Sections
Live Interactive Hero Dashboard
Benchmark Comparison Data Grid
Interactive Cost Calculator
Two-step Progressive Lead Form
Gated Benchmark Report Download
Terminal-style Case Study Blocks
Related questions
Who is this landing page template designed for?
What does the interactive header actually show?
How does the two-step lead capture form work?
Can visitors access benchmark data without completing the full form?
What makes this template suited to a technical infrastructure audience?



