
AI prompts for performance testing let developers generate load tests, latency checks, and scalability scripts in minutes. Each prompt needs a specific endpoint, load profile, threshold, framework, and acceptance criteria. Vague prompts produce shallow results.
Why do most performance bugs only surface after deployment?
The AI-powered software testing market is projected to reach $39.43 billion by 2031, growing at a 26.88% CAGR. That growth reflects a clear shift in how QA teams approach test creation. Teams are moving from manual effort to AI-assisted workflows that generate test cases faster.
Vague prompts like "test my app's performance" produce generic, shallow coverage. The difference between a useful test suite and a throwaway skeleton comes down to prompt design. How much context you give the AI model, how specific your test scenarios are, and whether you define acceptance criteria upfront all shape the output.
This blog delivers structured prompts across five categories. Each prompt is ready to copy, paste into your preferred AI tool, and adapt to your endpoints and environment details.
How to Structure Prompts for Reliable Test Output
Understanding prompt design determines whether you get actionable test cases or a generic skeleton. Here is what every strong performance test prompt needs.
-
Name the system and its constraints. A prompt that says "test my e-commerce checkout under load" tells the AI exactly what to target.
-
Specify environment details and thresholds. Include expected response times, concurrent user counts, acceptable error rates, and infrastructure specs.
-
Define the expected result format. Tell the AI to produce test scripts in a specific framework like JMeter, k6, or Gatling. Prompts with output format constraints consistently produce better results.
-
Include edge cases explicitly. Mention timeout scenarios, connection pool exhaustion, memory spikes, and data volume limits.
-
State your stack. Mention your backend language, database, and cloud provider so the AI generates framework-specific assertions.
Teams that treat prompts as structured test artifacts see the biggest gains in test coverage and prompt quality. Learning prompt engineering best practices makes every prompt in this guide more effective for your specific system.
The Anatomy of a High-Quality Performance Test Prompt
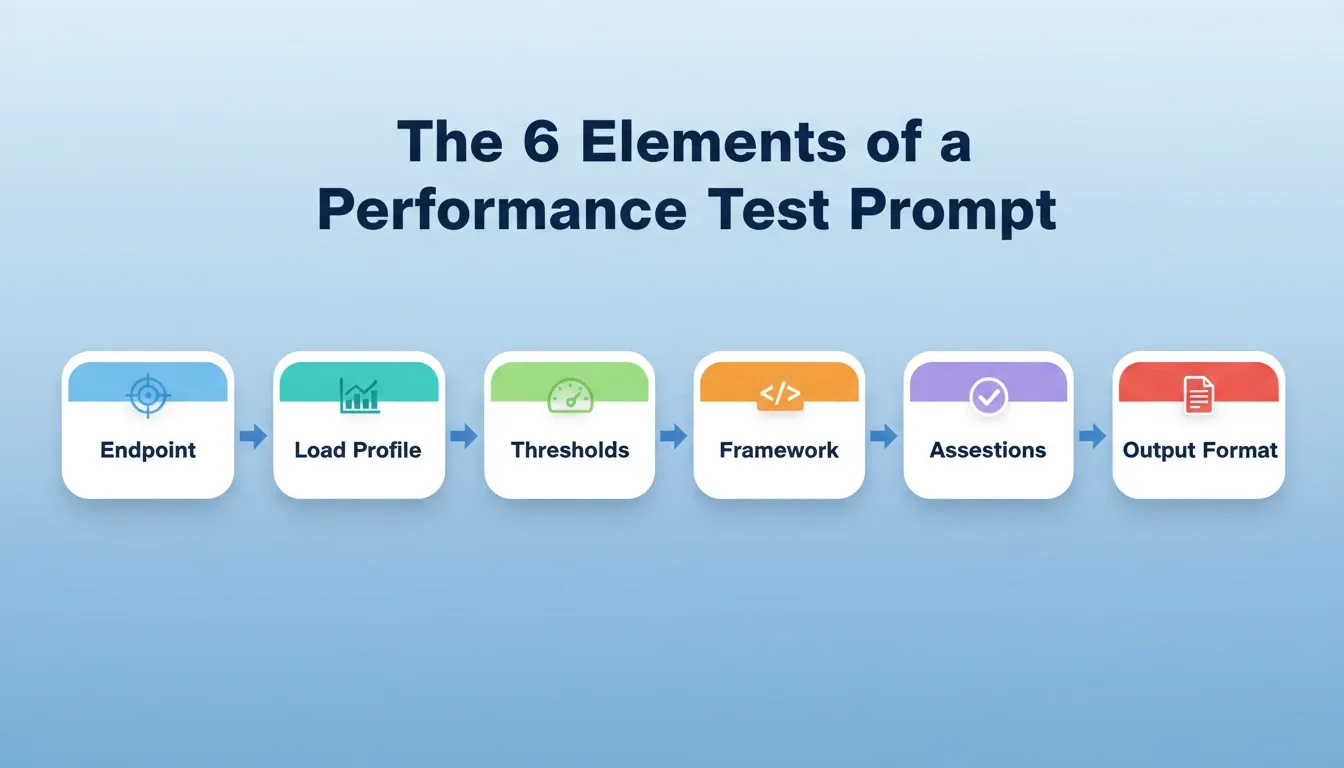
Every strong performance test prompt contains six elements:
1[ENDPOINT] + [LOAD PROFILE] + [THRESHOLDS] + [FRAMEWORK] + [ASSERTIONS] + [OUTPUT FORMAT]
Example: "Generate a k6 load test for POST /api/checkout. Ramp from 0 to 500 concurrent users over 5 minutes. Hold for 10 minutes, then ramp down. Assert P95 response time stays under 300ms. Keep error rate below 0.5%. Output the script with threshold checks and a summary report."
| Prompt Design Element | Weak Approach | Strong Approach |
|---|---|---|
| System context | "Test my app" | "Test GET /api/products with 500 concurrent users" |
| Thresholds | None specified | P95 under 200ms, error rate below 1% |
| Output format | Open-ended | k6 script with assertions |
| Edge cases | Ignored | Timeout, pool exhaustion, memory spikes |
| Acceptance criteria | Not defined | Pass/fail thresholds stated upfront |
| Stack context | Not mentioned | Node.js + PostgreSQL + AWS ECS |
What Load and Stress Testing Prompts Should Developers Use?
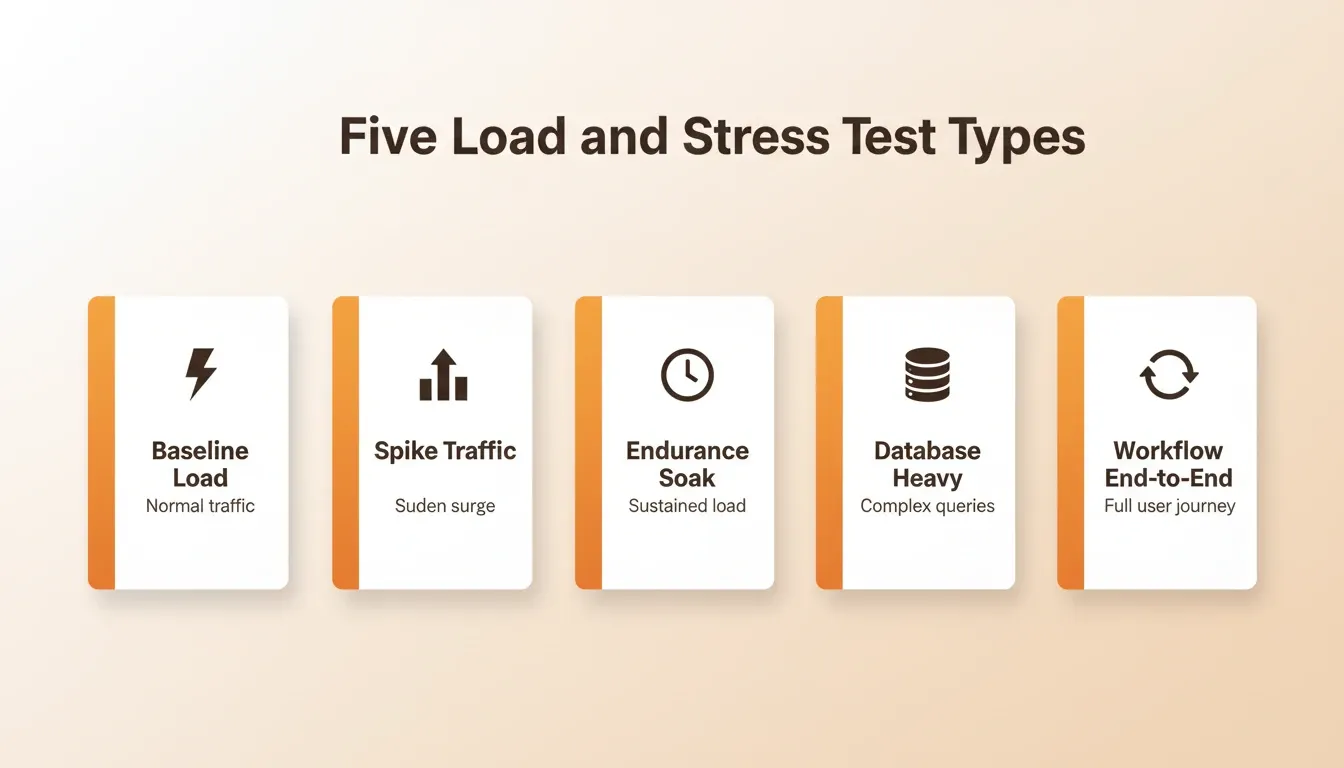
Load testing and stress testing reveal how your system behaves when traffic spikes hit. These five prompts help you generate test cases that simulate real-world pressure. They cover gradual ramp-ups to sudden traffic surges.
According to Postman's 2025 State of the API Report, 81% of API-related work involves testing, yet only 17% of teams practice contract testing. AI-powered test creation fills that gap by producing comprehensive test plans in seconds instead of hours.
Prompt 1: Baseline Load Test
Generate a load test script for a REST API endpoint (GET /api/products) that simulates 500 concurrent users over 10 minutes. Measure P50, P95, and P99 response times. Set pass/fail thresholds at 200ms for P95 and 500ms for P99. Output the script in k6 format with assertions for latency percentiles and error rate below 1%.
What it catches: Baseline latency distribution and the point where response times start degrading under normal traffic.
Prompt 2: Spike Traffic Simulation
Write a stress test that ramps from 50 to 2000 concurrent users in 60 seconds on POST /api/orders. Monitor throughput, error rates, and response times during the spike. Include assertions that verify the system degrades gracefully rather than returning 500 errors. Report the exact concurrency level where error rate exceeds 5%.
What it catches: The breaking point where your system transitions from healthy to overloaded, and whether it recovers after the spike.
Prompt 3: Sustained Endurance Test
Create a soak test script that maintains 200 concurrent users on the /api/dashboard endpoint for 4 hours. Track memory usage, connection pool health, and response time drift over the duration. Flag any response time increase greater than 20% from the first-hour baseline. Output results in CSV format for trend analysis.
What it catches: Memory leaks, connection pool exhaustion, and gradual performance degradation that only appears under sustained load.
Prompt 4: Database-Heavy Operation Under Load
Generate a performance test for GET /api/reports?range=365d that triggers complex database queries. Simulate 100 concurrent users requesting annual reports simultaneously. Set test data to include 500K records. Assert that response completes within 3 seconds and that no N+1 query patterns appear in the logs.
What it catches: Slow database queries, missing indexes, and N+1 patterns that only surface with realistic data volume.
Prompt 5: Multi-Endpoint Workflow Test
Write a test scenario that simulates a complete user workflow: login, browse products, add to cart, and checkout. Run 300 concurrent users through this flow simultaneously. Measure end-to-end completion time and identify which step in the workflow becomes the bottleneck under load.
What it catches: Performance bottlenecks that only appear when multiple endpoints interact under concurrent user sessions.
Want to build apps that are performance-ready from the first prompt? Rocket generates production-grade Next.js and Flutter apps with staging environments, version history, and built-in Core Web Vitals monitoring. Start building with Rocket
Which Latency and Response Time Prompts Catch Hidden Issues?
Latency bugs are the silent killers of user experience. A page that loads in 200ms during development can spike to 3 seconds under production traffic patterns. These five prompts surface response time problems before users report them.
Teams already running structured prompts for API validation find these latency prompts pair well for full-stack test coverage.
Prompt 6: API Response Time Profiling
Generate a test that profiles response times for every endpoint in the /api/v2 namespace. Run each endpoint 100 times with varying payload sizes (1KB, 10KB, 100KB). Produce a report sorted by P99 latency, highlighting any endpoint where P99 exceeds 500ms. Include a comparison table of response times across payload sizes.
What it catches: Endpoints with non-linear response time growth as payload size increases, often caused by serialization bugs or missing pagination.
Prompt 7: Geographic Latency Simulation
Write a performance test that simulates API requests from five geographic regions (US-East, US-West, EU-West, Asia-Pacific, South America). Compare response times across regions for the /api/search endpoint. Flag any region where latency exceeds 2x the lowest-region baseline. Output a latency risk heatmap by region.
What it catches: CDN misconfiguration, missing regional caching, and DNS resolution delays that affect specific user populations.
Prompt 8: Third-Party Dependency Timeout
Create test scenarios that simulate slow responses from third-party services (payment gateway, email provider, analytics). Inject artificial delays of 2s, 5s, and 30s on external API calls. Verify the system handles timeouts correctly and returns appropriate fallback responses. Confirm it does not block other requests waiting in queue.
What it catches: Missing timeout configurations and cascading failures where one slow dependency freezes the entire request pipeline.
Prompt 9: Cache Hit/Miss Performance Delta
Generate tests that measure response time differences between cached and uncached requests for GET /api/content/:id. Clear the cache, measure cold response time, then measure warm response time. Assert that cache hit responses are at least 5x faster than cache misses. Report cache hit ratio over 1000 requests.
What it catches: Ineffective caching strategies, cache key collisions, and scenarios where the cache provides no measurable performance benefit.
Prompt 10: WebSocket Connection Latency
Write a test that opens 500 simultaneous WebSocket connections to /ws/notifications. Measure connection establishment time, message delivery latency, and reconnection behavior after forced disconnection. Assert that message delivery stays under 100ms for 95% of messages. Track connection drop rates over a 30-minute session management window.
What it catches: WebSocket scaling issues, message queue backlogs, and reconnection storms that crash notification systems under real user load.
Regression tests built from these prompts catch latency regressions across releases. QA teams that run tests on every pull request build confidence that new features do not introduce response time spikes.
Run these latency tests against a real staging environment. Rocket deploys every app to a private staging URL before production. Separate environments mean clean baselines on every release. Try Rocket
How Do Concurrency and Scalability Prompts Prevent Failures?
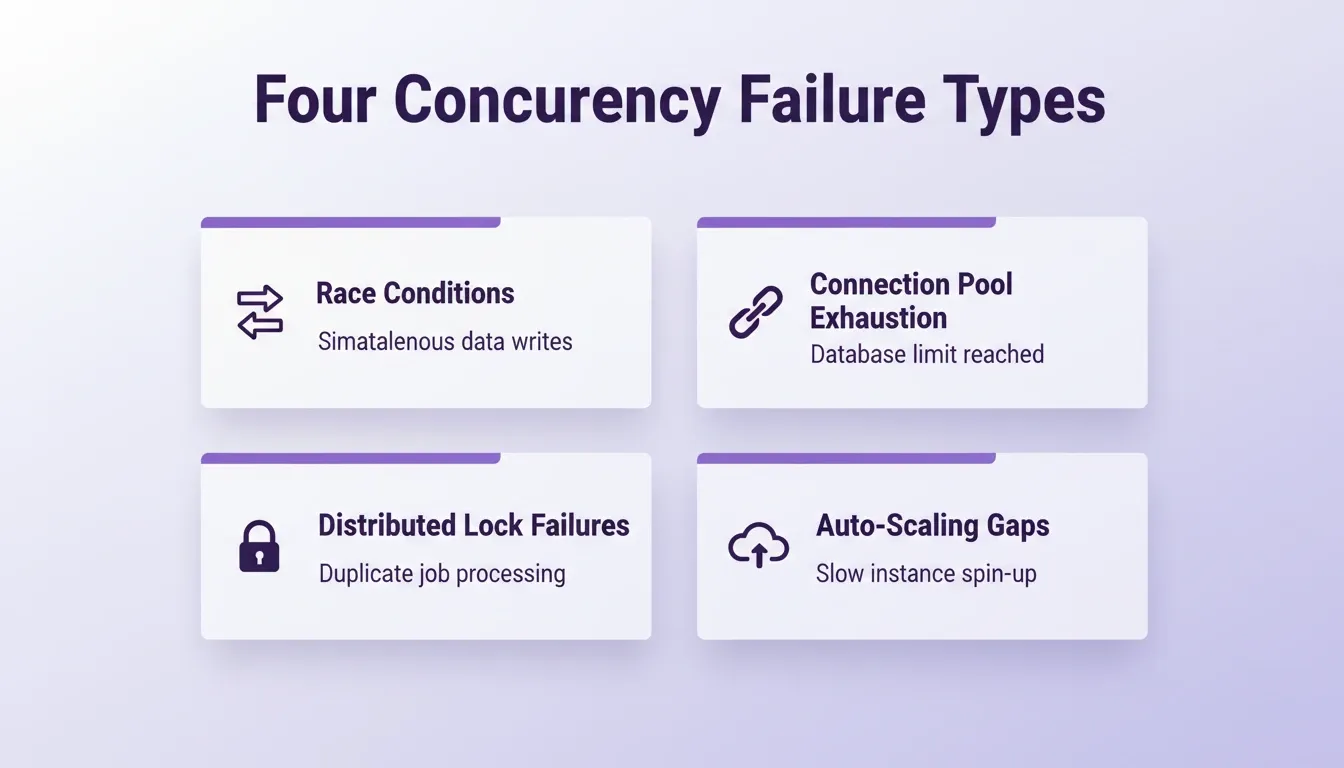
Concurrency bugs rarely show up during single-user testing. They appear when hundreds of users hit the same resource at the same moment. According to QA industry research, 75% of security teams now use AI tools for testing and threat detection. These five prompts target the race conditions, deadlocks, and scaling failures that only surface under parallel execution.
Prompt 11: Race Condition Detection
Generate a concurrency test that sends 50 simultaneous PUT requests to update the same inventory count on /api/products/:id/stock. Each request decrements the stock by 1. Verify the final stock value equals the initial value minus 50. Flag any result where the count is incorrect, indicating a race condition.
What it catches: Missing database locks and optimistic concurrency control failures that cause inventory discrepancies in production.
Prompt 12: Connection Pool Exhaustion
Write a test that opens 200 database connections simultaneously by triggering slow queries on /api/reports. Hold each connection for 10 seconds. Monitor whether new requests get queued, timed out, or rejected. Assert that the system returns 503 Service Unavailable when the pool is full rather than hanging indefinitely.
What it catches: Missing connection pool limits and request queuing behavior that transforms slowdowns into complete outages.
Prompt 13: Distributed Lock Testing
Create test scenarios for a distributed system where three service instances process the same job queue. Submit 100 jobs and verify each job is processed exactly once. Assert zero duplicates and zero missed jobs. Report any job that was picked up by multiple instances simultaneously.
What it catches: Distributed lock failures and job duplication bugs that cause double-processing in microservice architectures.
Prompt 14: Auto-Scaling Trigger Validation
Generate a test that gradually increases traffic from 100 to 5000 requests per second. Monitor auto-scaling events and verify new instances spin up within the configured threshold. Assert that response times remain under 500ms during scale-up transitions. Report the exact traffic level that triggers each scaling event.
What it catches: Misconfigured auto-scaling policies, slow instance provisioning, and cold-start latency spikes during scale-out events.
Prompt 15: Session Management Under Scale
Write tests that create 10,000 authenticated sessions over 5 minutes. Verify session persistence across requests, session expiry after timeout, and correct session isolation between users. Assert that no user can access another user's session data. Monitor session store memory and CPU impact.
What it catches: Session leakage between users, session store memory leaks, and authentication bypass under high-concurrency conditions.
Build apps with concurrency handled from day one. Rocket generates production-grade code with typed routes, input validation, and error handling built in. Your prompts test endpoints that already follow industry standards. Build with Rocket
What Resource Monitoring Prompts Reveal System Health Problems?
Performance is not just about speed. It is about whether your system stays healthy while running fast. These five prompts monitor CPU, memory, disk I/O, and network behavior under stress. They catch the problems that latency tests alone miss.
Prompt 16: Memory Leak Detection
Generate a test that runs the /api/process-batch endpoint 1000 times in sequence. Track heap memory after each iteration. Flag any test run where memory consumption grows by more than 5% compared to the previous run. Produce a memory growth chart and identify the likely root causes based on the allocation pattern.
What it catches: Gradual memory leaks in batch processing that only appear after hundreds of executions, causing eventual out-of-memory crashes.
Prompt 17: CPU Utilization Under Mixed Workload
Write a test that simulates a realistic production workload: 60% read requests (GET /api/content), 30% write requests (POST /api/orders), and 10% compute-heavy requests (GET /api/analytics/summary). Run 500 concurrent users with this distribution for 30 minutes. Report CPU utilization by request type and flag any operation that consumes more than 40% of a single core.
What it catches: CPU-bound operations that starve other requests under mixed workload patterns, often invisible in isolated endpoint testing.
Prompt 18: Disk I/O Bottleneck Identification
Create a test that uploads files of varying sizes (100KB, 1MB, 10MB, 100MB) to /api/uploads while simultaneously running database-heavy queries. Monitor disk I/O wait times and throughput. Assert that file upload response times remain under 5 seconds for files up to 10MB, even during peak database activity.
What it catches: Disk I/O contention between file operations and database queries that causes unpredictable performance degradation.
Prompt 19: Network Throughput and Bandwidth
Generate tests that send and receive large payloads (10MB JSON responses) from /api/export across 100 concurrent connections. Measure network throughput per connection and total bandwidth utilization. Assert that individual connection speeds do not drop below 1MB/s even at peak concurrency. Report any connection throttling or rate limiting behavior.
What it catches: Network bandwidth saturation and TCP connection throttling that degrades download speeds for data-heavy endpoints.
Prompt 20: Error Log Analysis Automation
Write a prompt that analyzes 10,000 lines of application error logs from test runs. Categorize errors by severity (critical, warning, info). Identify the top 5 most frequent error patterns and suggest likely root causes for each. Produce a risk heatmap prioritizing which issues need immediate attention based on frequency and user impact.
What it catches: Recurring error patterns buried in log noise that manual review almost always misses, including intermittent failures that correlate with specific traffic patterns.
When a test run reveals a regression, roll back instantly. Rocket saves every Build message as a versioned code diff. Compare changes, identify what broke, and restore any previous version in one click. Start with Rocket
Which AI Tool Should You Use for Performance Test Generation?
Not every AI assistant produces equally structured test output. Here is how the major tools compare for performance testing prompt workflows:
| AI Tool | Best For | Strengths | Limitations |
|---|---|---|---|
| ChatGPT (GPT-4o) | General load test scripts | Broad framework support, strong k6/JMeter output | Needs explicit format constraints |
| Claude (Sonnet/Opus) | Complex multi-step scenarios | Strong reasoning, handles long test plans | Slower on large script generation |
| Gemini | Google Cloud workloads | GCP-native tooling awareness | Less consistent on niche frameworks |
| GitHub Copilot | In-IDE test generation | Context-aware from your codebase | Requires IDE integration |
| Cursor | Iterative test refinement | Reads existing test files for context | Subscription required |
The right choice depends on your workflow, not the tool's headline feature. Use ChatGPT or Claude for standalone prompt-to-script generation. Use Copilot or Cursor when you need the AI to read your existing codebase and generate tests that match your project's patterns.
How to Integrate AI-Generated Tests into Your CI/CD Pipeline
AI-generated performance tests deliver the most value when they run automatically on every pull request. Here is how to wire them into a standard CI/CD workflow:
Follow these steps to get started:
-
Generate baseline tests using the prompts in this guide. Save them as
.js(k6) or.jmx(JMeter) files in your repo under/tests/performance/. -
Add a CI job in GitHub Actions, GitLab CI, or CircleCI. Run
k6 run tests/performance/load-test.json every PR targetingmain. -
Set thresholds as exit codes. k6 returns a non-zero exit code when thresholds fail. This blocks the merge automatically.
-
Store results as artifacts. Upload the JSON summary to your CI artifact storage. Developers can then inspect P95/P99 trends over time.
-
Re-prompt when tests fail. Paste the failure output back into your AI tool and ask: "This k6 test failed with these results. Identify the likely bottleneck and suggest three fixes."
This loop of generate, run, fail, re-prompt, and fix is the core of AI-assisted performance engineering. The AI accelerates the cycle, and your judgment drives the decisions.
How Rocket Connects Research, Building, and Performance in One Place
You type the problem. Rocket researches it, recommends a direction, and builds from that direction. That is the difference between a tool and a system.
Rocket is the world's first Vibe Solutioning platform. It brings research, building, and competitive monitoring together in one shared context. 1.5 million people have tried Rocket across 180 countries. Here is what that means for performance testing specifically.
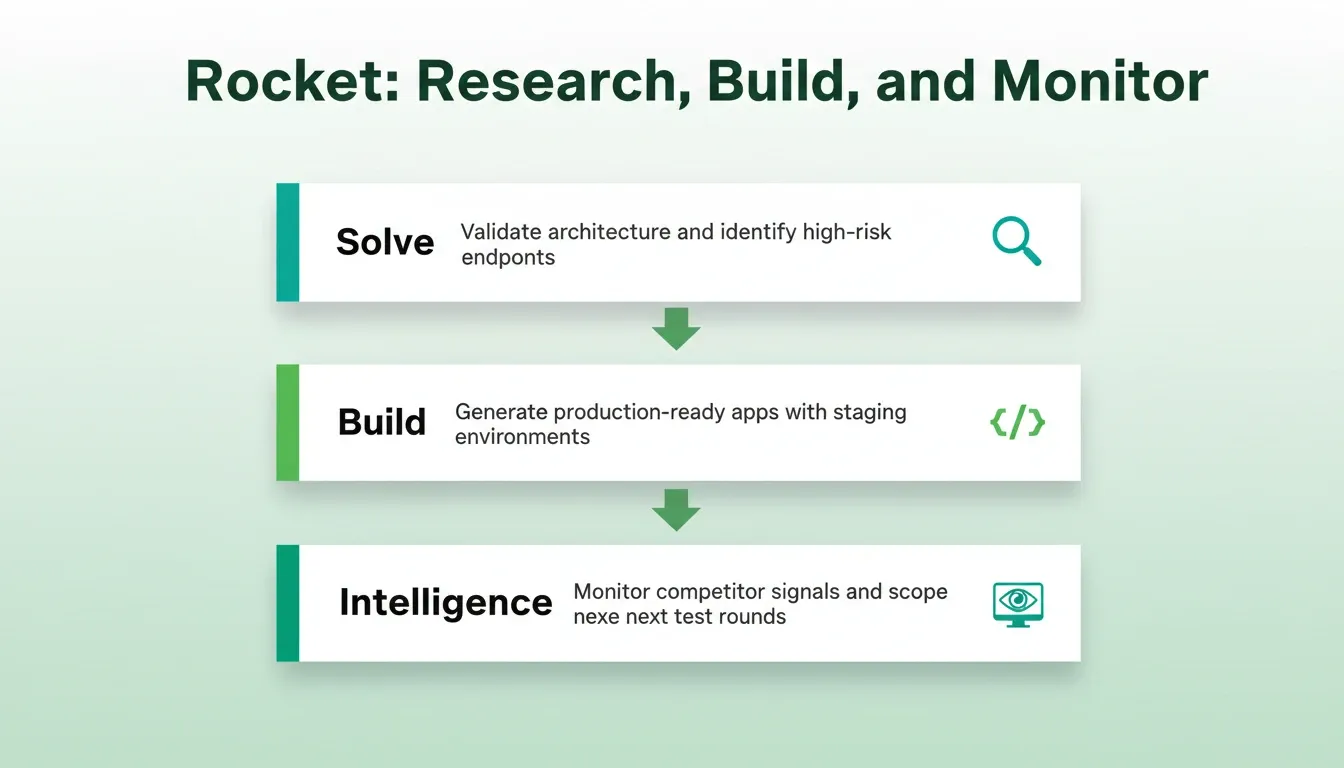
Solve turns any business question into a structured, evidence-backed report. Before you write a single performance test, use Solve to validate your app's architecture decisions and identify the highest-risk endpoints worth testing first. Any question. Any situation. A complete, structured output, ready to act on, present, or build from.
Build generates production-ready Next.js web apps and Flutter mobile apps from natural language. Every generated app ships with SEO-ready structure, WCAG accessibility compliance, GDPR coverage, and performance optimization as the baseline. Your test prompts validate endpoints that already follow industry standards. This reduces noise in test results from the start.
Built-in Core Web Vitals monitoring grades your deployed app on LCP, INP, and CLS. These are the three signals Google uses as ranking factors. The Performance panel (Task, then the "..." menu, then Performance) identifies specific issues and can auto-fix them. It compresses images, removes unused code, adds lazy loading, and sets cache headers. Staging and production environments are separate, so you run AI-generated load tests against staging before every production push.
Every time Rocket responds to a Build message, it saves the result as a new version with a full code diff. When a test run reveals a regression, compare diffs, identify the change that broke things, and roll back instantly. 25+ integrations including Stripe, Supabase, OpenAI, and Anthropic connect directly into every build. External API connections come pre-validated, which reduces the surface area your test plan needs to cover.
Intelligence monitors competitors continuously across every public platform they operate on. If a competitor ships a performance improvement that shifts user expectations, Intelligence surfaces that signal. You can then use it to scope your next round of performance test prompts.
"Clear goals, structured steps, and examples raised success rates dramatically. Most failed prompts were just unclear." — r/PromptEngineering community discussion
Performance Testing Gets Smarter When the App Is Built Right
AI prompts for performance testing are only as effective as the app they validate. The prompts in this guide cover the categories that matter most: load and stress validation, latency profiling, concurrency checks, and resource monitoring.
As AI-generated test suites become standard in every CI/CD pipeline, the teams shipping reliable software will treat prompt quality as a first-class engineering practice. The artificial intelligence testing industry is growing at nearly 27% annually because performance bugs are expensive. The right prompts catch them before your users do.
You describe the problem. Rocket researches it, builds it, and monitors what happens after it ships. Start building performance-ready apps at Rocket.new today.
Table of contents
- -How to Structure Prompts for Reliable Test Output
- -The Anatomy of a High-Quality Performance Test Prompt
- -What Load and Stress Testing Prompts Should Developers Use?
- -Prompt 1: Baseline Load Test
- -Prompt 2: Spike Traffic Simulation
- -Prompt 3: Sustained Endurance Test
- -Prompt 4: Database-Heavy Operation Under Load
- -Prompt 5: Multi-Endpoint Workflow Test
- -Which Latency and Response Time Prompts Catch Hidden Issues?
- -Prompt 6: API Response Time Profiling
- -Prompt 7: Geographic Latency Simulation
- -Prompt 8: Third-Party Dependency Timeout
- -Prompt 9: Cache Hit/Miss Performance Delta
- -Prompt 10: WebSocket Connection Latency
- -How Do Concurrency and Scalability Prompts Prevent Failures?
- -Prompt 11: Race Condition Detection
- -Prompt 12: Connection Pool Exhaustion
- -Prompt 13: Distributed Lock Testing
- -Prompt 14: Auto-Scaling Trigger Validation
- -Prompt 15: Session Management Under Scale
- -What Resource Monitoring Prompts Reveal System Health Problems?
- -Prompt 16: Memory Leak Detection
- -Prompt 17: CPU Utilization Under Mixed Workload
- -Prompt 18: Disk I/O Bottleneck Identification
- -Prompt 19: Network Throughput and Bandwidth
- -Prompt 20: Error Log Analysis Automation
- -Which AI Tool Should You Use for Performance Test Generation?
- -How to Integrate AI-Generated Tests into Your CI/CD Pipeline
- -How Rocket Connects Research, Building, and Performance in One Place
- -Performance Testing Gets Smarter When the App Is Built Right