
These fifteen AI prompts to create a finance dashboard generate live KPIs, automated reports, and investor-ready visuals in minutes. No spreadsheet formulas, no manual chart configuration, and no developer required.
How many hours does your finance team lose rebuilding the same dashboard views every reporting cycle?
A finance dashboard is a real-time visual interface that consolidates your most critical financial metrics. It brings together revenue, cash flow, expenses, burn rate, and profitability into a single, always-current view. Instead of pulling numbers from five different spreadsheets before every board meeting, your team sees the full financial picture the moment they open the tool.
The difference between a good dashboard and a great one comes down to three things. You need the right metrics for the right audience, data that updates automatically from live sources, and a layout that makes decisions obvious. AI-generated dashboards now make it possible to go from a plain-language description to a fully deployed, data-connected financial application in minutes.
Why Finance Teams Are Replacing Spreadsheets with AI-Built Dashboards
The shift is not about novelty. Finance teams are moving to AI-generated dashboards because the manual approach cannot keep pace with real-time reporting demands.
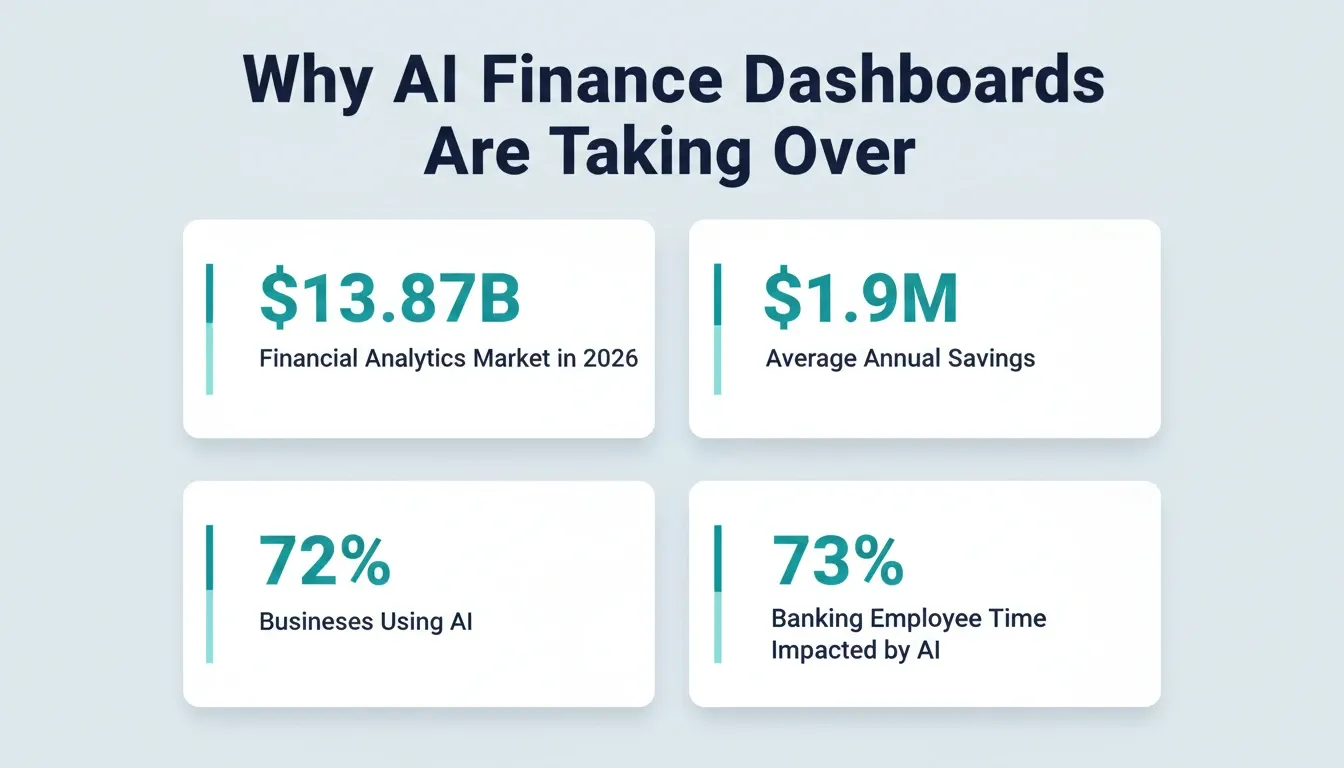
The financial analytics market reached $13.87 billion in 2026 and is projected to hit $23.42 billion by 2031 at 11.05% CAGR, according to Mordor Intelligence. That growth reflects how rapidly teams are investing in automated financial reporting.
AI-embedded finance suites save companies an average of $1.9 million annually through automated reconciliations and more accurate cash forecasts. Manual dashboard builds cannot match this speed.
According to Forbes Advisor, 72% of businesses have already adopted AI for at least one business function. The gap between teams using AI-generated dashboards and those still dragging columns in Excel is widening fast.
Banks and fintech companies report 22 to 30% productivity improvements among early GenAI adopters. 73% of banking employee time has high potential to be impacted by the technology. Teams with AI coding agents that ship faster now build in days what used to take months.
AI-Built vs Manually-Built Finance Dashboards
Before diving into the prompts, it helps to understand what actually changes when you use AI to build your financial dashboard instead of building it manually.
| Factor | Manual Build | AI-Built with Prompt |
|---|---|---|
| Time to first working version | 2 to 5 days | Under 30 minutes |
| Data connection setup | Manual API wiring | Described in prompt, generated automatically |
| Design quality | Depends on developer skill | Production-grade from first generation |
| Iteration speed | Hours per change | Seconds per change via follow-up prompt |
| Maintenance burden | High | Low, re-prompt to update |
| Accessibility compliance | Often missed | Built in by default |
| Mobile responsiveness | Requires separate work | Included automatically |
The difference is not just speed. It is the removal of coordination overhead between describing what you need and having something deployed.
What Makes a Good Prompt for Generating Financial Dashboards?
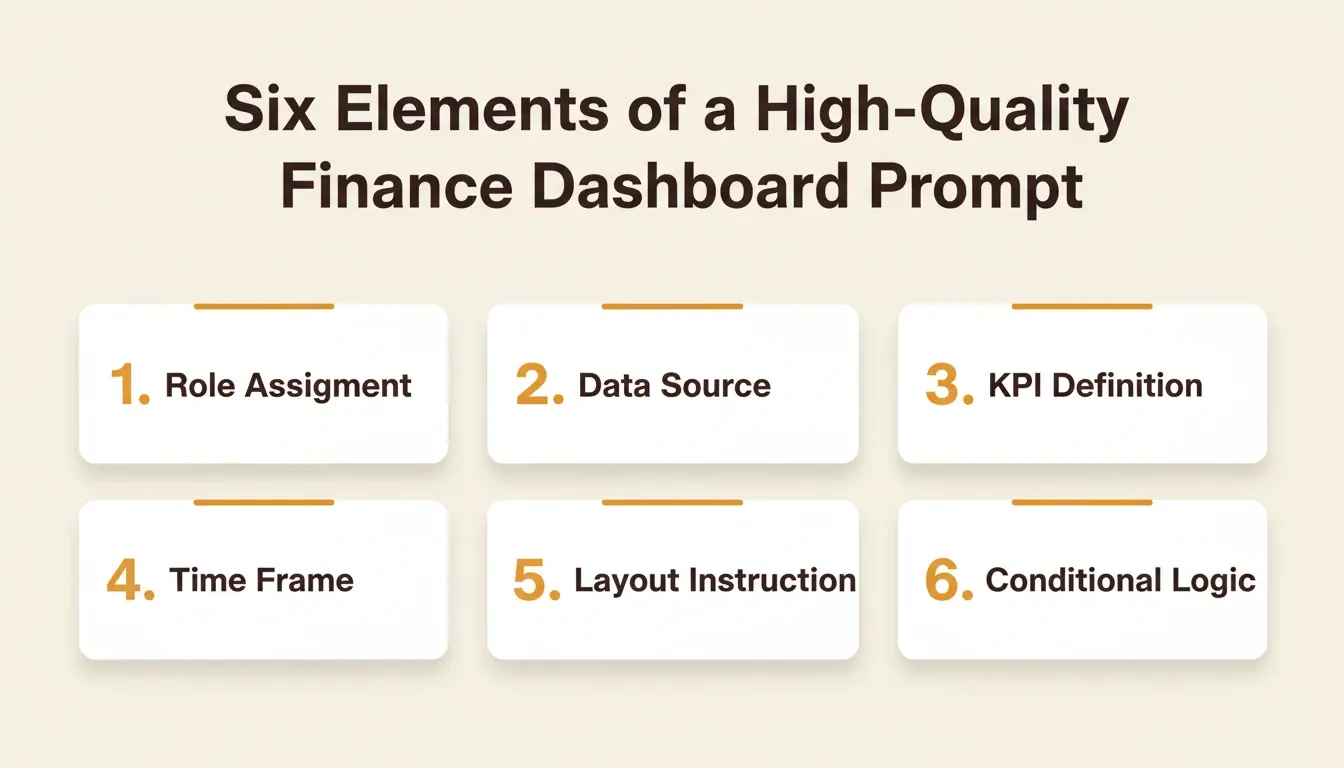
Not all prompts produce usable output. The difference between a dashboard that works in production and one that needs three hours of fixes comes down to prompt structure.
| Prompt Element | What It Does | Example |
|---|---|---|
| Role assignment | Tells the AI what persona to adopt | "Act as a senior financial analyst" |
| Data source specification | Defines where numbers come from | "Pull from our Stripe and Supabase APIs" |
| KPI definition | Names the exact metrics needed | "Show MRR, churn rate, and LTV:CAC ratio" |
| Time frame | Sets the reporting window | "Display trailing 12 months with monthly granularity" |
| Layout instruction | Controls visual arrangement | "Use a grid with 4 KPI cards on top, 2 charts below" |
| Conditional logic | Adds alerts or color coding | "Highlight any metric that drops more than 10% in red" |
Specificity beats length. A 40-word prompt with exact KPI names outperforms a 200-word vague description every time. Prompts that specify who will read the dashboard produce better hierarchy and labeling.
Teams building automated workflows without code find that structured prompts reduce iteration cycles from five rounds to one or two. Master these six elements and every prompt in this guide will produce cleaner, faster results.
Revenue Tracking and Cash Flow Prompts
Revenue visibility is the foundation of every finance function. These five AI prompts to create a finance dashboard cover the most common cash flow and revenue monitoring needs.
Prompt 1: Monthly Recurring Revenue Tracker
"Build a dashboard that displays MRR, net new MRR, expansion MRR, and churned MRR as separate trend lines over the past 12 months. Include a summary card showing current MRR and month-over-month growth percentage. Pull data from our Stripe subscription records."
Prompt 2: Cash Flow Forecast with Runway
"Generate a cash flow dashboard showing inflows, outflows, and net cash position for the next 6 months. Add a runway indicator that calculates months of runway at current burn rate. Flag any month where projected cash drops below $50,000."
Prompt 3: Revenue by Channel Breakdown
"Create a revenue attribution dashboard splitting income by channel: direct sales, organic, paid ads, partnerships, and referrals. Display as both a stacked bar chart by month and a donut chart for the current quarter. Show conversion rates per channel below each section."
Prompt 4: Accounts Receivable Aging Report
"Build an AR aging dashboard with four buckets: 0 to 30 days, 31 to 60 days, 61 to 90 days, and 90 or more days overdue. Show total outstanding per bucket, number of invoices, and top 10 delinquent accounts. Add a weekly collection rate trend line."
Prompt 5: Subscription Cohort Analysis
"Generate a cohort retention dashboard showing monthly subscription cohorts over 12 months. Display as a heat map where color intensity represents retention percentage. Include an average retention curve overlaid on the heat map."
Ready to turn these prompts into a live dashboard? Paste any of the five prompts above into Rocket and get a working finance app in minutes.
Budget Planning and Expense Analysis Prompts
Budgets break when they live in disconnected spreadsheets. These prompts generate financial dashboards that keep planned versus actual spending visible at all times.
Prompt 6: Department Budget vs. Actual
"Create a budget tracking dashboard comparing planned versus actual spend for each department: Engineering, Marketing, Sales, Operations, and G&A. Show variance as both dollar amount and percentage. Use green for under-budget and amber for over-budget departments."
Prompt 7: Vendor Spend Analysis
"Build a vendor expense dashboard ranking our top 20 vendors by total spend this quarter. Include month-over-month spend trend per vendor, contract renewal dates, and a flag for any vendor exceeding their allocated budget by more than 15%."
Prompt 8: Headcount Cost Projections
"Generate a headcount planning dashboard showing current team size per department, average fully-loaded cost per employee, and projected headcount costs for the next 4 quarters based on our hiring plan. Include a comparison toggle between conservative and aggressive hiring scenarios."
Prompt 9: Operating Expense Ratio Tracker
"Create an OpEx ratio dashboard showing operating expenses as a percentage of revenue over 24 months. Break down into R&D, S&M, and G&A ratios. Add benchmark lines for our industry average and best-in-class SaaS companies at our stage."
Prompt 10: Travel and Discretionary Spend Monitor
"Build a T&E dashboard showing travel, meals, software subscriptions, and discretionary spend per employee per month. Include a policy compliance indicator that flags any single expense above $500 and any monthly total exceeding the per-person allowance."
Budgeting prompts work best when you name specific departments, thresholds, and comparison benchmarks. The more context you provide, the less cleanup you need afterward.
Want to build your budget dashboard right now? Take any of prompts 6 to 10 into Rocket and deploy a data-connected budget tracker.
Investor Reporting and KPI Prompts
Board meetings and investor updates demand dashboards that tell a story in seconds. These AI prompts to create a finance dashboard produce presentation-ready outputs with the metrics investors actually ask about.
Prompt 11: SaaS Metrics Board Pack
"Generate an investor-ready dashboard with ARR, net revenue retention, gross margin, burn multiple, and Rule of 40 score. Display each as a large KPI card with trailing 12-month sparkline. Add a one-sentence automated insight below each metric explaining the trend."
Prompt 12: Unit Economics Dashboard
"Create a unit economics dashboard showing CAC, LTV, LTV:CAC ratio, payback period, and gross margin per customer segment. Break segments into Enterprise, Mid-Market, and SMB. Highlight the most profitable segment with a callout card."
Prompt 13: Fundraising Pipeline Tracker
"Build a fundraising dashboard showing current round progress: target amount, committed capital, soft-circled amounts, and pipeline conversations by stage. Include a timeline view of expected close dates and a probability-weighted forecast of total capital raised."
Prompt 14: Monthly Financial Summary for Board
"Generate a one-page financial summary dashboard suitable for board distribution. Include revenue, EBITDA, cash position, headcount, and customer count. Show current month, quarter-to-date, and year-to-date comparisons. Add red, yellow, and green status indicators against plan."
Prompt 15: Competitive Benchmarking Metrics
"Create a competitive benchmarking dashboard comparing our key metrics against 3 to 5 peer companies. Include revenue growth rate, gross margin, net retention, and output per employee. Use publicly available data and display as a ranked bar chart per metric."
"73% of the time spent by US bank employees has a high potential to be impacted by generative AI. 39% by automation and 34% by augmentation." — Michael Abbott, Global Banking Lead, Accenture
Investor-facing prompts benefit most from specifying the exact format your board expects. Adding layout instructions like "one-page" or "presentation-ready" changes the output dramatically.
Your board meeting is coming up. Use prompts 11 to 15 in Rocket to build a presentation-ready investor dashboard before your next meeting.
How to Customize Prompts by Role: CFO, Founder, and Ops Lead
The same financial data serves different purposes depending on who reads it. Prompt customization by role produces dashboards that match each reader's decision-making context.
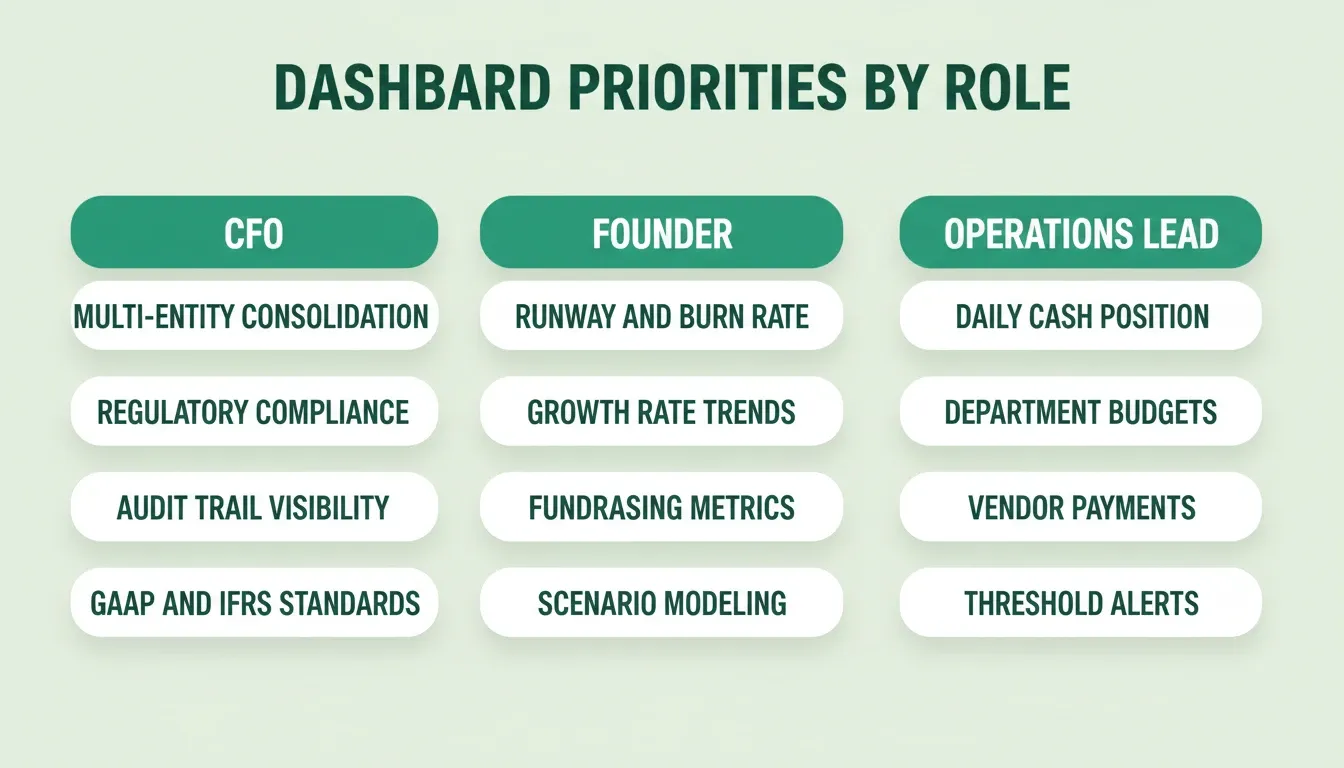
CFOs need multi-entity consolidation views, regulatory compliance indicators, and audit-trail visibility. Their prompts should reference GAAP or IFRS standards and include drill-down capability.
Founders prioritize runway, growth rates, and fundraising metrics. Their prompts should emphasize trend direction over absolute numbers and include scenario modeling.
Operations leads need daily frequency, department-level granularity, and action-oriented alerts. Their prompts should specify real-time refresh rates and threshold triggers.
Teams that run structured research before building find that role-specific dashboards get adopted three times faster than generic ones. Match the prompt complexity to the role. A CFO dashboard prompt might be 150 words, while an ops daily tracker can be 40 words and still produce exactly what the team needs.
How Rocket Turns One Finance Prompt into a Deployed App
Most AI tools generate a mockup or a static chart. Rocket produces a complete, deployed finance application from a single prompt. 1.5 million people have tried Rocket across 180 countries, from solo founders building their first revenue tracker to enterprise teams running full financial reporting infrastructure.
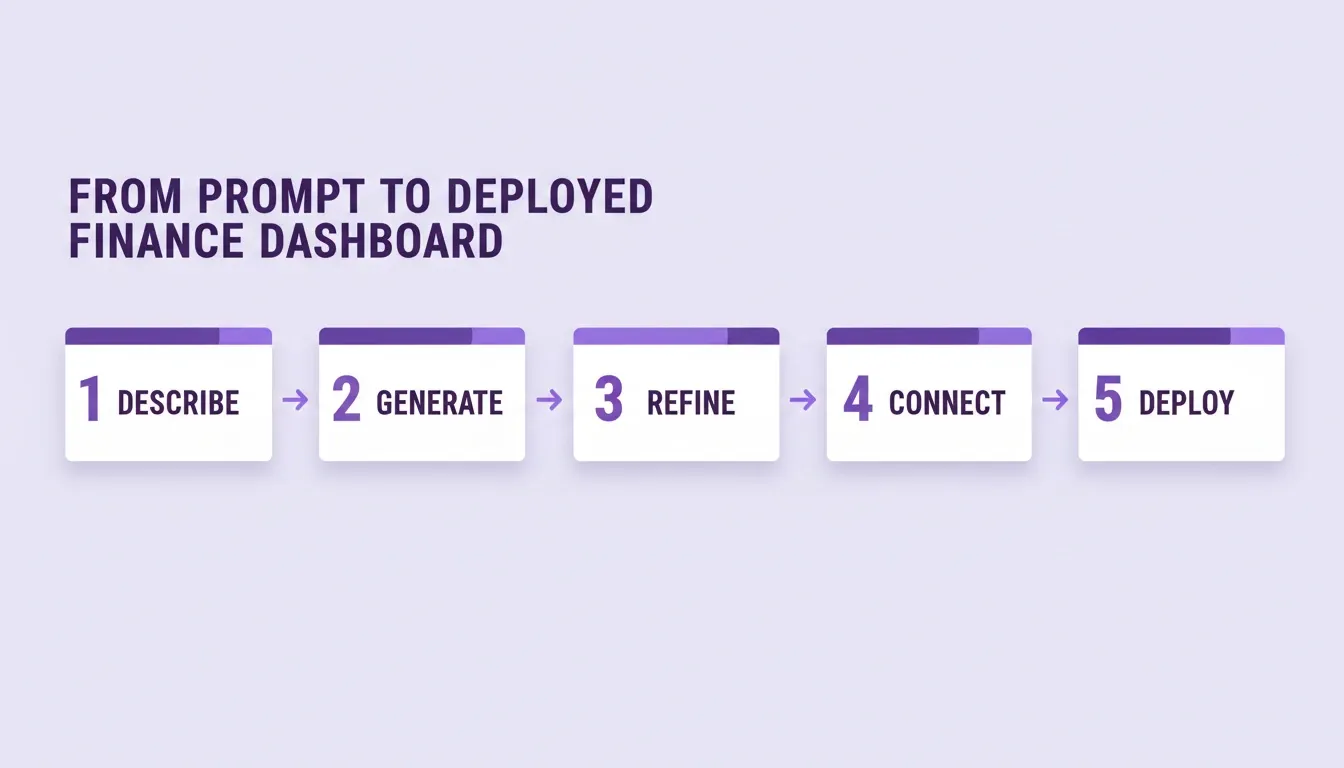
Here is exactly how the workflow runs.
Step 1: Describe your dashboard in plain language. Type something like: "Build me a SaaS metrics dashboard with MRR, churn, and runway tracking connected to Stripe." Rocket generates the entire application, including UI, backend logic, data connections, and deployment configuration. Most apps generate in one to three minutes.
Step 2: Review the live preview. Your dashboard appears as a fully interactive preview. Click through it, test the filters, and check the data layout. This is not a mockup. It is a working application you can interact with before deploying.
Step 3: Refine with follow-up prompts. Add specifics like "add a quarterly comparison toggle" or "add a red alert when runway drops below three months." Each refinement takes seconds. There is no change limit.
Step 4: Connect your data sources. Open the Connectors panel and authenticate your data sources. Stripe handles payments, Supabase handles your database, and Google Analytics handles traffic. Rocket connects 25 or more services out of the box. Authenticate once and they flow into every build.
Step 5: Deploy to a live URL. Click Launch. Your dashboard is live instantly with a shareable URL. Connect a custom domain, set up staging and production environments, and enable full version history, all from the same interface.
Every generated app ships with WCAG accessibility compliance, SEO-ready structure, GDPR coverage, and performance optimization by default. These are the baseline, not optional extras. You can explore the full platform capabilities in the Rocket documentation.
Security and Compliance for AI-Generated Finance Dashboards
Financial data requires a higher standard of care than most other dashboard types. Before deploying any finance dashboard, check these four areas.
Data access controls: Your dashboard should expose only the data each user role needs to see. When prompting, specify role-based access. For example: "CFOs see all entities, department heads see only their cost center, and board members get read-only access."
API key security: Rocket stores API keys encrypted at rest and never exposes them in client-side code. Keys are managed at the server level. Never paste API keys directly into chat. Always use the secure Connectors panel.
GDPR and compliance: For dashboards that include personally identifiable financial data, ask Rocket to add compliance features. Rocket's compliance tools cover GDPR consent categories, CCPA requirements, and privacy policy generation.
Audit trails: For CFO-level dashboards, include audit logging in your prompt. For example: "Add an audit log that records every data access event with timestamp and user ID." This is a standard requirement in most enterprise financial reporting environments.
Common Prompting Mistakes That Kill Dashboard Quality
Even well-structured AI prompts to create a finance dashboard fail when they include certain patterns. These are the most frequent issues that produce unusable dashboard output.
-
Vague metrics. Saying "show me financial performance" gives the AI too much latitude. Name the exact KPIs: MRR, gross margin, net cash.
-
Missing time context. Without a date range, the AI guesses. Always specify: "trailing 12 months," "this quarter," or "fiscal year to date."
-
Overloading one view. Cramming 15 metrics into a single screen produces clutter. Limit each dashboard view to 4 to 6 primary metrics.
-
Ignoring the audience. A dashboard for your CFO and a dashboard for your ops team need different density levels. State who will use it.
-
No conditional logic. Dashboards without alerts or thresholds become passive screens nobody checks. Add trigger conditions to make them actionable.
-
Skipping data source specification. A prompt that does not name the data source produces a dashboard with placeholder data. Always name where the numbers come from.
-
No iteration plan. Your first prompt produces a first draft. Plan for two to three follow-up prompts to refine layout, add edge cases, and connect live data.
Fix these seven patterns and your prompt success rate jumps from one-in-three to nearly every attempt producing a usable first draft.
Finance Dashboard Examples by Industry
The fifteen prompts in this guide cover SaaS and startup finance. Here is how to adapt the same prompt structure for other industries.
Retail and e-commerce: Replace MRR with daily sales volume, churn with return rate, and LTV with average order value. Add inventory turnover as a primary KPI. Use Stripe for payments and Supabase for inventory.
Professional services: Replace subscription metrics with project profitability, utilization rate, and billable hours per consultant. Add a pipeline value tracker. Connect your project management tool via REST API.
SaaS with usage-based billing: Add consumption metrics alongside subscription revenue. Track API calls per customer, storage used, and seats active. Stripe's metered billing API connects directly.
Non-profit and grant-funded organizations: Replace revenue metrics with grant utilization rate, program cost per beneficiary, and restricted versus unrestricted fund balances. Compliance reporting becomes the primary output.
The prompt structure works identically across all of these. Only the metric names and data sources change.
Build Finance Dashboards That Work as Fast as Your Business Moves
The fifteen AI prompts to create a finance dashboard in this guide cover every reporting layer. They address revenue tracking, budget planning, and investor reporting. Each prompt is specific enough to generate a working financial dashboard on the first attempt, without spreadsheet formulas or manual chart configuration.
As AI-generated dashboards become the standard for financial reporting, teams that build faster and iterate in real time will hold a clear operational advantage. The prompts here are a starting point. The real value comes from refining them for your specific data sources, your audience, and your reporting cadence.
You have the prompts. Start building on Rocket.new and get a production-ready financial app before your next reporting cycle.
Table of contents
- -Why Finance Teams Are Replacing Spreadsheets with AI-Built Dashboards
- -AI-Built vs Manually-Built Finance Dashboards
- -What Makes a Good Prompt for Generating Financial Dashboards?
- -Revenue Tracking and Cash Flow Prompts
- -Budget Planning and Expense Analysis Prompts
- -Investor Reporting and KPI Prompts
- -How to Customize Prompts by Role: CFO, Founder, and Ops Lead
- -How Rocket Turns One Finance Prompt into a Deployed App
- -Security and Compliance for AI-Generated Finance Dashboards
- -Common Prompting Mistakes That Kill Dashboard Quality
- -Finance Dashboard Examples by Industry
- -Build Finance Dashboards That Work as Fast as Your Business Moves