
Market signals like consumer sentiment, hiring data, and price movements reveal where a market is heading before it arrives. This guide covers the three signal types worth watching, how to build a monitoring routine, and how Rocket automates the signal layer so your team stays ahead without drowning in noise.
What if you could see a market shift coming?
The fastest teams do exactly that. They watch leading indicators price movements, hiring patterns, consumer sentiment and act before conditions change, not after.
The University of Michigan Consumer Sentiment Index hit 49.8 in April 2026, tracked at FRED, Federal Reserve Bank of St. Louis. That single read signaled demand pressure months before quarterly reports confirmed it.
Signals are structured patterns in data, price behavior, and competitive activity. They help analysts, traders, operators, and product teams make informed decisions before events become obvious.
This blog overs what counts as a meaningful signal, which types deserve your attention, and how to build a routine that works.
What Counts as a Signal Worth Tracking?
A signal is any piece of data that gives you a forward read on what buyers, competitors, or the economy are likely to do next. The best signals are leading rather than lagging, consistent across multiple sources, and tied directly to decisions you have to make.
-
Technical analysis covers price and volume patterns - moving average crossovers, buy signal formations, and breakout reads that capture momentum.
-
Fundamental analysis covers business health, earnings, and positioning across financial instruments and asset classes.
-
Market-based signals for operators include search volume spikes, competitor hiring shifts, pricing changes, and shifts in consumer sentiment.
-
Leading signals move before events become obvious that early window is where informed decisions create an edge in decision making.
Understanding the difference between these signal types helps you direct your research and monitoring resources where they matter most.
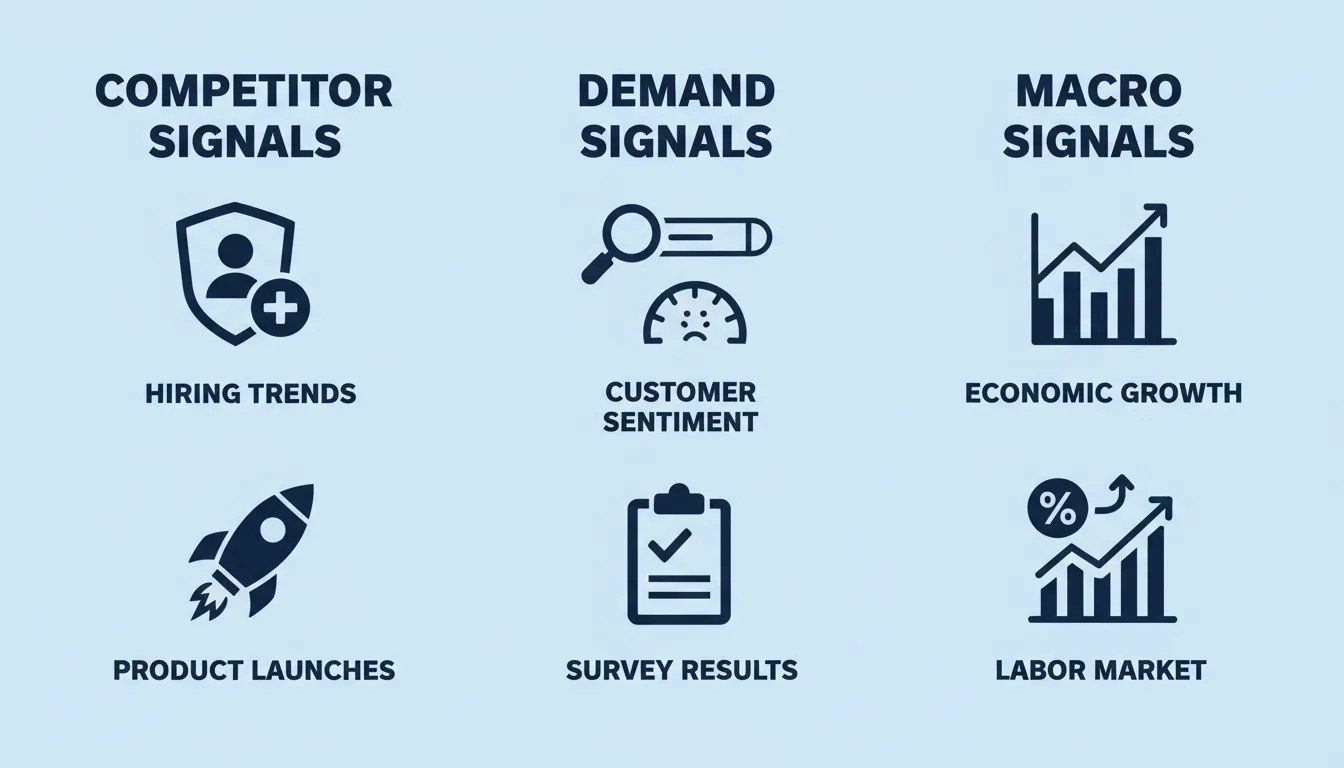 Three signal categories - competitor, demand, and macro - each with distinct data sources and strategic applications for teams tracking market shifts.
What Are Price Action and Volume Telling You?
Price action is one of the most-watched reads in the stock market. When a stock rises on rising volume, traders typically read it as a buy signal. When prices fall while volume surges, sell signals often follow.
-
The 50-day moving average is one of the most-used data points for determining whether a price trend is holding or reversing.
-
For non-finance teams, price signals look different - a competitor dropping prices 20%, rising material costs, or category-wide fee increases all count.
-
Tracking price movements in your category keeps you in contact with how competitive conditions are shifting before they affect your own numbers.
Price action provides valuable insights regardless of whether you are watching stocks or scanning competitive conditions in your industry. Teams that track what inconsistent AI outputs signal for product decisions apply the same pattern-recognition discipline to internal data.
What Does Consumer Sentiment Say About Demand?
Consumer sentiment surveys are among the clearest leading indicators for analyzing market conditions. When sentiment falls, demand for discretionary goods typically follows within one to two quarters. When it rises, trading decisions shift toward growth and investment across most asset classes.
-
The Conference Board Consumer Confidence data and University of Michigan surveys are the two most-tracked reads in the US.
-
Both release monthly and are directionally consistent - watching them together gives a cleaner read on consumer preferences and near-term behavior patterns.
-
A falling read signals demand risk for inventory planning, pricing strategy, and campaign timing well before quarterly results reflect it.
These surveys provide valuable insights that inform everything from product launch timing to capital allocation decisions.
| Signal Type | Data Source Example | What It Indicates |
|---|---|---|
| Price action | Stock exchange feeds | Buying or selling pressure, trend direction |
| Volume patterns | Trading platforms | Conviction behind price moves |
| Consumer sentiment | FRED, Conference Board | Future demand direction |
| Hiring signals | BLS JOLTS, LinkedIn | Competitor growth or contraction |
| Search trends | Google Trends | Category demand shifts |
| Product releases | Press releases, app stores | Competitor strategy changes |
Which Types of Signals Should You Actually Track?
Three broad buckets cover most of what matters for companies and investors alike. Each tells you something different about the environment your business or portfolio is operating in. Together, they provide a full picture you cannot get from any single source.
-
Competitor signals are the most immediately actionable: product launches, pricing changes, hiring patterns, and any announcement that shifts the competitive picture.
-
Demand signals reflect how buyers are behaving or are about to behave: search volume, social sentiment, survey data, and purchase patterns.
-
Macro signals operate at a higher altitude: the Leading Economic Index, interest rate spreads, equities trends, and labor market readings.
-
Reading all three in context - against each other and against your own data - is where the most reliable insights come from.
Knowing which bucket each signal falls into helps you set the right cadence and apply the right level of attention to each source.
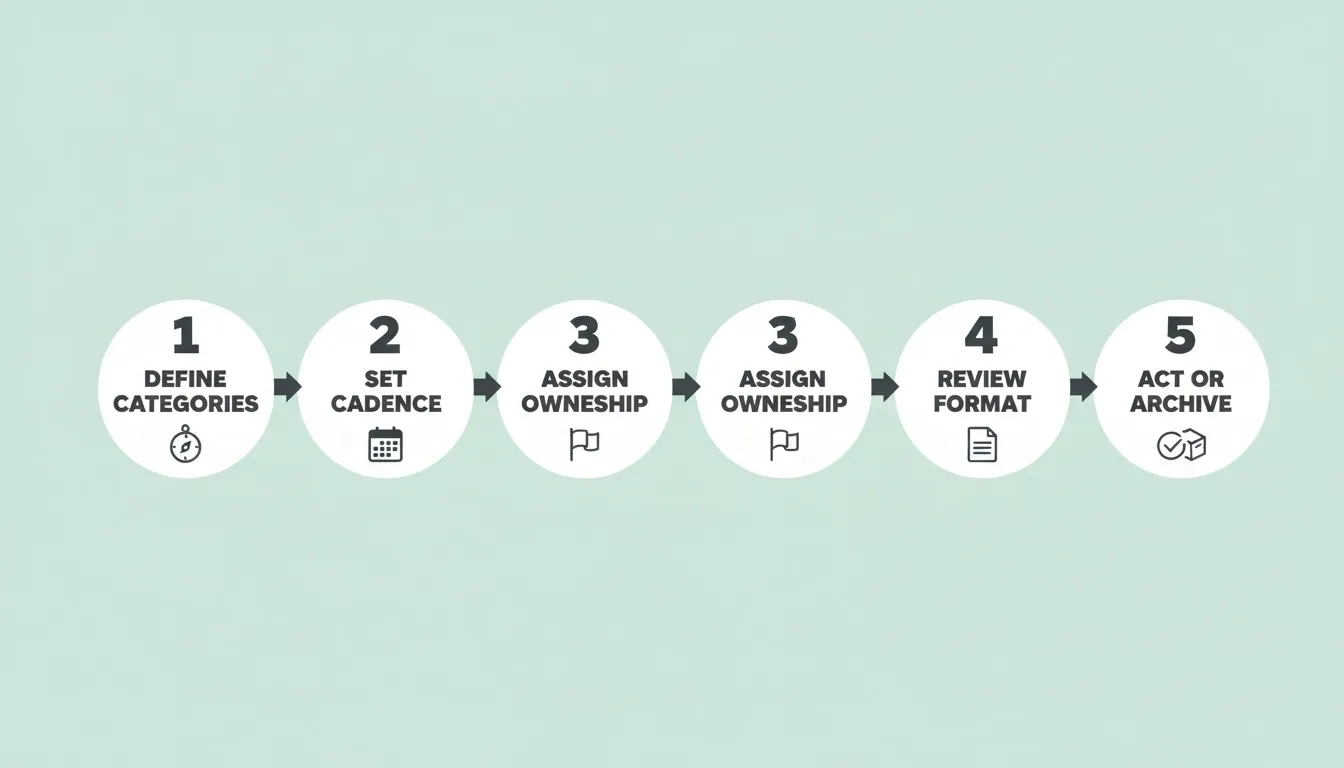 A five-step signal monitoring routine: define your categories, set a cadence, assign ownership, document interpretations, and act or archive based on convergence.
Are Competitor Signals the Most Actionable?
Competitor signals include new product launches, pricing changes, shifts in hiring, and any announcement that changes the competitive picture. Job openings data is one of the most underused reads in this category. When a rival posts 40 engineering roles in a new product area, that is a signal worth tracking.
-
The US Bureau of Labor Statistics reported 6.9 million job openings as of March 2026, but the sector breakdown shows where companies are directing resources (BLS JOLTS, March 2026).
-
Hiring signals often precede product launches by 6 to 12 months, making them one of the earliest competitor reads available.
-
Most operators miss this data because pulling and interpreting it manually, across multiple sources, is time-consuming without a dedicated system.
Without a signal-monitoring routine, identifying shifts in competitor strategy becomes a matter of chance rather than consistent research.
Understanding how competitor hiring signals reveal future strategic direction is one of the highest-leverage reads available to any team tracking market signals.
What Can Demand Signals Tell You?
Demand signals reflect how buyers are behaving - or are about to behave. The Conference Board Consumer Confidence Index dropped to 93.1 in May 2026, signaling that two-thirds of consumers were cutting back spending due to price pressures. That read directly shapes inventory, pricing, and marketing decisions.
-
Consumer preferences shift gradually, then quickly - missing the gradual phase is how teams get caught when demand drops faster than models predicted.
-
Demand signal detection requires multiple sources: survey data, marketplace behavior, search volume, and purchase patterns working together.
-
A real-time view of buyer behavior is more reliable than waiting for quarterly reports to surface what the data already told you weeks earlier.
Building a layered view of demand signals across multiple sources is what gives teams early warning when conditions are shifting.
Do Macro Signals Tell You Where the Economy Is Heading?
Macro signals include the Leading Economic Index, interest rate spreads, equities trends, financial instrument pricing, and labor market readings. When the LEI fell for six consecutive months between October 2025 and April 2026, it signaled broader pressure even where day-to-day metrics looked fine. Professional traders and economists use these indicators to map economic conditions months in advance.
-
Alfonso Peccatiello, founder of The Macro Compass, noted in May 2026: "Leading indicators also suggest the US labor market has found a bottom. The market is not fully prepared for it." (The Macro Compass, May 2026)
-
The gap between what leading indicators signal and where market consensus sits is where careful signal-reading delivers an edge in decision making.
-
Macro data informs risk management, investment timing, and strategic planning - not just financial trading decisions.
Reading macro, competitive, and demand signals together, rather than in isolation, is where contextual analysis creates a decisive advantage. Teams that integrate competitive intelligence into roadmap planning consistently outpace those reacting to lagging data.
How Do You Build a Signal-Monitoring Routine?
A monitoring routine is not a dashboard. Dashboards show you what has already happened - a routine keeps you in contact with what is about to happen. Both serve different purposes, and only one helps you act ahead of events.
-
Step 1 - Define signal categories: Pick two to three sources per bucket (competitor, demand, macro) and go deep rather than broad across all available feeds.
-
Step 2 - Set your cadence: Macro data monthly, demand signals weekly, competitor signals daily in fast-moving markets.
-
Step 3 - Assign ownership: One person owns the review and flags changes each week - rotating too often breaks pattern recognition.
-
Step 4 - Create a review format: Document your interpretation of each signal, not just the raw data. A shared document works well.
-
Step 5 - Act or archive: If two or more signals in the same category move in the same direction in one week, flag it for strategic review.
Most manual routines break under pressure - someone gets busy, cadence slips, and suddenly the team is months behind on signals that mattered. Pairing your routine with business workflow automation keeps the cadence intact even when bandwidth is tight.
How Rocket Reads the Signal Layer For You
Rocket.new's Intelligence product was built to solve exactly the problem that manual routines cannot hold. It monitors the signal layer for you, across nine signal categories, in real time, for any company you choose to follow. The difference from most tools is not data collection - it is interpretation.
-
Follow any entity: Choose companies, sectors, or topics and Rocket monitors each one continuously across all signal categories.
-
Nine categories in parallel: Pricing, hiring, product changes, news, and more all tracked without manual setup or maintenance.
-
Role-based interpretation: Signal patterns are read against your role and intent, so a growth team gets a different read from the same signals than an investor would.
-
Cross-channel delivery: Intel arrives in your app, email, or Slack with context and recommended interpretation - not a raw data feed to parse.
-
Macro coverage included: The same system that watches competitors reads broader market indicators, giving you one view of competitive context and demand environment together.
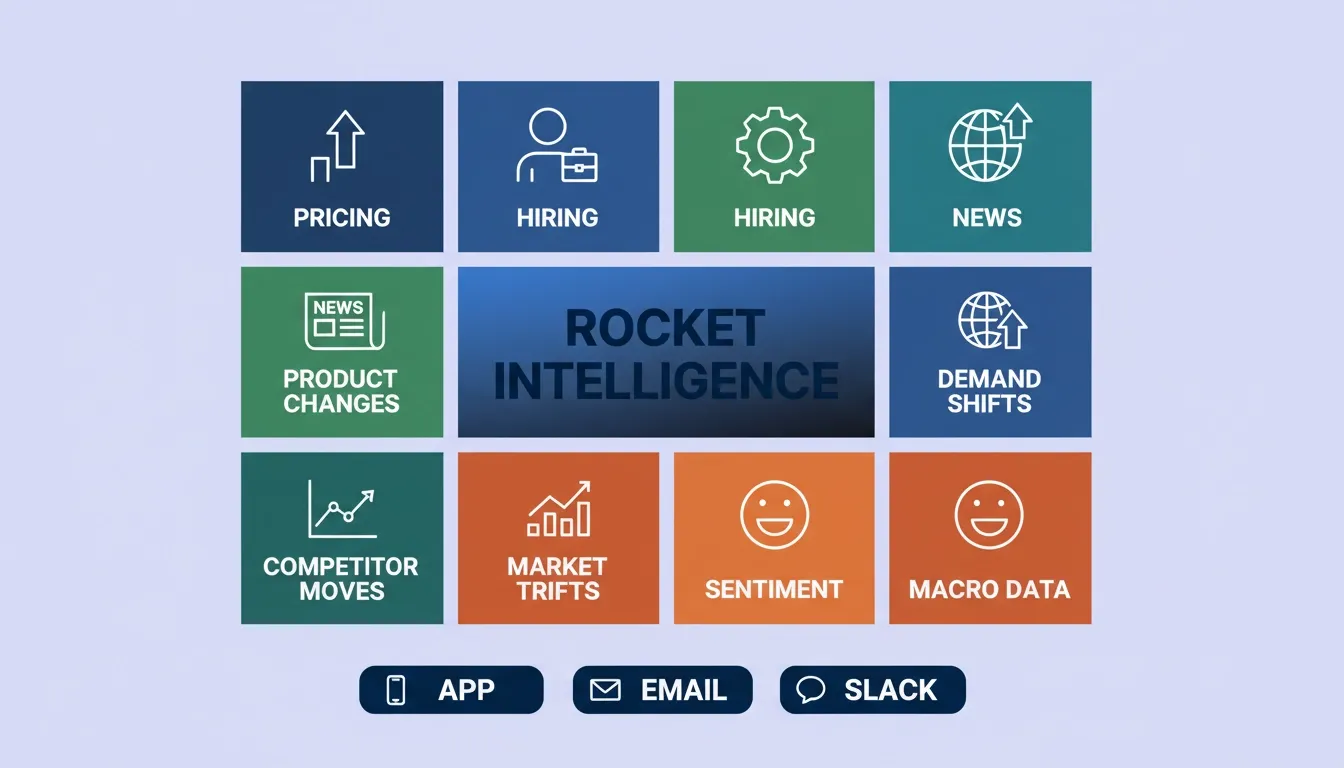 Rocket Intelligence tracks nine signal categories in parallel and delivers role-based interpretations via app, email, or Slack - no manual monitoring required.
Acting on What the Data Is Already Telling You
The indicators are always moving. Consumer sentiment surveys land every few weeks, competitor hiring changes daily, and macro data shifts monthly. The teams that stay ahead share one habit: they watch the leading data that predicts their results, not just the lagging data that confirms them. Start with one category, set your cadence, and commit to it.
Whether you are an investor watching stocks and economic conditions, or an operator tracking competitive and demand patterns, early reads on the right data give you time. That time is the one resource no amount of after-the-fact analysis can recover. Get the systems in place that keep you watching when you are busy with everything else.
Rocket's Intelligence product does the heavy lifting monitoring market signals, interpreting competitor moves, and surfacing demand shifts before they show up in your quarterly numbers. Start tracking market signals with Rocket and stop reacting to data that already happened.
Table of contents
- -What Counts as a Signal Worth Tracking?
- -What Are Price Action and Volume Telling You?
- -What Does Consumer Sentiment Say About Demand?
- -Which Types of Signals Should You Actually Track?
- -Are Competitor Signals the Most Actionable?
- -What Can Demand Signals Tell You?
- -Do Macro Signals Tell You Where the Economy Is Heading?
- -How Do You Build a Signal-Monitoring Routine?
- -How Rocket Reads the Signal Layer For You
- -Acting on What the Data Is Already Telling You