
Build a creator analytics dashboard app no-code by connecting social APIs to Supabase, visualizing engagement with charts, and filtering by platform or date. Rocket.new generates production-ready Next.js code from a single prompt. No coding needed.
Why Is Scattered Analytics Costing You Real Decisions?
You can build a creator analytics dashboard app with no code by using Rocket.new to pull data from social platform APIs into Supabase, turn that data into interactive charts, add platform and date filters, and deploy a live dashboard without writing code.
For solo creators, agencies managing multiple creators, brand partners who need cleaner reporting, or anyone trying to replace scattered social insights with one usable view, that matters because most content decisions break down when performance data is split across dashboards that do not line up.
The creator analytics AI market grew from $3.24 billion to $3.91 billion between 2024 and 2025, expanding at a 20.7% CAGR. That number is probably larger than it sounds: it lumps enterprise social listening suites that most solo creators will never touch alongside the lightweight tools actually relevant to independent builders.
The Problem Most Creators Hit is Not Lack of Data
"It is data fragmentation."
YouTube analytics sit in one tab. Instagram insights are another. TikTok's dashboard uses completely different metric definitions. When your performance data lives in four separate places with four different time ranges, you stop noticing cross-platform patterns until it is too late to act on them.
Let's find out where that fragmentation hurts, which dashboard features actually matter, how the data flow works from API to database to charts, how to build the app step by step in Rocket.new, which metrics to track, how no-code options compare, and which common mistakes to avoid.
Three situations where this breaks down hardest:
Agencies managing ten creators across four platforms are running forty separate dashboards. Spotting which content format is driving results across the portfolio requires manual exports, spreadsheet merges, and a lot of guesswork.
A unified no-code dashboard eliminates that entirely.
Solo creators making monetization decisions, like which format to double down on or which platform to deprioritize, are doing so without revenue-per-post data.
Native analytics show impressions. They rarely show what actually converts.
Brand partners asking for performance reports get whatever you can pull from screenshots and CSV exports.
A client-facing dashboard that updates automatically changes that relationship from reactive to professional.
The global creator economy reached $149.4 billion in 2024 with over 207 million active creators producing content worldwide. The users who consolidate all their performance data into a single source of truth gain a real edge.
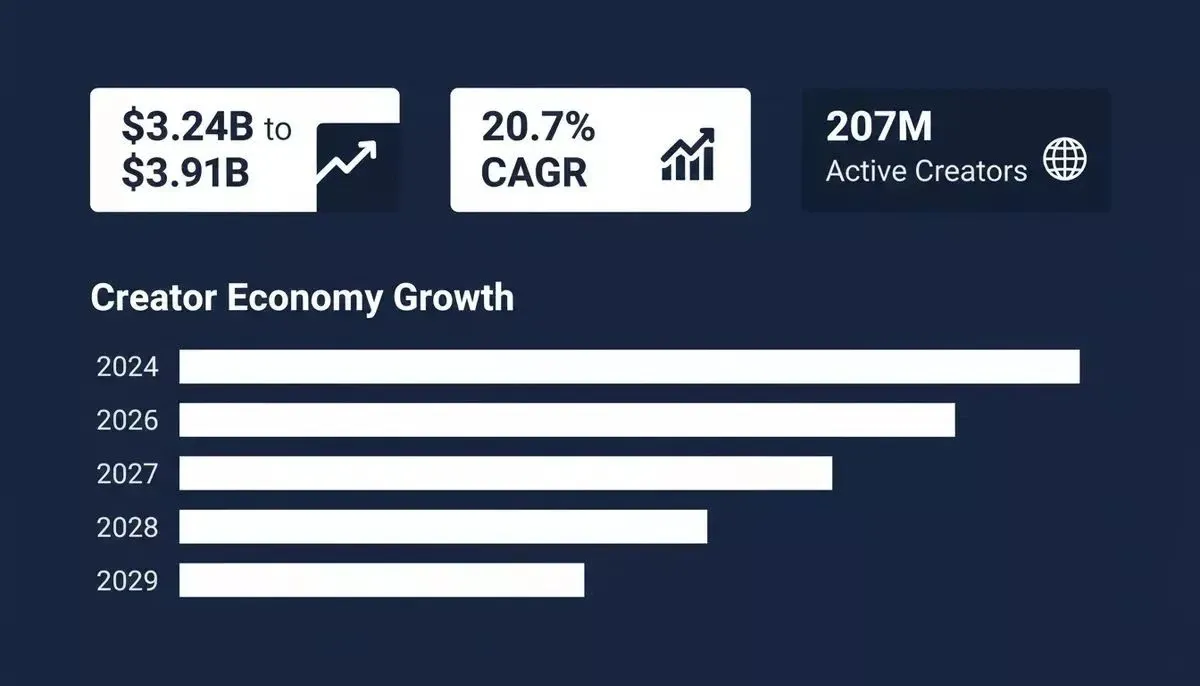
Creator analytics market data: $3.24B to $3.91B growth, 20.7% CAGR, projected to reach $8.2B by 2029.
What a No-Code Analytics Dashboard Actually Needs
Before you build, get clear on what the dashboard must do. Most first attempts fail not because the no-code tool is wrong but because the builder tried to show everything at once.
Social API data flows through authentication, normalization, and Supabase storage before rendering in your live creator dashboard.
Data connectors that match where you actually publish
Your no-code dashboard builder needs to pull from the platforms in your stack. For most creators, that means YouTube, Instagram, TikTok, and X. Some no-code platforms handle this through pre-built API connectors; others let you import data via Google Sheets or Airtable as an intermediary. Know which approach your tool uses before you start.
Filterable views, not static reports
A dashboard that shows the last 30 days' engagement by default is useful once. A dashboard where you can filter by platform, content type, date range, and campaign is useful every morning. Interactive charts with dropdown menus and date pickers are the difference between a report and a tool.
A layout you can change without rebuilding
Your reporting needs will shift. The agency view you need for a client differs from the personal morning snapshot you want for yourself. Visual editing matters more than any specific chart type, and a drag-and-drop interface inside the layout editor is what lets you rearrange dashboard elements without rebuilding. Modern no-code tools can also use AI to suggest data visualizations or generate a first dashboard structure.
Rocket.new's visual edit feature lets you click any element in the preview and update text, style, spacing, or images without writing code.
Automated sync, not manual exports
If you have to re-export a CSV every time you want fresh data, you will stop using the dashboard within two weeks. Real-time sync from connected data sources keeps your charts current without any manual work.
Access control for shared dashboards
You may want to publish the dashboard as a website or embed it in other tools before deciding who gets what level of access. The moment you share analytics with a brand partner or agency client, you need role-based permissions. Set this up from day one, because adding it retroactively is painful.
What to leave out of version one: pie charts for every metric, a full content calendar integration, automated posting, and any feature that requires a separate login flow. Build the core view first. Add complexity only after you have used it for two weeks and know what you actually look at.
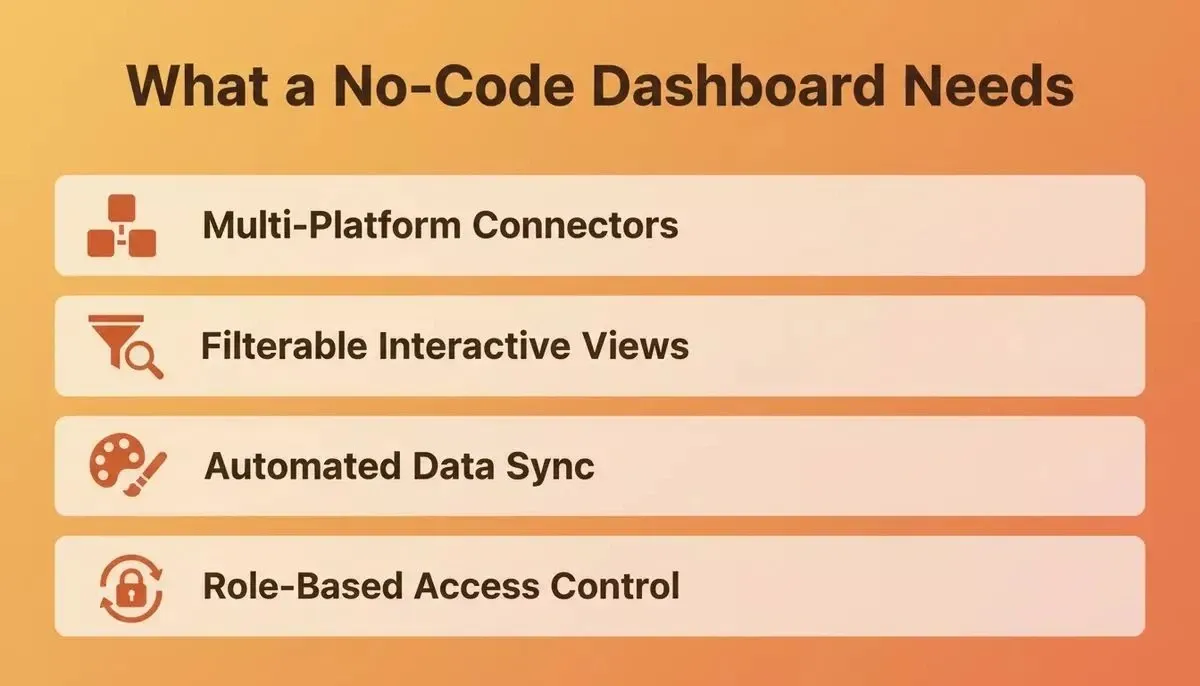
The five non-negotiables for a creator analytics dashboard that you will actually use every day.
Inside the Data Pipeline: From API Call to Live Chart
Understanding what happens between "data leaves Instagram" and "number appears in your dashboard" helps you make better decisions when something breaks, and something always breaks on the first build.
OAuth tokens and API keys are the entry point
Each social platform requires authorization before it hands over data. Instagram uses OAuth; you authorize once, and the connector handles token refresh automatically. YouTube's Data API uses API keys stored as environment variables. Rocket.new stores these securely so they never appear in client-side code, which is a key part of building secure apps without a developer.
Rate limits are the constraints you plan around
Instagram's API limits how many requests you can make per hour. A well-designed no-code dashboard schedules fetches, pulling daily engagement stats once per day and weekly reach data on a schedule, rather than hitting the API on every page load. For high-traffic dashboards, caching data in Supabase avoids hitting rate limits entirely.
Normalization is where most DIY dashboards fail
YouTube measures "views." Instagram measures "impressions" and "reach" differently. TikTok has its own definitions for engagement. The connector layer needs to translate these into standardized metrics before storing them, or your comparison charts will be comparing apples to spreadsheets.
Supabase stores and serves the normalized data
Once your engagement data lands in a structured Supabase database, organized by date, platform, content type, and metric, your dashboard can query it with filters without touching the social APIs again. Row-level security policies mean each user or client only sees their own data.
The frontend reads from the database and renders charts
Filter changes trigger new queries. Charts update without page reloads. The whole thing feels live even though the underlying data is refreshed on a schedule.
AI-driven creator analytics tools are projected to reach $8.2 billion by 2029, reflecting massive investment in exactly this pipeline. The no-code platforms that automate this flow without requiring developers are gaining the most traction among small businesses and solo creators.
Build Your Creator Analytics Dashboard on Rocket.new: Step by Step
Here is the exact process for building a creator analytics dashboard using Rocket.new's no-code app builder, including the prompt that generated the first version and what needed one iteration to fix.
Step 1: Start from a prompt or template
Open Rocket.new and describe your dashboard in the Build tab. Rocket.new is a user-friendly option for app building, and you can build dashboards from a prompt or a dashboard template. For a custom analytics dashboard, starting from a prompt gives you more control over the data structure.
The prompt used for the dashboard shown below:
"Build a creator analytics dashboard that shows YouTube views, Instagram reach, and TikTok engagement side by side. Include a date range filter, a platform filter, a line chart for trend over time, a bar chart for platform comparison, and a table showing top posts by engagement rate. Connect to Supabase for data storage. Use a dark theme."
Rocket.new generated the full dashboard layout, including navigation, chart components, filter controls, the user interface, and the Supabase schema, in a single generation pass. From there, the first version can be built in minutes with a drag-and-drop workflow.
Step 2: Connect Supabase as the database layer
After the first generation, Rocket.new prompts you to push an SQL migration script to Supabase. This creates the tables your dashboard needs: a posts table, a metrics table, and the row-level security policies that scope data to each user. You review the script, click Push to Supabase, and the schema is live. You do not write the SQL; Rocket.new generates it. But you do review and push it, which takes about 30 seconds.
One thing that needed a fix on the first build: the engagement rate calculation was pulling raw counts rather than computing the rate as a percentage of reach. One follow-up message resolved it in the next generation: "Fix the engagement rate column to show likes plus comments divided by reach, formatted as a percentage."
Step 3: Wire up your data sources
For the social API connections, the approach depends on the platform. Rocket.new supports 26+ third-party connectors out of the box and can connect to any REST API via Postman, cURL, or Swagger imports. Some no-code tools take a different route: Glide app connects with Google Sheets, Airtable, and SQL databases, while Rows connects directly to over 50 data sources for automation. Rows also supports up to 100,000 rows per table for operational reporting from multiple sources.
-
Instagram: Rocket.new's Instagram connector handles OAuth authorization and can display feed data directly. For analytics data beyond what the connector exposes, use the Instagram Graph API with credentials stored as environment variables in Rocket.new.
-
YouTube: Use the YouTube Data API v3. Store your API key as an environment variable, then ask Rocket.new to build the fetch logic: "Add a daily fetch that pulls YouTube video stats for my channel and stores them in the metrics table."
-
Google Sheets as an intermediary: For platforms without a direct connector, export data to Google Sheets and connect Rocket.new to pull from it. This works well for TikTok, where API access is more restricted. Dashboards can also integrate with tools like Slack and Gmail for notifications, either directly in some platforms or through Zapier workflows. Glide supports Slack and Gmail notifications; Formaloo integrates with Slack, Stripe, and Google Sheets, and Zapier connects no-code apps to thousands of other tools.
Step 4: Customize the layout with visual editing
Click any element in the preview to customize the interface and whole dashboard visually—text, colors, spacing, or chart type, with no code needed. For bigger structural changes, describe them in chat. Example: "Move the platform comparison chart above the trend line and add a summary row at the top showing total reach this week." Other no-code software, such as Formaloo, emphasizes functionality with 50+ building blocks, while Rocket.new handles similar customization through visual editing and prompts.
Step 5: Deploy and share
When the dashboard looks right, publish it with one click to hosting and a live website URL. Rocket.new handles hosting and gives you a live URL. For client-facing dashboards, set up role-based access so each client sees only their data. Custom dashboards make it easier to share insights when collaboration features, data security, and role-based access are set up from the start. Ask Rocket.new to add auth and RLS policies scoped to user ID.
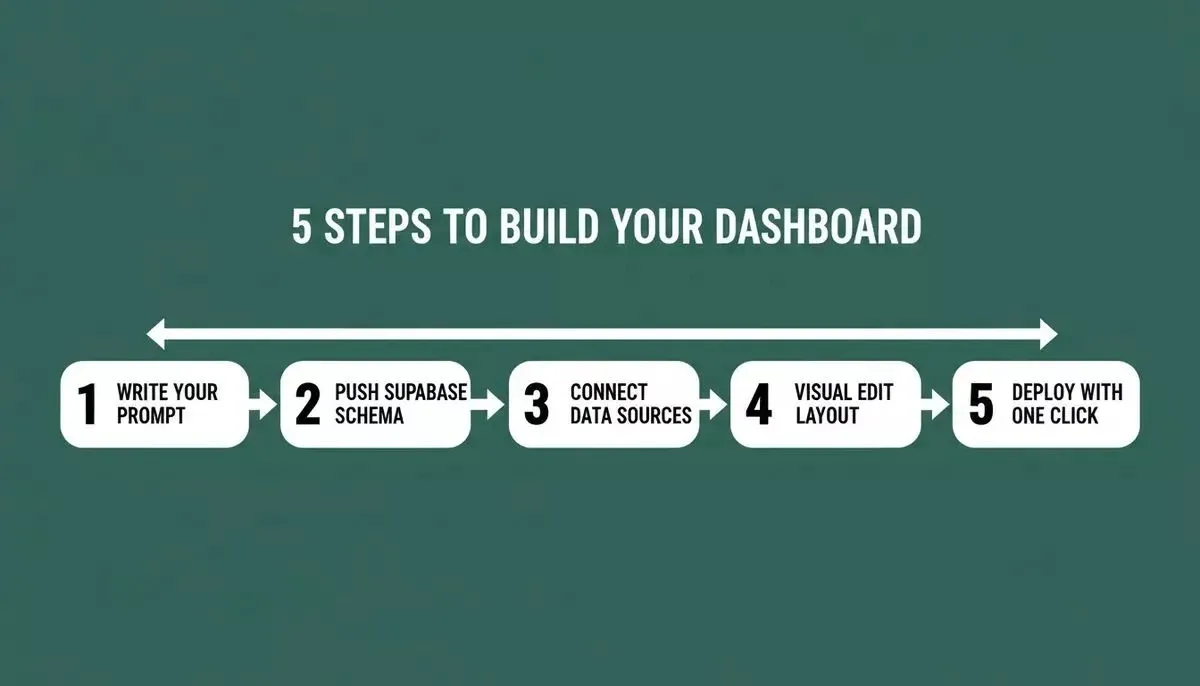
The five-step build flow on Rocket.new: from prompt to deployed creator analytics dashboard. Platforms such as Formaloo are used by over 25,000 businesses for dashboard creation and data insights, which shows how important sharing and permissions are once dashboards move beyond personal use.
Which Metrics Actually Tell You What Is Working?
Having a dashboard is only useful if you are tracking the key metrics that matter for business data, not vanity numbers. Too many creators fill their screens with vanity numbers that look impressive in a screenshot but do not inform a single content decision.
Engagement rate by content type, not total likes
A Reel with 2% engagement from 10,000 views drives more algorithmic distribution than a carousel with 50 likes from 100,000 impressions. Your dashboard should calculate engagement rate per format automatically, using likes plus comments divided by reach, and surface it as the primary metric rather than an afterthought.
Revenue per post
Tracking affiliate clicks, brand deal conversion, and subscription revenue per piece of content shows which formats generate money rather than just attention. Most creators do not track this because it requires joining analytics data with revenue data. A custom dashboard built on Supabase can do this join; native platform analytics cannot. Understanding how to build an app with database integration is the key to unlocking this kind of cross-data reporting.
Audience growth velocity, not follower count
Raw follower count is a lagging indicator. The rate of change week over week, segmented by platform and content type, tells you whether your current strategy is working before the numbers get big enough to feel meaningful.
Format performance trends over 90 days
What worked last month might not work now. A line chart showing engagement by format over a rolling 90-day window surfaces algorithm shifts before you feel them in your numbers. This is the chart most creators say they check every Monday.
Gartner predicts that by 2025, 70% of new enterprise applications will use low-code or no-code platforms, up from less than 25% in 2020. The same shift is happening in creator tools: the analytics apps that win are the ones creators can build and modify themselves without waiting for a developer to add a new metric.
Your dashboard should surface decisions, not just numbers. Configure it to flag anomalies, highlight top-performing posts, and support faster data analysis so teams can make data-driven decisions from a weekly summary they can share with clients or the rest of the team.
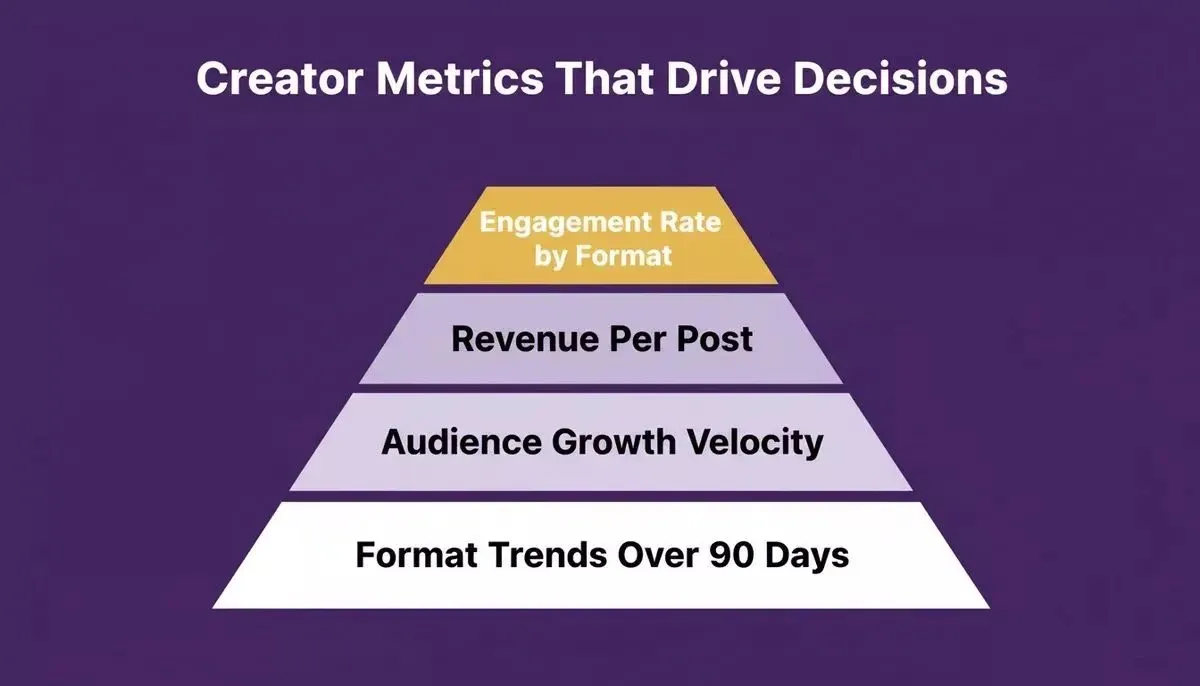
Prioritize these four metrics in your dashboard for decisions that actually move your content strategy forward.
No-Code Dashboard Builder Comparison
Choosing the right no-code dashboard builder depends on your data sources, how much customization you need, and whether you want to own the code when you are done. Different options also vary in learning curve, the coding skills they expect, and whether they act as a unified platform for app building and reporting.
| Tool | Code Output | Social API Support | Visual Editing | Database | Best For |
|---|---|---|---|---|---|
| Rocket.new | Next.js / Flutter | Via API connectors + env vars | Click-to-edit | Supabase | Custom creator dashboards with owned code |
| Glide | Proprietary | Google Sheets only | Yes | Spreadsheets | Simple spreadsheet-based views with a user-friendly interface and minimal coding skills |
| Bubble | Proprietary | Plugin-based | Yes | Internal DB | Complex multi-step workflows |
| Retool | React | 50+ connectors | Yes | Internal business dashboards | |
| Looker Studio | None | Google ecosystem | Limited | BigQuery | BI tools for reporting from Google data |
Some no code tools use drag-and-drop interfaces to build dashboards, while Rows connects directly to over 50 data sources and supports up to 100,000 rows per table for operational reporting.
The key difference with Rocket.new: you get production-ready Next.js code you own, can download, and can connect to GitHub. That gives you a more complete alternative to a fragmented tech stack built from all the tools stitched together. Every other tool in this table locks you into a proprietary runtime. For a creator analytics dashboard that you want to customize over time, or hand to a developer later, owning the code matters.
Rocket.new also integrates with Mixpanel and Google Analytics for tracking both content performance and audience behavior. If you are evaluating alternatives, the comparison of no-code app builders for startups covers the key differences in depth.
Common Pitfalls When Building Your First Dashboard
Speed is the trap. Building a no-code dashboard is fast enough that you can ship something broken in an afternoon and not realize it until a client is looking at the wrong numbers.
Displaying everything on one screen
Start with five important metrics on the main view. Add drill-down pages for detailed breakdowns. Every dashboard that tries to show all data at once gets abandoned within a month. The cognitive load is too high to make it a daily habit.
Skipping mobile
Creators check analytics from their phones. A dashboard that does not adapt to smaller screens gets ignored. Rocket.new generates responsive layouts by default, but verify this in the preview before you deploy.
Using Google Sheets as your only database
It works for a hundred rows. After six months of daily data, it slows down and breaks. Start with Supabase from day one. The migration later is painful and avoidable.
Not planning access control before sharing
Once you share a dashboard URL with a brand partner, adding row-level security retroactively means rebuilding the auth layer. Set it up in the initial prompt: "Add Supabase auth so each user only sees their own data."
Trying to normalize all platforms manually
TikTok, YouTube, and Instagram define "engagement" differently. If you build the normalization logic yourself in a spreadsheet, you will maintain it forever. Ask Rocket.new to handle the normalization in the data fetch layer so the database always stores standardized metrics.
The best starting point is an AI-powered API builder with built-in authentication that handles responsive design, Supabase integration, and access control out of the box. Build the core view first, then layer in complexity.
Avoid these five mistakes to ship a dashboard that stays useful beyond the first week.
Ship Custom No-Code Dashboard Today!
A dedicated analytics dashboard is no longer a luxury reserved for teams with developers. Rocket.new makes it possible for any creator or agency to ship a custom no-code dashboard, connect their social data, and start making informed decisions backed by real numbers.
Start building your creator analytics dashboard on Rocket.new and deploy a live app without writing a single line of code.
Table of contents
- -The Problem Most Creators Hit is Not Lack of Data
- -What a No-Code Analytics Dashboard Actually Needs
- -Data connectors that match where you actually publish
- -Filterable views, not static reports
- -A layout you can change without rebuilding
- -Automated sync, not manual exports
- -Access control for shared dashboards
- -Inside the Data Pipeline: From API Call to Live Chart
- -OAuth tokens and API keys are the entry point
- -Rate limits are the constraints you plan around
- -Normalization is where most DIY dashboards fail
- -Supabase stores and serves the normalized data
- -The frontend reads from the database and renders charts
- -Build Your Creator Analytics Dashboard on Rocket.new: Step by Step
- -Step 1: Start from a prompt or template
- -Step 2: Connect Supabase as the database layer
- -Step 3: Wire up your data sources
- -Step 4: Customize the layout with visual editing
- -Step 5: Deploy and share
- -Which Metrics Actually Tell You What Is Working?
- -Engagement rate by content type, not total likes
- -Revenue per post
- -Audience growth velocity, not follower count
- -Format performance trends over 90 days
- -No-Code Dashboard Builder Comparison
- -Common Pitfalls When Building Your First Dashboard
- -Displaying everything on one screen
- -Skipping mobile
- -Using Google Sheets as your only database
- -Not planning access control before sharing
- -Trying to normalize all platforms manually
- -Ship Custom No-Code Dashboard Today!