
Building AI apps without production observability leaves teams blind to drift, errors, and cost spikes. This blog covers every layer of a complete strategy for monitoring AI applications, from LLM tracing and hallucination detection to unified workflows that keep development and monitoring in the same place.
Most AI applications fail silently in production.
The 2026 Stanford HAI AI Index Report found that organizational AI adoption reached 88% globally, yet documented AI incidents rose to 362 in a single year.
The gap between building and monitoring creates blind spots that cost teams weeks of debugging time. Without continuous visibility, teams cannot catch data drift, hallucination spikes, or latency issues before they reach customers.
AI observability is the practice of gaining full visibility into how AI systems behave in production. It answers not just whether systems are running, but whether they are running correctly.
Why Does AI Observability Matter in Production?
Here is why AI observability matters for every team shipping AI powered applications:
-
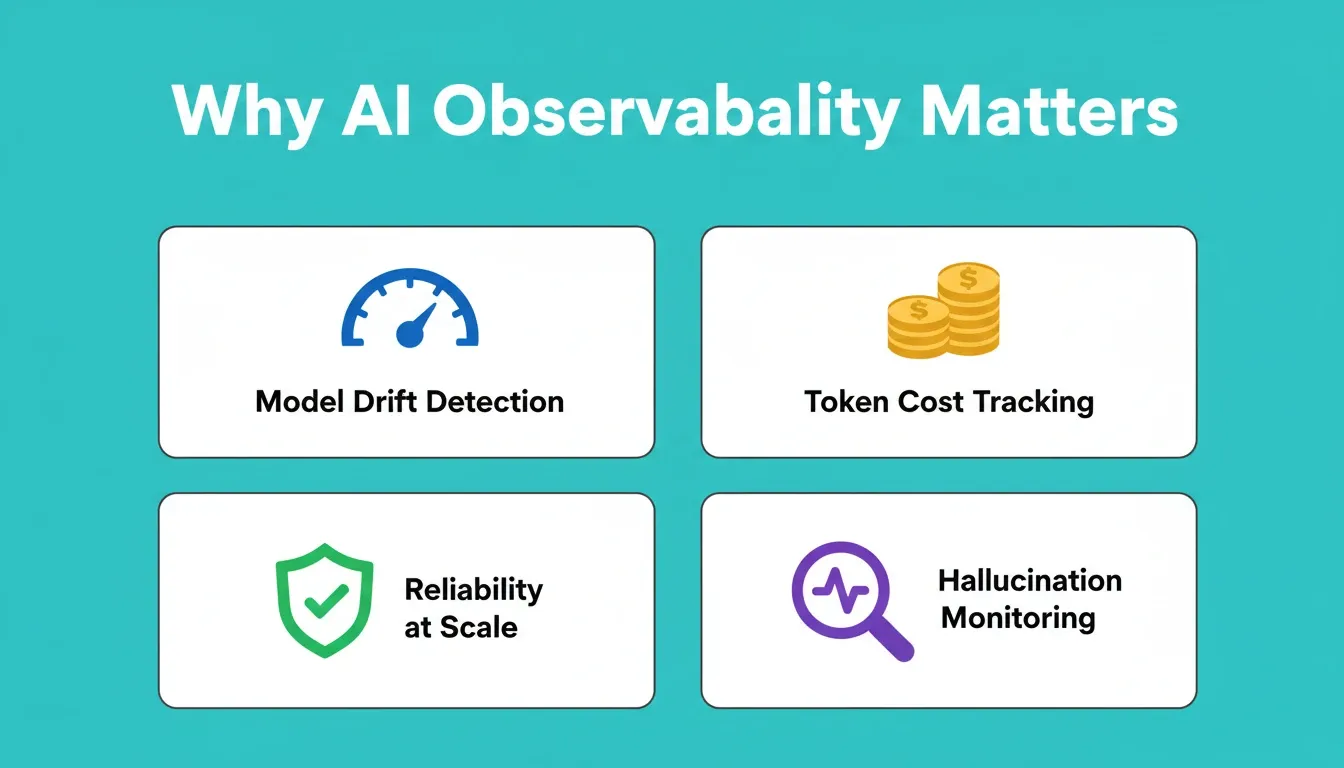
Model drift happens faster than teams expect. Production data shifts over time, and models trained on historical patterns start producing outputs that no longer match business expectations. Without drift detection, model performance degrades gradually until someone files a support ticket weeks later.
-
Latency and cost spiral without real-time tracking. AI systems that process thousands of requests per day generate unpredictable infrastructure costs. A single prompt change can double token usage, and without monitoring tools in place, the budget impact surfaces only at invoice time.
-
Reliability becomes non-negotiable at scale. For enterprise teams in regulated industries, model accuracy connects directly to customer trust. One hallucination in a healthcare or financial AI application can trigger legal exposure and erode confidence in the entire AI stack.
-
Observability gives engineers confidence to ship faster. When teams have full visibility into model performance and agent behavior, they spend less time debugging in production and more time building features that matter.
AI observability is the foundation that makes everything else reliable. Teams that invest early in monitoring their AI systems save time, reduce risk, and maintain the trust their customers expect.
Teams building full-stack solutions with AI need this kind of visibility from day one, not as an afterthought bolted on months after launch.
What Should Your AI Monitoring Stack Cover?
A complete AI monitoring approach covers more than uptime checks. It requires visibility across the entire AI stack, from infrastructure to model outputs to security controls.
| Monitoring Pillar | What It Tracks | Why It Matters |
|---|---|---|
| Infrastructure monitoring | GPU usage, memory, network logs, compute cost | Prevents resource waste and latency issues |
| Model performance | Accuracy, drift, response quality, hallucination rate | Catches degradation before users notice |
| Token and API usage | Token consumption, request volume, cost per call | Controls spend and prevents budget overruns |
| Tracing and observability | End-to-end request flow, tool calls, agent behavior | Identifies root cause of failures fast |
| Security and compliance | Data access patterns, sensitive data exposure, policy violations | Keeps teams compliant and data safe |
| Evaluation and testing | Output quality scoring, A/B testing, human feedback loops | Validates that changes improve outcomes |
Many tools cover one or two pillars well but leave gaps in others. The challenge most organizations face is stitching together monitoring tools that were never designed to work together. Multiple teams end up relying on disconnected dashboards, each providing only a partial view of system health.
The AI market reached $601.93 billion in 2026 with a 29.3% CAGR, and a significant portion of that growth flows into observability and monitoring infrastructure. Teams running AI monitoring workflows need specialized tools that provide deep tracing for LLM applications alongside traditional APM capabilities.
In addition, when selecting your stack, consider whether you need AI workflow automation tools that handle the full cycle or point solutions for specific monitoring needs.
How Traditional ML Tracking Falls Short for LLM Applications
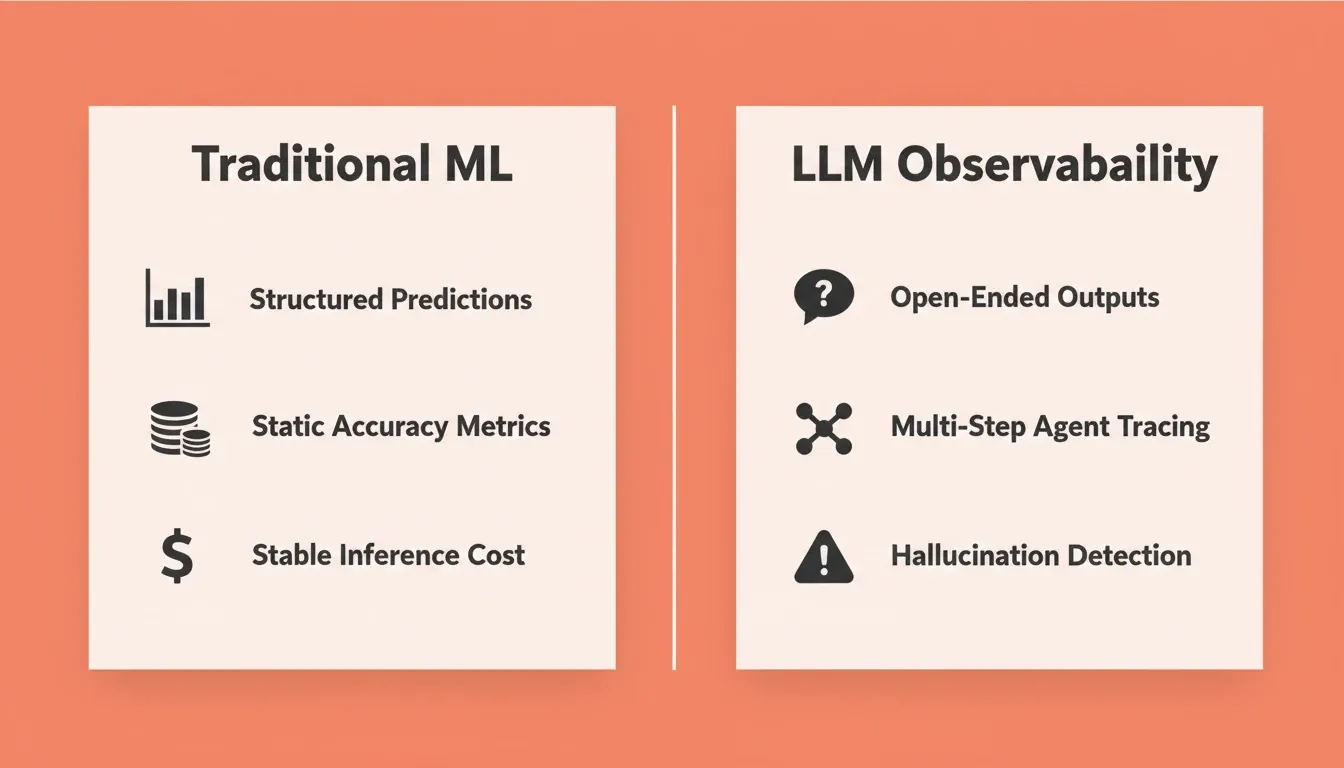
Traditional ML monitoring was designed for a different kind of AI. It tracked model accuracy on static datasets, measured feature importance, and flagged when input distributions shifted. That approach worked well for classification models and regression systems with structured outputs.
However, LLM applications and AI agents introduce challenges that traditional ML frameworks were never built to handle:
-
LLM applications generate open-ended outputs. Traditional ML models produce structured predictions like classification labels and numeric scores. Large language models produce free-text responses that simple accuracy metrics cannot evaluate. Teams need evaluation frameworks that assess relevance, coherence, and factual grounding across thousands of model responses per day.
-
AI agents make autonomous decisions. Unlike traditional ML pipelines with fixed input-output patterns, AI agents chain tool calls, access databases, and make multi-step decisions. Monitoring agent behavior requires distributed tracing that follows the full decision path. When agents fail, the root cause often hides three or four steps back in the chain.
-
Hallucination is the new failure mode. In traditional ML, errors are quantifiable. A misclassification has a clear label. Generative AI hallucinations are harder to detect because the output reads as confident and well-formed. Catching hallucination requires real-time evaluation that compares outputs against source data.
-
Cost scales unpredictably with every change. LLM applications burn through tokens at rates that change with every prompt update, every model response expansion, and every new feature added to the workflow. Monitoring AI usage at the prompt level is a non-negotiable practice for teams that want to control spend.
As a result, engineering teams that adapt traditional ML tracking for LLM applications end up with blind spots in exactly the places where failures happen most. Teams scaling AI apps for operations teams face these challenges daily and need monitoring that grows with their systems.
Choosing the Right Tool for AI Observability
The AI observability market now includes dozens of options, from open-source frameworks to enterprise platforms. Each tool makes different tradeoffs between depth, breadth, and ease of setup.
New Relic AI monitoring provides a full-stack observability approach that connects AI monitoring with traditional APM, infrastructure monitoring, and logs in one platform. New Relic covers LLM tracing, token tracking, model performance dashboards, and custom alerts. Its strength is connecting AI observability to your existing infrastructure view, giving engineers a single place to find root cause issues. New Relic supports monitoring for AI models running on AWS Bedrock, Google Cloud Platform, and Azure environments. For smaller teams, the platform can feel heavyweight. It requires investment in the broader observability stack to get full value from AI-specific features.
Arize AI focuses specifically on ML and LLM observability with deep evaluation capabilities. Arize AI provides drift detection, evaluation metrics, tracing for agent-based systems, and embedding analysis out of the box. It suits teams that want deep AI-specific insights without the overhead of a full APM platform. The tradeoff: it does not cover general infrastructure monitoring, so teams still need other AI tools alongside it for complete stack visibility.
Open-source options like LangSmith, Phoenix (by Arize), and OpenTelemetry-based solutions give teams control and flexibility over their monitoring approach. These frameworks work well for startups and engineering teams that prefer to build their own observability stack. The limitation is that open-source tools require more engineering time to configure, maintain, and scale. That is time not spent building product features.
The AI monitoring market reached $1,833.4 million by 2025 with a CAGR of 28.664%, reflecting how seriously organizations invest in production AI visibility. Beyond tool selection, teams can also explore AI integration strategies that connect monitoring tools into a cohesive production stack.
What Built-In Analytics Looks Like in a Unified AI Workflow
Most teams treat monitoring as a separate project that begins after launch. The result is a gap: the application is live, users are arriving, and the team is still configuring dashboards in a separate tool. A unified workflow closes that gap by making observability a default, not a configuration task.
When you build and deploy with Rocket, every deployed project includes a built-in analytics dashboard. It starts collecting data the moment your site goes live, with no setup, no third-party script, and no separate account required. The dashboard tracks:
-
Visits and unique visitors: total sessions and distinct users
-
Pageviews and visit duration: engagement depth across your application
-
Bounce rate: the percentage of single-page sessions that signal friction
-
Traffic source breakdowns: direct, Google, social, and referral attribution
-
Device and country distribution: who is using your app and from where
-
UTM campaign tracking: append
?utm\_campaign=nameto any shared URL and Rocket attributes traffic automatically
For web applications and landing pages, Rocket also surfaces Core Web Vitals, the three Google ranking signals that measure real-world performance:
| Core Web Vital | What It Measures | Target |
|---|---|---|
| LCP (Largest Contentful Paint) | How fast main content loads | Under 2.5 seconds |
| INP (Interaction to Next Paint) | How fast the app responds to clicks | Under 200 milliseconds |
| CLS (Cumulative Layout Shift) | How stable the layout is during load | Under 0.1 |
When Rocket identifies a performance issue, such as an image that slows LCP or unused code that delays INP, it surfaces the specific fix and applies it automatically with one click. The monitoring signal feeds directly back into the development decision, inside the same workspace where the application was built.
For teams that need deeper product analytics, Rocket connects directly to Google Analytics 4 and Mixpanel through its 25+ native integrations. Mixpanel enables funnel analysis, retention tracking, and user segmentation. Google Analytics provides traffic attribution, audience demographics, and conversion goal tracking. Both connect through the Connectors panel with no manual API setup required.
Understanding what inconsistent AI outputs signal for product decisions is exactly the kind of insight that a unified analytics workflow surfaces before it becomes a production incident.
One Workflow from Build to Production Visibility
Most teams building AI powered applications face a fragmented workflow. They research in one tool, build in another, deploy through a third, and set up monitoring using yet another platform. Every handoff between tools creates context loss, delays, and gaps where problems hide undetected.
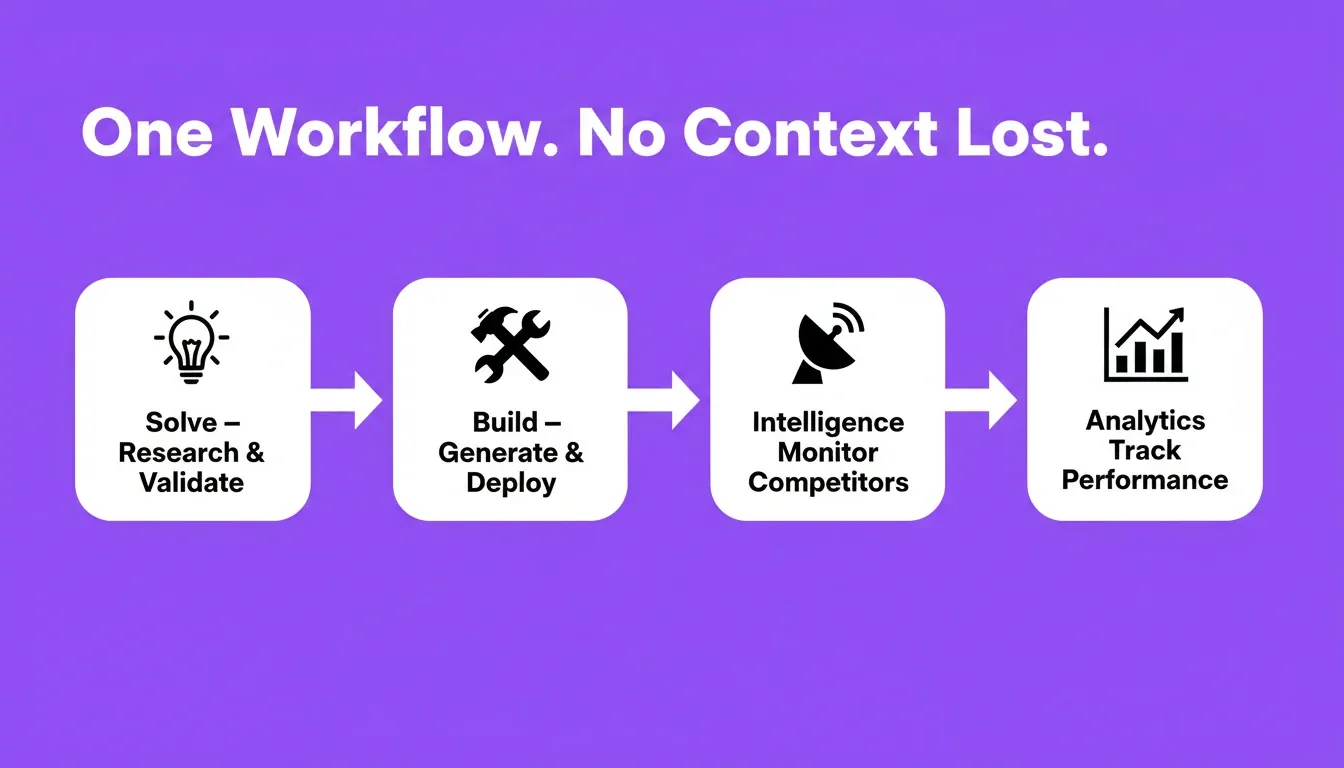
Rocket is the world's first Vibe Solutioning platform, designed so that research, build, deploy, and monitor happen in one shared-context workspace. Here is what that means in practice:
-
Solve validates the direction before a line of code is written. Type any business question, from market sizing to feature prioritization, and get a structured, evidence-backed report. The research carries forward directly into the build.
-
Build generates production-grade applications from that validated context. Web apps in Next.js, mobile apps in Flutter, landing pages, and internal tools all start from the accumulated intelligence of the project, not a blank prompt.
-
Intelligence monitors what matters beyond your own app. Rocket's Intelligence pillar continuously monitors competitor websites, social activity, product updates, and review platforms. It surfaces signals that inform your next build decision.
-
Built-in analytics provide production visibility without extra setup. After launch, Rocket tracks visitors, traffic sources, performance metrics, and Core Web Vitals automatically. Basic observability ships as a default with every deployment.
-
The monitoring signal feeds directly back into development. When you identify a performance issue or detect drift in production, you iterate on the fix inside the same workspace where you built the original application. No re-explaining context to a different tool or team.
Where other AI platforms focus only on building or only on monitoring, Rocket covers both ends of the AI lifecycle. The advantage compounds over time. Every monitoring insight feeds back into better building decisions, and built-in integrations mean your observability stack grows with your application rather than requiring separate configuration for each new service.
Security and Compliance in AI Monitoring Workflows
AI systems handle sensitive data at scale, including customer records, financial documents, health information, and proprietary business logic. Monitoring these systems introduces its own security considerations that teams cannot ignore.
-
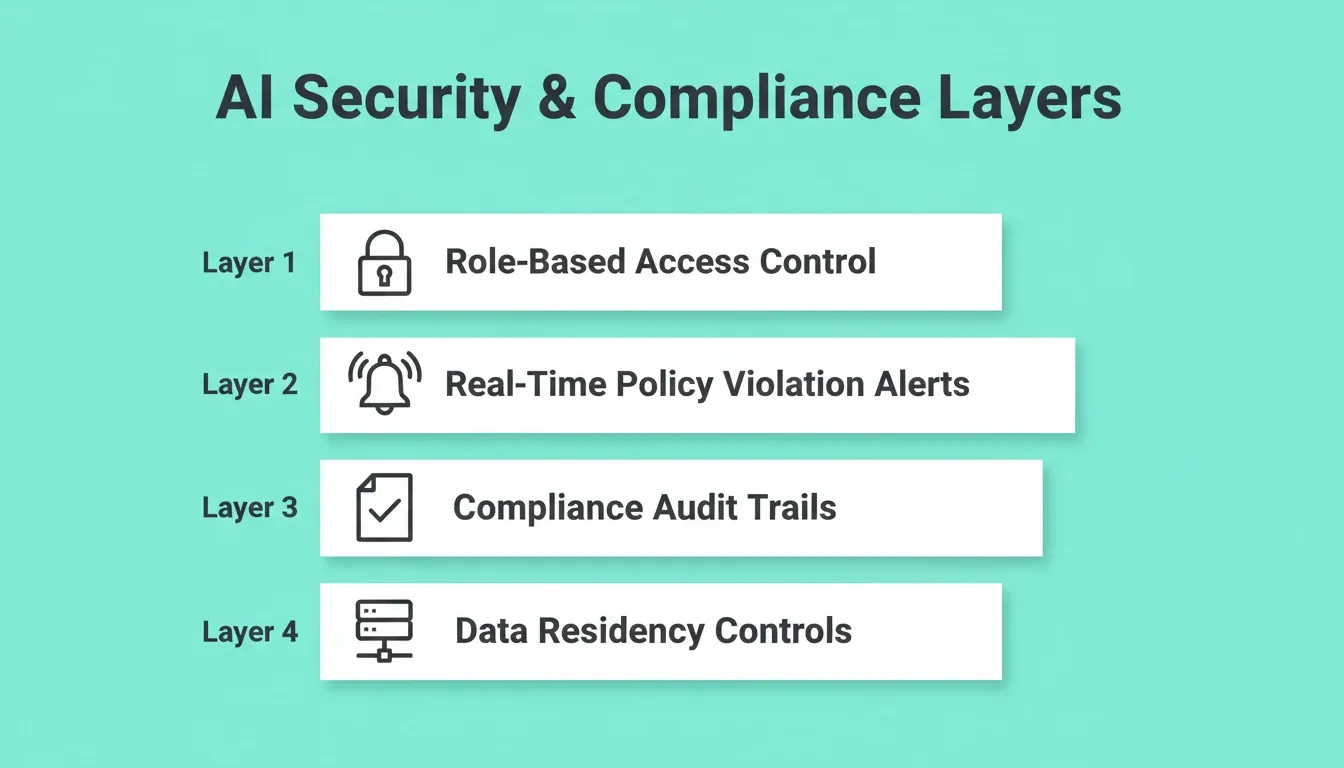
Access control for monitoring data. Not everyone on the team needs to see raw model inputs and outputs. Teams accessing AI monitoring dashboards should have role-based access that limits exposure of sensitive data to only those with appropriate permissions. This is especially critical for enterprise teams where employees across departments interact with the same AI systems.
-
Policy violation detection in real time. AI monitoring should flag when models generate outputs that violate organizational policies, whether that means sharing sensitive information, producing biased responses, or acting outside defined safety boundaries. Automated alerts for policy violations give teams early access to problems before they escalate into incidents.
-
Compliance audit trails for regulators. For organizations in regulated industries, every AI decision needs to be traceable. Monitoring systems should provide logs that show what data went in, what the model produced, and what actions were taken. This is required for HIPAA, GDPR, and industry-specific rules that regulators enforce with increasing scrutiny.
-
Data processing and storage controls. Where monitoring data lives matters for compliance. Teams need to configure whether logs, traces, and evaluation data are stored on-premise or in specific cloud environments to meet data residency requirements. The monitoring tool itself must not become a vector for data exposure.
Security in AI monitoring is not a separate project. It needs to be embedded into the same workflow where teams build and deploy. That way, compliance happens as a natural part of production operations, not as a bolted-on afterthought. Teams building trust with secure AI platforms understand that governance and monitoring must run in parallel from day one.
The Unified Approach Is Where AI Reliability Starts
The teams that ship AI reliably are not the ones with the most monitoring tools. They are the ones where building and monitoring happen in the same workflow. Fragmented tool chains create context loss at every handoff. A unified approach eliminates that compression entirely.
As AI systems grow more capable and more deeply embedded in business operations, the demand to monitor AI applications will only intensify. Regulatory scrutiny is increasing, customer expectations are rising, and the cost of silent failures is compounding. The organizations that treat observability as a build-time default, not a post-launch project, will catch problems faster, reduce cost, and maintain the trust their customers expect.
You described the problem. Rocket researched the market, built the product, deployed it, and kept watching after launch. That is what one workflow looks like. Start on Rocket.new and move from research to production visibility without switching tools.
Table of contents
- -Why Does AI Observability Matter in Production?
- -What Should Your AI Monitoring Stack Cover?
- -How Traditional ML Tracking Falls Short for LLM Applications
- -Choosing the Right Tool for AI Observability
- -What Built-In Analytics Looks Like in a Unified AI Workflow
- -One Workflow from Build to Production Visibility
- -Security and Compliance in AI Monitoring Workflows
- -The Unified Approach Is Where AI Reliability Starts