
A search analytics dashboard logs every query, flags zero-result searches, and tracks search-to-conversion rates. Rocket.new is the fastest way to create one with Supabase, Next.js, and Resend, all from a single prompt.
Most product teams spend thousands on external SEO tools while ignoring the richest behavioral data they already own: what their users type into the search bar.
Building a search analytics dashboard turns that raw query data into a direct roadmap for product decisions, content gaps, and revenue growth.
Key Stats: Build Search Analytics Dashboard for the Business Case
-
Site search users convert at 4.63% vs. 2.77% for non-searchers, making them your highest-value traffic segment
-
Conversion rates jump from 2% to 12% when visitors use search on e-commerce platforms, a 6x lift
-
Only 7% of companies report learning from site search data and applying those insights elsewhere
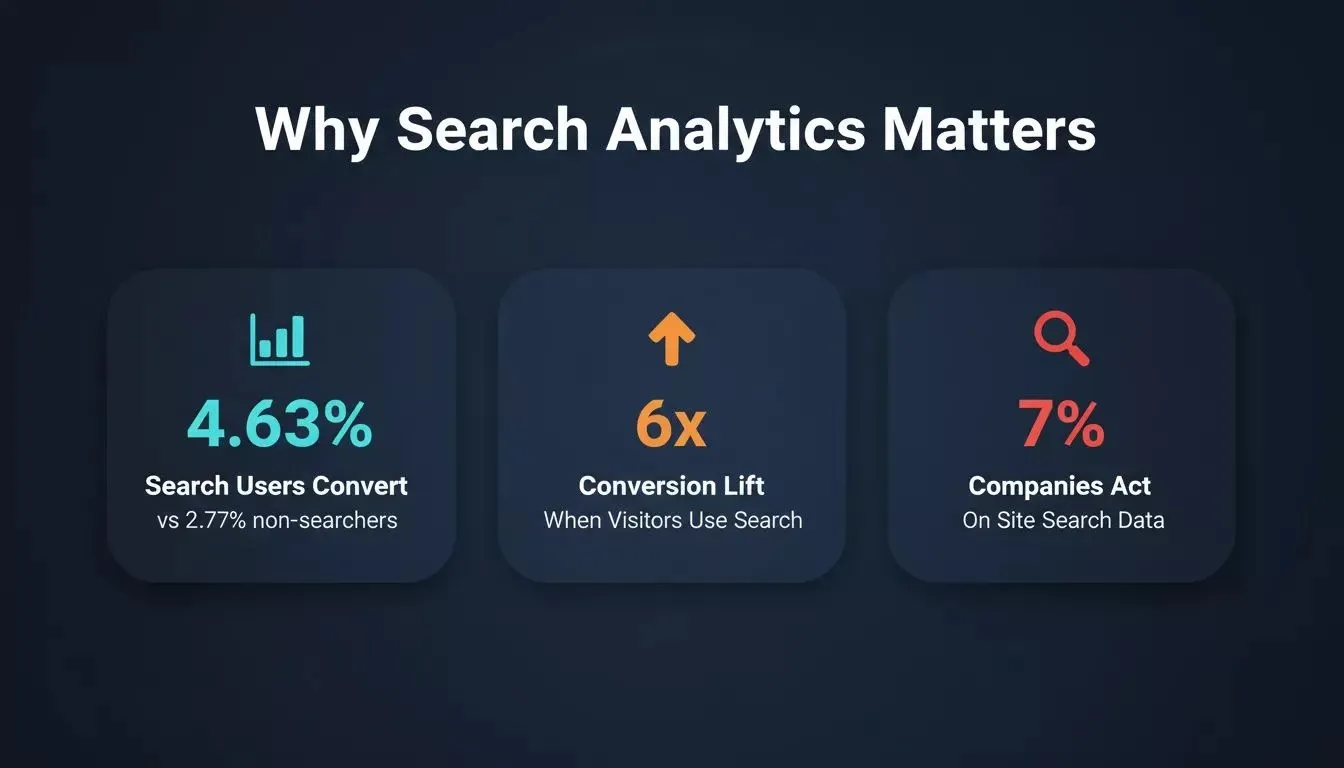
The numbers make the case: site search is your highest-converting channel, yet almost no product teams treat it that way.
Why Does Your Product Need a Search Query Log?
Google Analytics and Google Search Console track how users arrive at your website. But once visitors land on your site, their internal search queries tell a completely different story. A web analytics dashboard for external traffic shows you keyword positions, top landing pages, and website traffic trends.
An internal search analytics dashboard shows you what people expected to find and could not. The gap between search analytics potential and actual usage represents one of the largest missed opportunities in digital marketing and product development today. Your analytics dashboard should pull data from your own search bar, not just Google.
What Are the Three Actionable Search Insights?
Most web analytics tools, like Google Analytics focus on page views, sessions, bounce rate, and advertising campaigns. They pull data from many different data sources including Google Ads, social media campaigns, and email marketing channels. But for product teams, the three most actionable metrics live inside your own search bar.
1. Top queries by frequency. The most common types of searches tell you what users expect your product to have. When the same terms appear hundreds of times per week, that is direct demand data no marketing strategies or advertising spend can replicate.
2. Zero-result queries. Zero-result rate is defined as the percentage of total searches that return no matching results. Every search that returns nothing is a failed experience, and each one represents a feature gap, a missing product, or a content hole.
3. Abandoned searches. When users search, see results, but leave without clicking, something is wrong with relevance. This data set tells you whether your search functionality needs better ranking, filtering, or categorization.
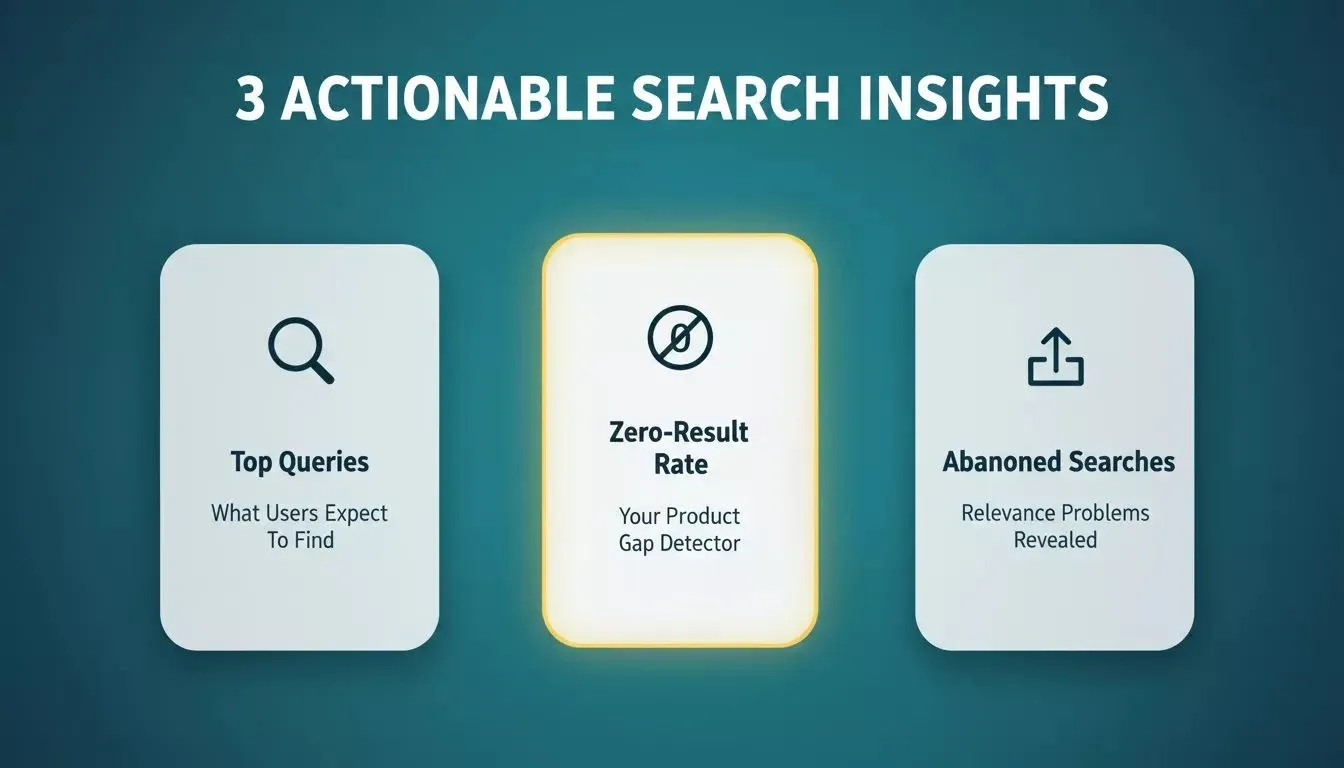
Three pillars of actionable search data, each one surfaces a different category of product gap.
A proper analytics dashboard connects all three metrics into one dashboard view where stakeholders can monitor, analyze, and determine what to build next. Building this kind of internal tool is exactly the use case Rocket.new's Build pillar is designed for. See the internal tool recipe in the docs for how these projects are typically structured.
The Three Core Search Metrics
| Metric | What It Reveals | Why It Matters |
|---|---|---|
| Top queries by frequency | What users expect your product to offer | Direct demand signal; no ad spend required |
| Zero-result rate | Feature gaps, missing products, content holes | Each zero result is an unmet customer need |
| Abandoned searches | Relevance and ranking problems | Users found results, but none were good enough |
How Do Zero-Result Queries Reveal Product Gaps?
Zero-result searches are the clearest signal your product sends about what is missing. When a user types a query and gets nothing back, they have told you exactly what they expected you to offer. This single metric makes sense as the foundation of any search analytics dashboard focused on product growth.
-
Each zero-result query maps directly to a potential new feature, product category, or content page
-
Grouping zero-result terms by theme reveals entire categories your customers want but cannot find
-
Tracking zero-result rate over time shows whether your product catalog is keeping pace with demand
The data sources for this are straightforward. Log every search event to a Supabase table with the query string, timestamp, user ID, and result count. When the result count equals zero, flag it automatically. Then connect that Supabase table to a reporting dashboard that groups, counts, and ranks zero-result terms weekly.
As Peep Laja noted in CXL Institute's site search analysis:
"Search is a hidden gem that a lot of ecommerce companies ignore. If you look at successful companies, you'll see the investment and commitment they've made on their search technology front."
What to Do When You Spot a Zero-Result Spike
-
Confirm the volume threshold. If a zero-result term appears more than 20 times in a week, treat it as a confirmed demand signal, not noise.
-
Check for spelling variants. Group "sneakers," "sneekers," and "trainers" together before deciding whether the gap is a product or search normalization problem.
-
Assign ownership. Route product gaps to the product backlog; route search normalization issues to the engineering queue.
-
Set a resolution SLA. High-volume zero-result terms should have a product or content response within two sprint cycles.
-
Measure the fix. After adding the product or content, verify the zero-result rate for that query drops to zero within 30 days.
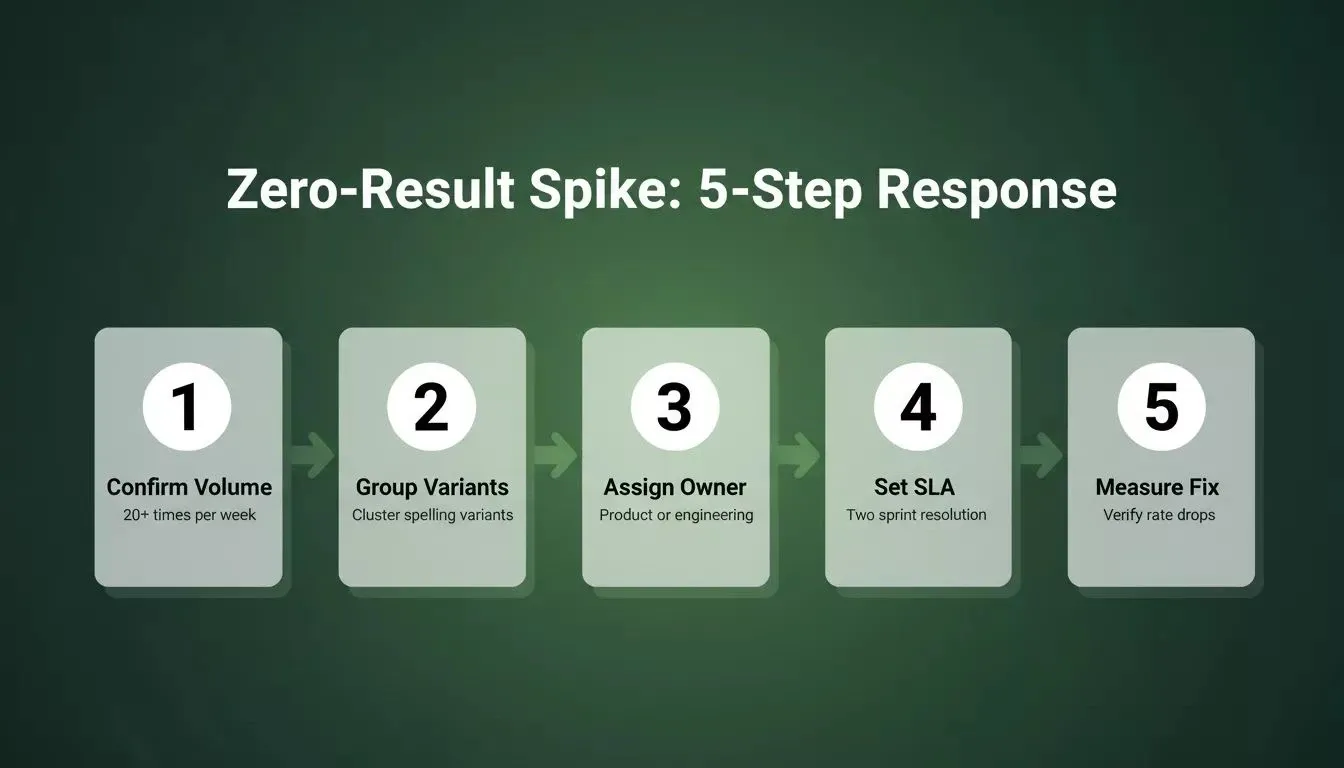
A repeatable five-step process turns every zero-result spike into a closed product gap.
Privacy and PII Considerations When Logging Queries
Because you are logging user session IDs alongside query strings, GDPR and CCPA compliance applies. Best practice is to pseudonymize user IDs before storage, set a data retention policy (90 days is a common default), and document your lawful basis for processing. Rocket.new's generated apps ship with configurable row-level security on Supabase tables by default. The compliance and privacy documentation covers the privacy defaults built into every generated app.
Solve First, Then Build
Rocket.new is a vibe solutioning platform with three pillars: Solve (AI-powered market and competitive research reports), Build (full-stack app generation), and Intelligence (continuous competitor monitoring). Before you build a search analytics dashboard, consider running a Solve report first.
A Solve report on "search analytics for [your product category]" will surface which competitors already expose search data to their product teams, what the standard zero-result benchmarks are for your vertical, and whether there is a market gap for a standalone search analytics tool you could productize.
See the Solve overview for how to run this research step before building. Rocket.new routes each query automatically between Light Solve (fast, conversational) and Full Solve (deeper, board-ready reports) based on the complexity of your question.
From Query Log to Dashboard in One Prompt
Building a search analytics dashboard traditionally requires a backend developer for the logging API, a frontend developer for the dashboard UI, and a data engineer for the reporting pipeline. That is three roles, weeks of work, and high cost before you see your first chart. Rocket.new collapses all of that into a single prompt.
-
A Next.js admin panel with query frequency charts, filterable tables, and real-time widgets showing today's top searches at a glance
-
Supabase integration for logging every search event with automatic schema creation, row-level security via migration scripts, and indexed queries for fast reporting
-
Zero-result detection logic that flags, groups, and ranks failed queries, then suggests product additions based on search volume
-
Weekly digest emails via Resend, you can prompt Rocket.new to build a scheduled email that sends your team a Monday digest of top queries, new zero-result terms, and conversion rate changes
-
Google Analytics integration alongside your internal metrics, letting you correlate external keyword positions and SEO performance with what users actually search for
The generated code is production-ready Next.js and Flutter that you own, download, or sync directly to GitHub, with no vendor lock-in. Platforms like Google Analytics give you external website traffic data but cannot access your internal product search logs at all. If you are also building the search bar itself, the how to create a search bar guide covers the frontend component that feeds this analytics pipeline.
How Rocket.new Builds Your Search Analytics Dashboard
The pipeline below shows how a single search event travels from user input to an actionable weekly report:
-
User fires a search event in your product
-
Event is logged to Supabase (query string, timestamp, user ID, result count)
-
Zero results trigger the gap-flagging branch; non-zero results enter conversion tracking
-
Both outputs feed a weekly email digest sent via Resend every Monday
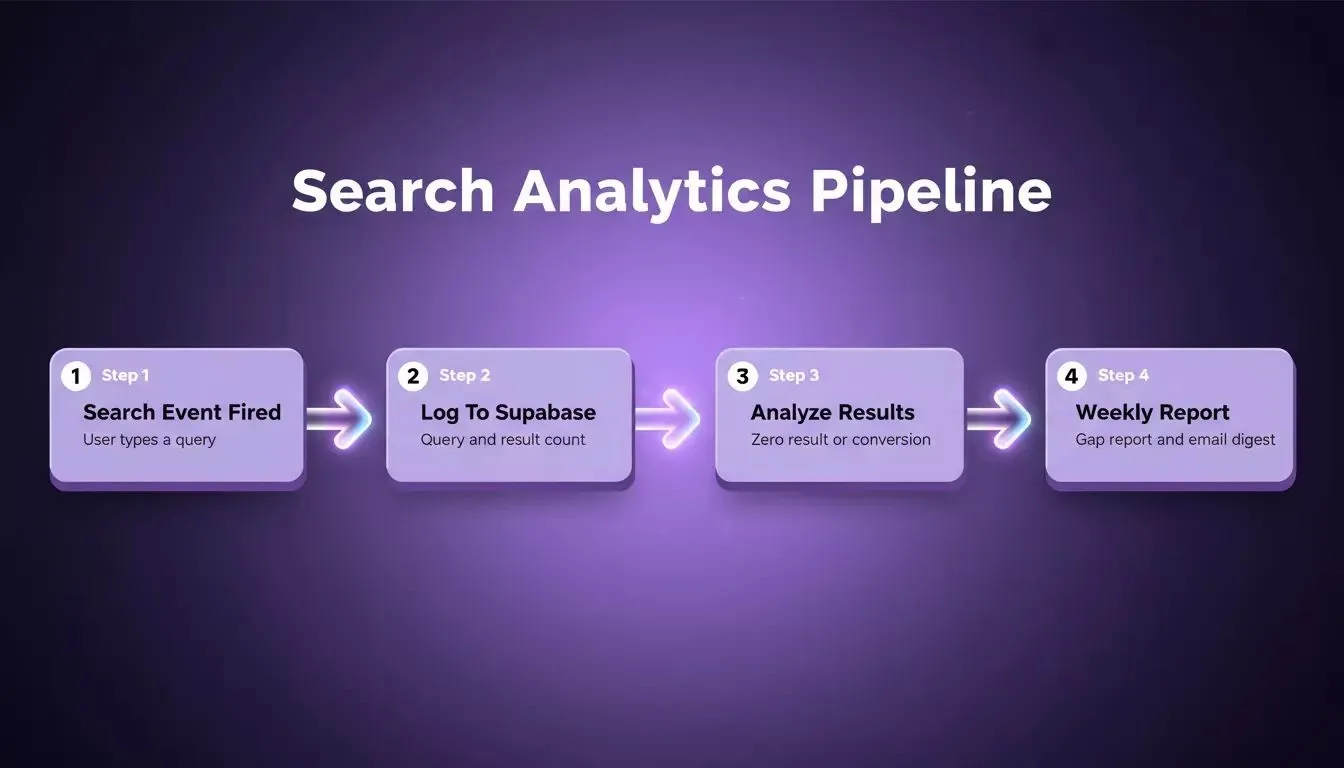
Every search event flows from logging through analysis to a weekly digest that surfaces gaps and conversion data in one place.
How Does Rocket.new Compare to Other Build Options?
| Approach | Build Time | Skill Required | Data Ownership | Cost To Start |
|---|---|---|---|---|
| Rocket.new (Build) | Hours to 1 day | None | Full | Subscription credit |
| Retool | 1 to 3 days | SQL + config | Partial | Free tier, then per-user |
| Metabase | 2 to 5 days | SQL + hosting | Full (self-hosted) | Free OSS or cloud fee |
| Custom code | 2 to 6 weeks | Full-stack engineering | Full | Engineering salary |
| Algolia Analytics | Hours (own search only) | API integration | Partial | Usage-based |
Rocket.new is the only option that requires no technical skill and delivers full data ownership in hours rather than weeks.
The comparison above focuses on the Build pillar. For teams that want to go further, Rocket.new's data visualization dashboard guide covers how to extend any generated dashboard with richer chart types. For teams building SaaS products specifically, the SaaS recipe in the docs shows how to structure the project from the start.
Which Metrics Should a Search Dashboard Track Weekly?
Once your analytics dashboard is live, you need to monitor the right key performance indicators on a regular cadence. Weekly reporting makes sense for most products because it smooths out daily noise while catching trends before they become problems.
| Metric | What It Tells You | Action Threshold |
|---|---|---|
| Top 10 queries by volume | What users want most right now | New term in top 10 for 2+ weeks |
| Zero-result rate | How often search fails entirely | Rate above 5% needs attention |
| Search-to-conversion rate | Whether search drives revenue or frustration | Drop of 10%+ week over week |
| Average position of clicked results | Whether relevant items rank high enough | Average position above 5 |
| Search exit rate | Users who leave after searching | Exit rate above 30% |
When search supports sales, e-commerce dashboards often monitor average order value and cart abandonment rate. When search is used for help content discovery, customer service dashboards may track ticket volume and satisfaction scores.
Many different data sources feed into this reporting: Google Analytics for website traffic, Google Ads for advertising campaigns, Search Console for SEO keyword data, and your Supabase logs for internal search. The best analytics tools combine these data sources into one dashboard with customizable widgets, graphs, and charts. If your team is also tracking product progress alongside search metrics, the project tracking web app guide shows how to connect both views.
Starter Prompt: Build Your Search Analytics Dashboard on Rocket.new
Copy and paste this prompt directly into Rocket.new's Build interface to generate your dashboard:
1Build a Next.js search analytics admin dashboard with Supabase backend.
2Requirements:
3- Log every search event: query string, timestamp, anonymized user session ID, result count, clicked result (boolean)
4- Flag and store zero-result queries in a separate indexed table
5- Dashboard views: (1) Top queries by volume, bar chart, filterable by date range; (2) Zero-result queries, ranked table with weekly trend; (3) Search-to-conversion rate, line chart over time; (4) Search exit rate, percentage widget
6- Weekly email digest via Resend: sends every Monday at 8am UTC
7- Row-level security on all Supabase tables
8- Google Analytics 4 event passthrough: fire a custom GA4 event for each search
9Tech stack: Next.js 14 (App Router), Supabase (Postgres + Auth + RLS), Resend, Recharts, Tailwind CSS.
See the prompt starters library for more templates across product types, including founders, product managers, and developers.
Your Next Feature Is Already Being Searched For
Every search query your users type is a feature request they never filed. The products that grow fastest are the ones paying attention to this signal, visualizing data from their own search bar, and shipping what customers already told them they want.
The gap between knowing this and doing something about it comes down to tooling. When you can go from idea to working analytics dashboard in a single afternoon, there is no reason to leave that data sitting in server logs where nobody will ever read it.
Ready to see what your users are searching for? Start building on Rocket.new and get a working Next.js admin panel with Supabase logging in hours, not months.
Table of contents
- -Key Stats: Build Search Analytics Dashboard for the Business Case
- -Why Does Your Product Need a Search Query Log?
- -What Are the Three Actionable Search Insights?
- -The Three Core Search Metrics
- -How Do Zero-Result Queries Reveal Product Gaps?
- -What to Do When You Spot a Zero-Result Spike
- -Privacy and PII Considerations When Logging Queries
- -Solve First, Then Build
- -From Query Log to Dashboard in One Prompt
- -How Rocket.new Builds Your Search Analytics Dashboard
- -How Does Rocket.new Compare to Other Build Options?
- -Which Metrics Should a Search Dashboard Track Weekly?
- -Starter Prompt: Build Your Search Analytics Dashboard on Rocket.new
- -Your Next Feature Is Already Being Searched For