
An AI dashboard builder converts plain-text prompts into live, data-connected web apps in minutes, no coding required. Rocket stands out with production-ready Next.js output, 25+ data connectors, and one-click deployment, making it the fastest path from idea to a shipped, fully functional dashboard.
What is an AI Dashboard Builder?
An AI dashboard builder reads a plain-text description and generates a complete, deployable web application. It handles UI layout, backend logic, chart components, data bindings, and navigation, all from a single conversational prompt.
Unlike traditional business intelligence tools, it requires no SQL knowledge, no drag-and-drop configuration, and no developer support. You describe what you need. The platform builds it.
According to the 2024 Stack Overflow Developer Survey, 76% of developers are now using or planning to use AI tools in their development process. Dashboard creation is one of the fastest-growing applications of that shift.
What a Modern AI Dashboard Builder Actually Does?
The best platforms in this category do far more than render charts. Here is what separates a real builder from a prototyping tool:
-
Converts natural language into production code. You type what you want. The AI plans the architecture and writes the code. No configuration panels required.
-
Connects to your data sources automatically. REST APIs, Supabase databases, Airtable, Mixpanel, Stripe, and more can all be wired in from the same prompt session.
-
Generates deployable output, not demos. The result is a working app you can share via URL or connect to a custom domain immediately.
-
Supports iteration through conversation. After the first build, you refine through follow-up instructions. "Add a date range filter." "Switch the revenue chart to a stacked bar." Each instruction updates the live app in context.
-
Maintains version history with rollback. Production-grade platforms keep every version so you can revert with one click.
How the Prompt-to-Dashboard Flow Works
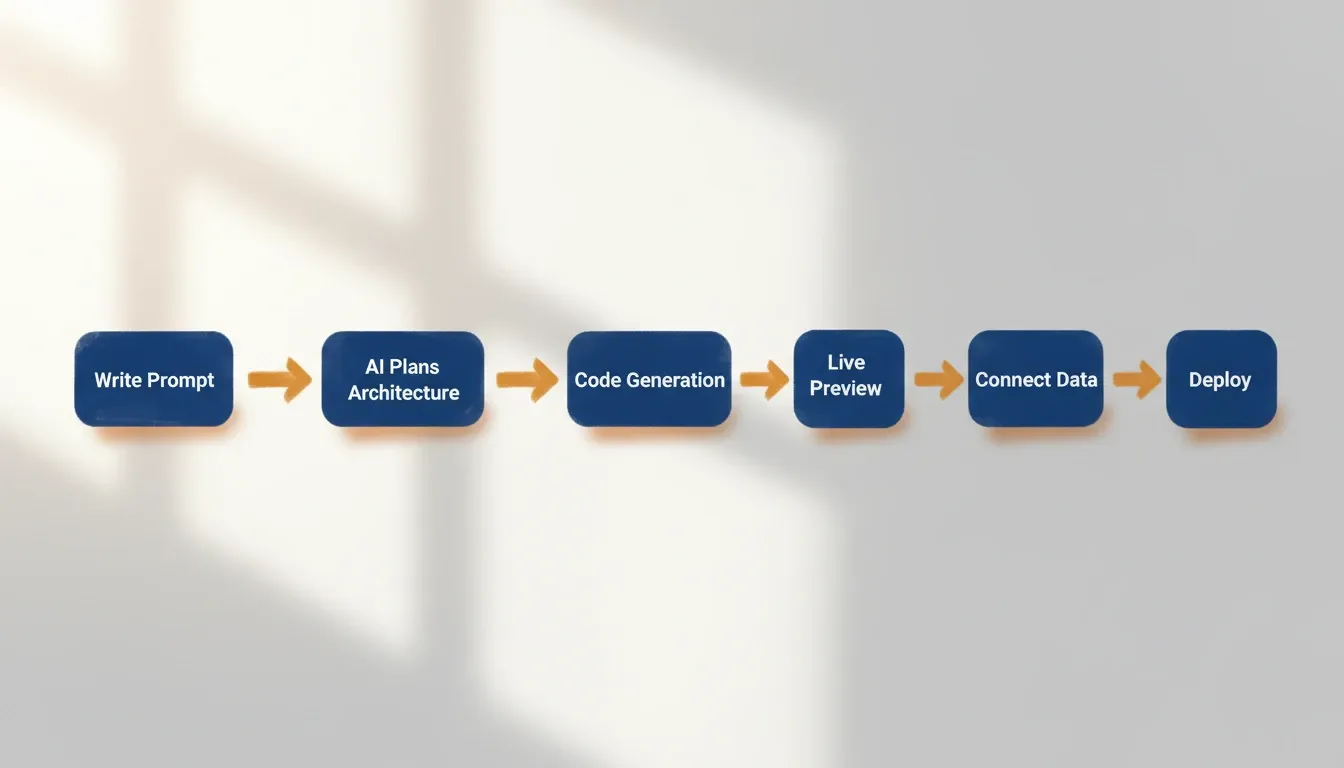
The process is not strictly linear. Most teams run two or three iteration cycles before going live. Every step happens inside the same session. There is no handoff to a developer, no separate deployment pipeline, and no context lost between the requirement and the result.
Why Traditional Dashboard Tools Are Holding Teams Back
Most organizations follow the same painful path: spreadsheets, then a BI tool, then a backlog request for a developer to build a custom view. The core problem is not the features. It is the friction between needing a dashboard and having one.
The Hidden Costs of Legacy Dashboard Development
-
Development time measured in weeks. Writing queries, building front-ends, and connecting APIs requires real engineering effort. A typical internal dashboard takes two to four weeks from deployment request.
-
Maintenance that compounds over time. Every schema change means manually updating queries. Every new team member needs onboarding on an unfamiliar codebase.
-
Non-technical users locked out of the process. When a developer must update a chart filter, the dashboard stops being a team resource and becomes a bottleneck.
-
Steep learning curves on existing platforms. Tools like Retool and Power BI are capable, but they require significant platform expertise. Onboarding cost alone can exceed the value for smaller teams.
-
Vendor lock-in through proprietary formats. Many low-code platforms generate components that only run inside their ecosystem. You cannot export, extend, or migrate without rebuilding from scratch.
According to Gartner, 41% of employees outside IT already build or customize technology solutions. The demand for faster, self-serve data tools is not coming from IT. It is coming from every other team in the organization.
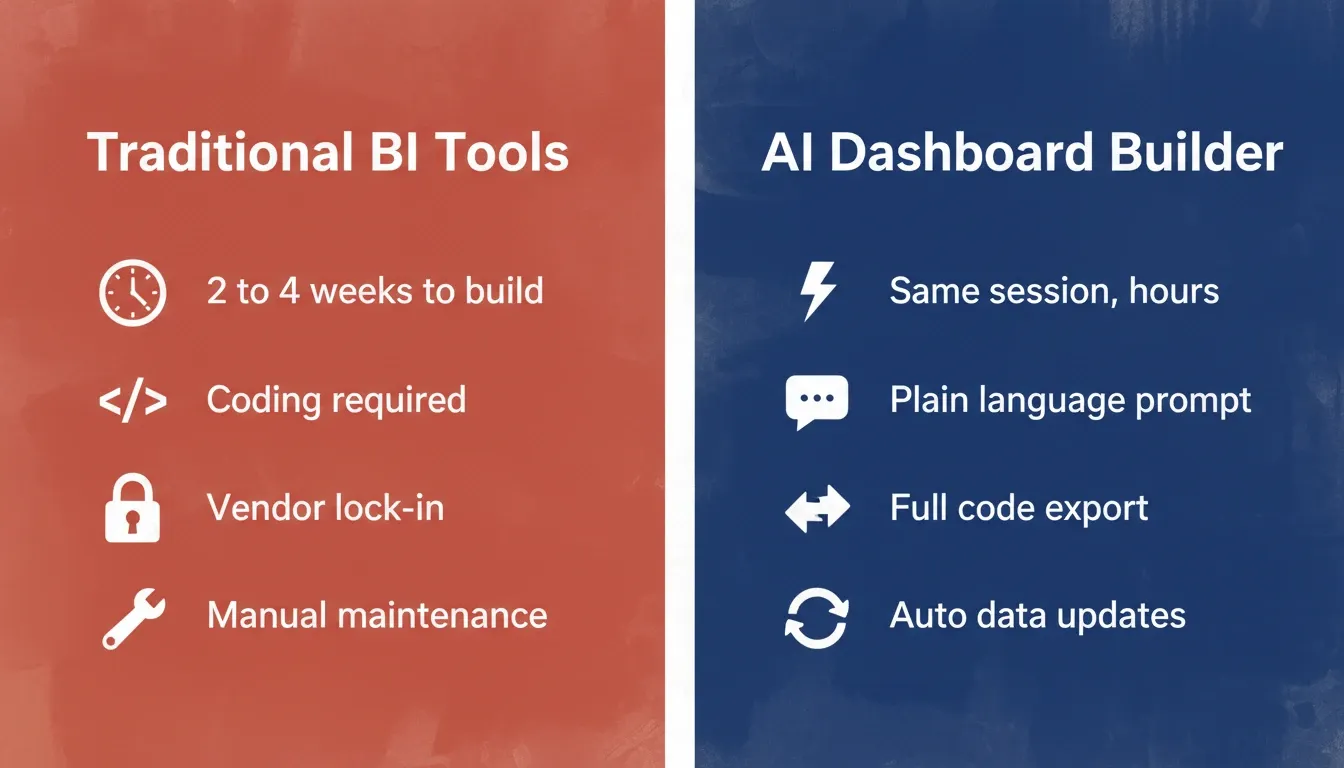
AI Dashboard Builder vs. Traditional Tools
| Dimension | Traditional BI / Low-Code | AI Dashboard Builder |
|---|---|---|
| Time to first working version | 2 to 4 weeks | Same session (hours) |
| Coding required | Yes (SQL, JS, or platform DSL) | No, plain language prompt |
| Data source wiring | Manual configuration | Automatic from prompt context |
| Iteration speed | Days per change request | Minutes via follow-up chat |
| Output format | Proprietary or platform-locked | Real Next.js production code |
| Code ownership | Limited or none | Full export to GitHub |
| Deployment | Separate pipeline | One-click inside builder |
What Features Should You Look For?
Not all AI builders produce equal results. Some generate static mockups. Others output code that needs extensive manual editing before anything goes live.
Core Feature Checklist
| Feature | Why It Matters | What to Check |
|---|---|---|
| Natural language input | Eliminates the prompt-to-spec translation layer | Can you describe screens in plain text without a template? |
| Data source connections | No dashboard works without live data | Supabase, Airtable, REST APIs, Mixpanel, Stripe support |
| Production-grade code output | Mockups do not hold up at scale | Is the output Next.js or Flutter, or a proprietary format? |
| Iteration through chat | Requirements always change post-launch | Can you refine with follow-up prompts in the same session? |
| One-click deployment | Fast shipping matters for team velocity | Does deploy happen inside the same session? |
| Code ownership and export | Avoid platform lock-in | Can you export source code to GitHub? |
| Version history and rollback | Production safety net | Can you revert to any prior state with one action? |
| WCAG and GDPR compliance | Enterprise and regulatory requirements | Is accessibility and data privacy built in by default? |
The code output question is the most important one. A platform that generates proprietary components locks you in permanently. A platform that generates real Next.js code lets your team extend, maintain, or self-host the dashboard on their own terms.
Three Questions to Ask Before Committing
-
Can you describe a dashboard in plain English and get a working app, not a wireframe?
-
Does the output connect to your actual data sources automatically?
-
Can you export the source code and deploy it independently?
If any answer is no, the platform is a prototyping tool, not a builder.
Real-World Use Cases for AI-Built Dashboards
AI-built dashboards are appearing across every business function. The breadth of what teams are building reflects how universally the gap between needing data visibility and having it was felt.
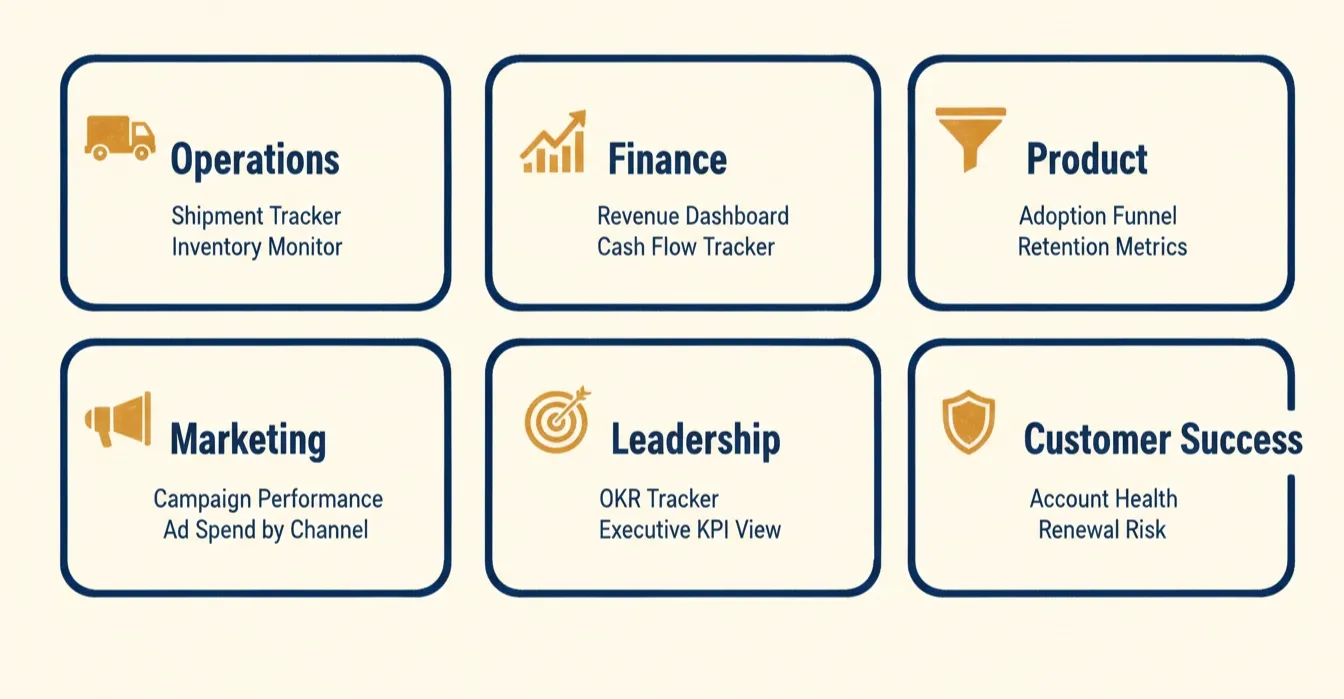
Use Cases by Business Function
-
Operations teams build shipment trackers, inventory monitors, supplier performance views, and order management dashboards. The common thread is replacing a weekly spreadsheet export with a live, filterable view.
-
Finance teams build revenue dashboards, expense breakdowns, cash flow trackers, and portfolio analysis tools. As noted in Rocket's financial dashboard guide: "Once we moved our reporting into a financial dashboard, meetings changed completely. Instead of debating numbers, we focused on decisions."
-
Product teams build feature adoption funnels, user activation and retention metrics, A/B test result trackers, and NPS monitors. These dashboards replace the weekly analytics export that product managers previously assembled manually from three different tools.
-
Marketing teams build campaign performance views, conversion tracking dashboards, ad spend by channel, and SEO ranking monitors. Pulling Mixpanel, Google Analytics, and Stripe data into a single view, without an engineer, is the primary driver of adoption.
-
Leadership teams build executive KPI views, company health summaries, OKR tracking dashboards, and board-ready reporting views.
-
Customer success teams build account health dashboards, renewal risk trackers, and support ticket monitors that surface at-risk accounts before they churn.
Three Concrete Dashboard Examples
Example 1: SaaS Revenue Dashboard. A two-person startup needs a live view of MRR, churn rate, and new trial activations from Stripe and Supabase. The founder describes the screens in a single prompt, connects credentials, and has a live dashboard deployed to a custom domain within the same afternoon.
Example 2: E-commerce Operations Monitor. A DTC brand's operations lead needs real-time order volume, fulfillment status, and inventory levels across three warehouses. The AI builder reads the Airtable schema, generates a filterable table with KPI cards, and deploys it to a shareable URL for the logistics team.
Example 3: Marketing Attribution Dashboard. A growth team needs paid acquisition cost, organic traffic trends, and conversion rates by channel in one place. The AI builder connects Google Analytics and Mixpanel, generates a multi-tab dashboard with line charts and bar charts, and adds a date range filter, all from a single prompt.
For teams working with internal tools, connecting a dashboard to Airtable, Notion, and Mixpanel no longer requires a custom data-wiring build from an engineer.
How Rocket Builds Production-Ready Dashboards at Speed
Most AI builders give you a prototype. Rocket gives you a product.
The difference starts before the first line of code gets written. Rocket's Solve pillar validates the dashboard concept, defines the right metrics, confirms the data model, and understands the audience, before generating anything. That context flows directly into the Build step, so the first version reflects real requirements rather than guesses.
What Rocket Generates
Once you describe the dashboard you need, Rocket's Build pillar generates a complete Next.js web application. Not a drag-and-drop component tree. Actual production code with:
-
Real-time data connections to 25+ services, including Supabase, Airtable, Mixpanel, Stripe, Google Analytics, Notion, HubSpot, and Twilio
-
Design quality that looks intentional, with visual hierarchy, consistent theming, responsive layouts, and dark/light mode built in from the first generation
-
Full source code ownership, export to GitHub, deploy anywhere, and let developers extend it without limitations
-
Built-in analytics tracking visitors, conversions, and Core Web Vitals after launch
-
Staging and production environments with version history and one-click rollback
-
WCAG accessibility and GDPR compliance shipped as defaults, not add-ons
How Rocket Compares
| Platform | Output Type | Data Connectors | Code Ownership | Pre-Build Intelligence |
|---|---|---|---|---|
| Rocket | Next.js / Flutter | 25+ native | Full GitHub export | Yes, Solve feeds Build |
| Retool | Proprietary low-code | Many (manual config) | No | No |
| Bolt | React (limited) | Few | Partial | No |
| Lovable | React | Limited | Partial | No |
| Power Apps | Proprietary | Microsoft ecosystem | No | No |
Retool and Power Apps require developer involvement for setup and maintenance. Bolt and Lovable generate from prompts but produce output that does not carry forward the strategic thinking behind the requirement.
Rocket starts from accumulated intelligence. The Solve output becomes the Build input, and nothing is lost in translation. The Rocket internal tools playbook shows exactly how operations teams are replacing engineering backlogs with AI-built dashboards. Teams that previously waited weeks now ship within the same session.
The low-code development market reached \$13.8 billion in 2021 and has grown at over 22% annually, according to Gartner. The teams moving fastest are the ones who stopped waiting for engineering bandwidth and started building directly.
1.5 million people have tried Rocket across 180 countries.
How to Build Your First Dashboard: A Step-by-Step Guide
The process is shorter than most teams expect. Here is what a first build looks like in practice.
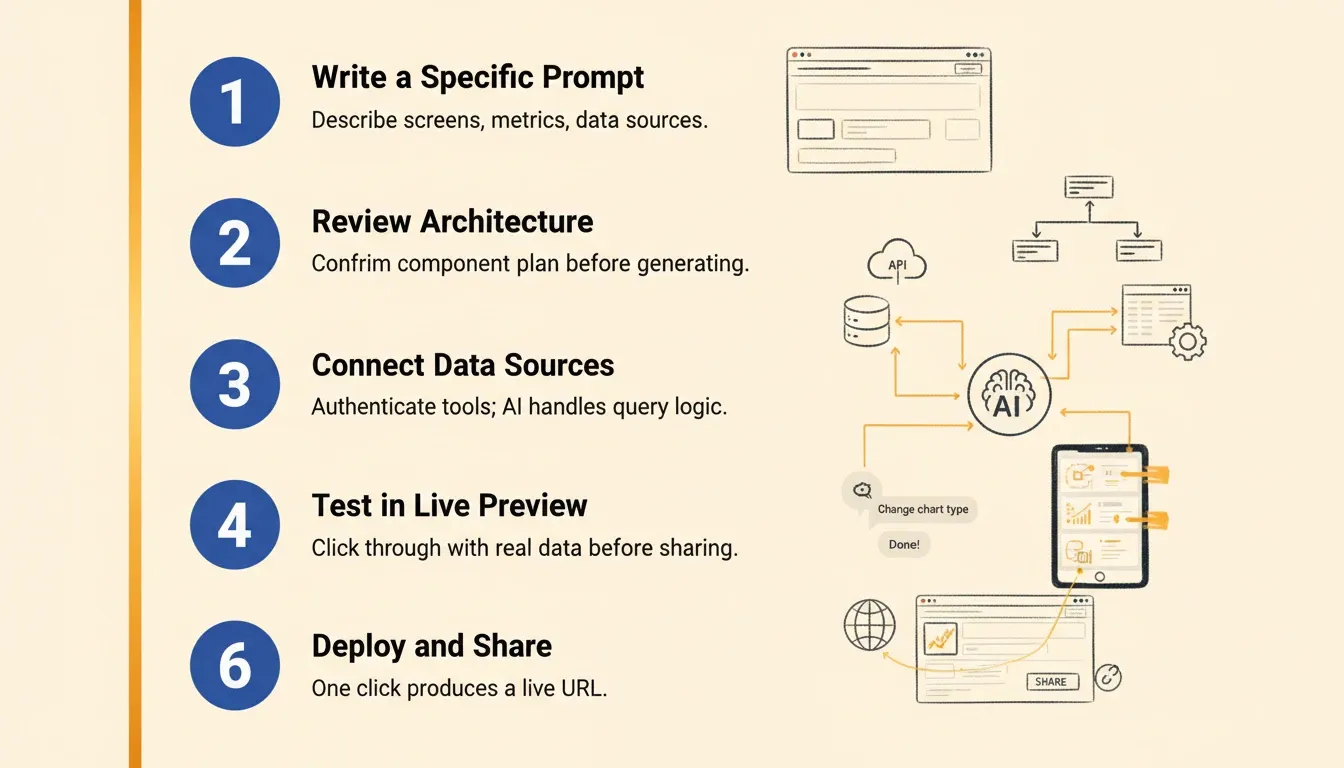
Step 1: Write a Specific Prompt
Describe the dashboard's purpose, the key metrics you need, and the data sources you are working with. Be specific about screen names, chart types, and filter requirements. Three to five sentences is usually enough.
Weak: "Build me a sales dashboard."
Strong: "Build a SaaS revenue dashboard with three screens: an overview showing MRR, churn rate, and new trials as KPI cards; a revenue trends screen with a 12-month line chart; and a customer table showing account name, MRR, plan, and signup date. Connect to Stripe for revenue data and Supabase for customer records. Add a date range filter on the overview screen."
Step 2: Review the Proposed Architecture
Most AI builders surface a component plan before generating. Review it, deselect anything you do not need, and confirm the data source mappings. Leaner first builds iterate faster and are easier to test.
Step 3: Connect Your Data Sources
Paste your API keys or authenticate with your tools directly in the builder. The AI handles query logic, data binding, error handling, and loading states. You do not write a single line of connector code.
Step 4: Test in the Live Preview
Click through the dashboard as a real user would. Check that charts load with real data, filters respond correctly, and navigation works across screen sizes. Catch layout issues before any external URL gets shared.
Step 5: Iterate via Chat
Use follow-up prompts to refine: "Add a filter for plan type," "Change the MRR chart to show month-over-month growth percentage," "Add a red highlight to accounts with churn risk above 80%." Each instruction updates the app in context.
Step 6: Deploy and Share
One action produces a live URL. Share it with two or three team members for feedback before going wider. Connect a custom domain when the dashboard is ready for the full organization.
Common Mistakes to Avoid
Even with the best platform, teams make avoidable errors on their first builds.
Mistake 1: Building everything in one session. Start with one clear problem, build a focused first version, validate it with real users, and expand from there. Trying to build every report in a single session produces dashboards nobody uses.
Mistake 2: Vague prompts. "Build a dashboard" produces a generic output. The more specific your prompt, including screen names, metric definitions, filter requirements, and data source field names, the closer the first generation is to what you actually need.
Mistake 3: Skipping the live preview step. Always test with live data in the preview before sharing a URL externally. Deploying before testing is the most common source of post-launch issues.
Mistake 4: Choosing a platform without code export. If you cannot export the source code, you are renting your dashboard, not owning it. Any platform change or developer extension will require a full rebuild.
Mistake 5: Ignoring compliance requirements. WCAG accessibility and GDPR data handling are not optional for enterprise or regulated industries. Choose a platform that ships these as defaults.
You can explore how teams avoid these pitfalls in the guide to building internal tools with AI without a developer.
The Future of AI Dashboard Builders
The AI dashboard builder category is evolving fast. Three trends are shaping where it goes next.
Autonomous data modeling. The next generation of builders will propose the right data model for the dashboard you are trying to build, suggest which metrics to track, and flag gaps in your current data collection before you start.
Embedded intelligence. Dashboards will move from passive displays to active advisors. Rather than showing you that churn increased, the dashboard will surface the likely cause and suggest a response in the same view.
Zero-handoff deployment. The gap between "I need a dashboard" and "the dashboard is live" will compress to minutes for any team member, regardless of technical background. The engineering queue for internal tools will effectively disappear for the majority of use cases.
For a deeper look at how AI is changing the full product development arc, see how AI is changing product development and the guide to building a data visualization dashboard that turns metrics into growth.
The AI Dashboard Builder Is Now the Fastest Path from Idea to Insight
Building a dashboard used to be the hard part. It required engineering time, platform expertise, and weeks of back-and-forth between the person who needed the data and the person who could build the view. AI dashboard builders have eliminated that gap entirely.
Today, the real work has shifted to something more valuable: deciding what to measure, why it matters, and what action to take when the numbers move. The teams winning in this environment are not the ones with the largest engineering headcount. They are the ones who removed the friction between insight and action.
Rocket generates production-ready dashboards from plain-language descriptions, connects to your live data sources automatically, deploys to a shareable URL in a single session, and gives you full ownership of the code. As AI-native development becomes the default way teams build internal tools, the organizations that start now will have a compounding advantage over those still waiting for engineering bandwidth.
Start building your first dashboard with Rocket for free and go from idea to live app without writing a single line of code.
Table of contents
- -What a Modern AI Dashboard Builder Actually Does?
- -How the Prompt-to-Dashboard Flow Works
- -Why Traditional Dashboard Tools Are Holding Teams Back
- -The Hidden Costs of Legacy Dashboard Development
- -AI Dashboard Builder vs. Traditional Tools
- -What Features Should You Look For?
- -Core Feature Checklist
- -Three Questions to Ask Before Committing
- -Real-World Use Cases for AI-Built Dashboards
- -Use Cases by Business Function
- -Three Concrete Dashboard Examples
- -How Rocket Builds Production-Ready Dashboards at Speed
- -What Rocket Generates
- -How Rocket Compares
- -How to Build Your First Dashboard: A Step-by-Step Guide
- -Step 1: Write a Specific Prompt
- -Step 2: Review the Proposed Architecture
- -Step 3: Connect Your Data Sources
- -Step 4: Test in the Live Preview
- -Step 5: Iterate via Chat
- -Step 6: Deploy and Share
- -Common Mistakes to Avoid
- -The Future of AI Dashboard Builders
- -The AI Dashboard Builder Is Now the Fastest Path from Idea to Insight