Fifteen Chrome extensions organized by developer workflow stage. Debug with React DevTools and Lighthouse, inspect CSS with ColorZilla and CSS Peeper, test APIs with JSON Viewer and ModHeader, and navigate GitHub with Octotree. Pair them with Rocket for a complete build-and-inspect cycle.
The best Chrome extensions for developers cut through nearly 125,000 options on the Chrome Web Store. This guide organizes fifteen tested picks by workflow stage, from inspect and debug to style, test, and ship, so you install what actually saves time, not what fills your toolbar.
Fifteen tested picks organized by workflow stage, from debugging to productivity.
Quick Picks by Need
Not sure where to start? Here are the fastest matches by developer need.
| I need to | Best pick | Cost | Why |
|---|---|---|---|
| Debug React components | React Developer Tools | Free | Official Meta tool, 5M users |
| Audit page performance | Lighthouse | Free (built-in) | Google's own Core Web Vitals tool |
| Identify any site's tech stack | Wappalyzer | Free/Paid | Instant framework detection |
| Pick colors from any page | ColorZilla | Free | 4M users, hex/RGB/HSL output |
| Read JSON API responses | JSON Viewer | Free | Collapsible tree, syntax highlighting |
| Navigate GitHub repos faster | Octotree | Free/Paid | File-tree sidebar for any repo |
| Manage tabs across projects | Session Buddy | Free | 4.7 stars, 1M+ users |
| Modify HTTP request headers | ModHeader | Free/Paid | CORS and auth token testing |
| Inspect CSS on any live page | CSS Peeper | Free | Hover-to-inspect, no DevTools needed |
| Identify fonts on any page | WhatFont | Free | Instant font name, size, line height |
How Did We Pick These Fifteen Tools?
React Developer Tools, Redux DevTools, Wappalyzer, and Lighthouse cover the debugging and inspection layer. CSS Peeper, ColorZilla, WhatFont, and VisBug handle design handoff. JSON Viewer, ModHeader, and Postman Interceptor address API and network testing. Octotree, Session Buddy, Vimium, and Grepper round out productivity and GitHub navigation.
Every extension on this list passed through four filters before it earned a spot. We looked at real-world daily usefulness across web pages, not marketing promises or download counts alone.
-
Performance impact: does the extension slow down page load or memory use when running background scripts?
-
Permissions and privacy: does it request access to data it does not need? How transparent is its manifest file?
-
Maintenance activity: was it updated within the past year? Are open issues actively addressed?
-
Daily usefulness: does it save time on tasks you complete at least a few times a week, not once a quarter?
Extensions that had not been updated in over a year were excluded. An abandoned add-on can introduce bugs, create broken links to deprecated APIs, or leave known vulnerabilities unpatched.
How each extension was evaluated before making the list.
Which Extensions Handle Inspecting and Debugging?
React Developer Tools, Redux DevTools, Wappalyzer, and Lighthouse are the four tools that sit in or alongside Chrome DevTools and give you a direct view into how web pages behave under the hood. Note that Lighthouse is a built-in Chrome DevTools panel, not a separate extension from the Web Store.
React Developer Tools
What it does: Adds a Components and Profiler tab to Chrome DevTools. Walk the component tree, inspect props and state in real time, and profile render performance with flame graphs.
Best for: React and Next.js developers who need to trace re-renders and debug component state. If you are evaluating HTMX vs React for your next project, this tool is essential for understanding React's runtime behavior before making that call.
Cost: Free. Maintained by Meta with 5 million users and a September 2026 update.
Limitation: Web only. Does not work on Flutter or native mobile builds.
Skip it if: You are not using React.
Redux DevTools
What it does: Logs every state change in a Redux store, letting you time-travel through actions and inspect the payload at each step. Rated 4.6 stars across 740 reviews.
Best for: Apps that manage complex state across dozens of components.
Cost: Free.
Limitation: Redux-specific. Not useful if your app uses Zustand, Jotai, or other state managers.
Skip it if: Your project does not use Redux.
Wappalyzer
What it does: Click the puzzle piece icon in your browser toolbar and instantly see the tech stack behind any website you visit. It identifies frameworks, analytics tools, content scripts, and even the CDN behind specific pages. Rated 4.6 stars with 3 million users.
Best for: Competitive research, pre-sales technical discovery, and understanding how other sites are built.
Cost: Free tier available; paid plans unlock deeper data exports.
Limitation: Detection is heuristic-based and can miss obfuscated or custom stacks.
Skip it if: You only work on your own codebases and have no need for competitive stack analysis.
Lighthouse
What it does: Already part of the Google Chrome browser, so there is nothing to install from the Web Store. Open DevTools (F12), click the Lighthouse tab, and run an audit. Get scores for performance, accessibility, SEO, and best practices.
Best for: Every web developer, before every deployment.
Cost: Free (built-in to Chrome).
Limitation: Scores vary between runs due to network conditions. Always run multiple audits and average the results.
Skip it if: You are building Flutter mobile apps. Lighthouse is a web-only tool.
If you run a React or Next.js codebase, React Developer Tools and Lighthouse together cover both the component layer and the performance layer. That pair alone saves hours of manual debugging every week. See the web development toolkit guide for how these fit into a broader tool strategy.
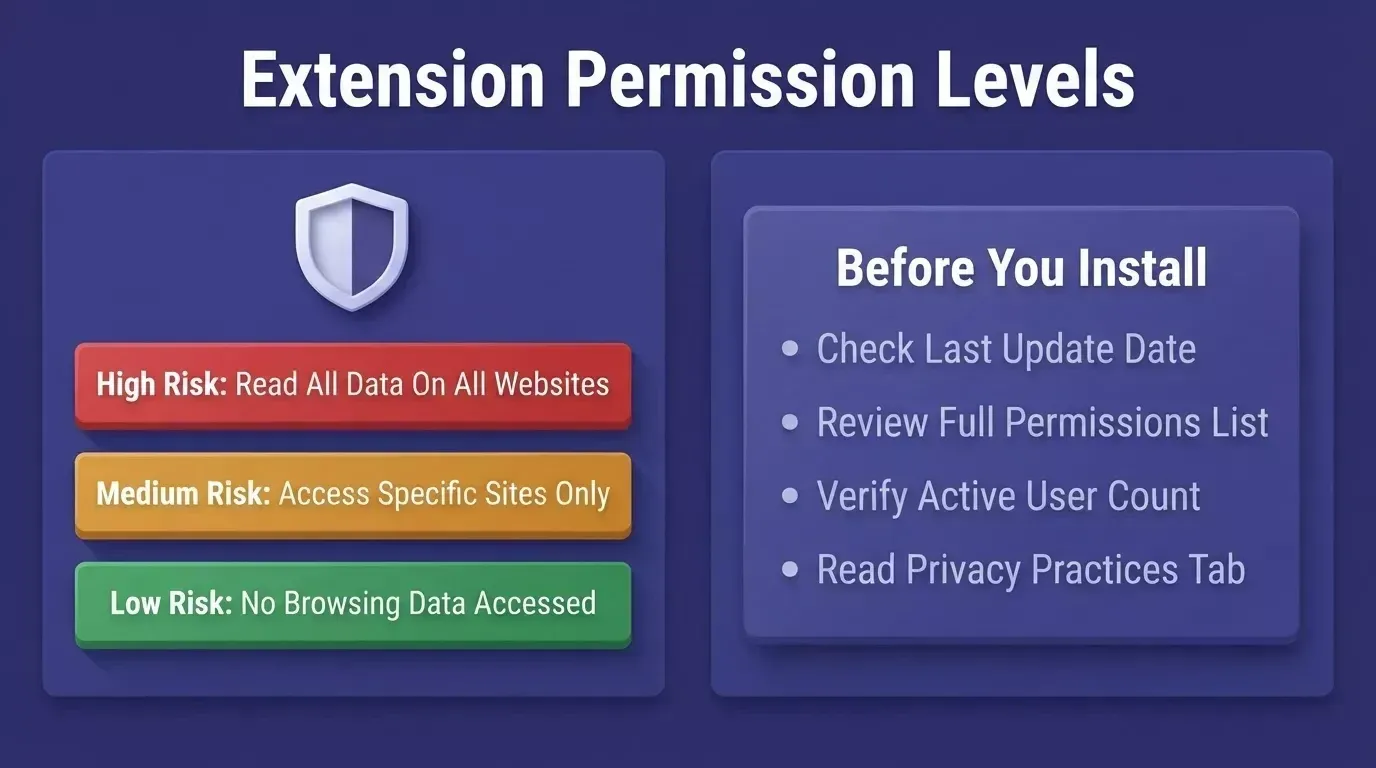
Always check permission levels before installing any extension.
Which Extensions Speed Up CSS and Design Handoff?
CSS Peeper, ColorZilla, WhatFont, and VisBug cut the guesswork when you need to match fonts, color values, and CSS properties on a live web page. They sit in your Chrome toolbar and work on any website you visit.
CSS Peeper
What it does: A CSS viewer that shows styles on hover, including font family, font size, color, and spacing values. Presents CSS properties in a clean panel rather than making you scroll through the DevTools Elements tab.
Best for: Frontend developers matching a design spec to a live page.
Cost: Free.
Limitation: Read-only. You can inspect but not edit styles directly.
Skip it if: You are comfortable in the DevTools Elements panel and do not need a simplified view.
ColorZilla
What it does: The most popular color picker on the Chrome Web Store with 4 million users. Grabs hex, RGB, and HSL values from any pixel on the page, generates CSS gradients, and keeps a history of recently picked colors. Rated 4.6 stars.
Best for: Design-to-code work where you need to translate visual specs into exact color values.
Cost: Free.
Limitation: Picks colors from rendered pixels, not from CSS variables.
Skip it if: Your design system uses a token-based color system and you already have the values in your codebase.
WhatFont
What it does: Hover over any text element on a webpage and see the font name, font size, line height, and color instantly. Saves you from digging through stylesheets every time a designer asks about typography details.
Best for: Typography checks during design handoff.
Cost: Free.
Limitation: Does not always detect fonts loaded via custom CSS @font-face declarations with obfuscated names.
Skip it if: Your team uses a single design system with documented typography.
VisBug
What it does: A free tool from Google that lets you move, resize, and restyle elements directly on any live website. A visual debugging overlay that helps designers and developers collaborate on spacing, color, and layout without writing code first.
Best for: Layout prototyping and quick visual feedback sessions with designers.
Cost: Free.
Limitation: Changes are temporary and disappear on page refresh.
Skip it if: You prefer to make all layout changes directly in code or in a design tool like Figma.
Pairing CSS Peeper with ColorZilla covers most design handoff needs. Add WhatFont for font checks and VisBug for quick layout adjustments, and the complete CSS inspection workflow runs entirely from your Chrome browser window.
Which Extensions Help With API and Network Testing?
JSON Viewer, ModHeader, and Postman Interceptor bring API response reading and header manipulation into a single browser window, removing the need to switch between tools for routine network debugging.
JSON Viewer
What it does: Renders raw JSON file responses in a readable, collapsible tree view inside the browser. Syntax highlighting and searchable content replace a wall of unformatted text.
Best for: API developers who frequently inspect REST responses directly in the browser.
Cost: Free and lightweight.
Limitation: Only works on pages that return application/json.
Skip it if: You already use a dedicated API client like Postman or Insomnia for all your API work.
ModHeader
What it does: Lets you add, modify, or remove HTTP request and response headers with just a few clicks. Helps test CORS policies, simulate different user agents, or debug authentication tokens during development.
Best for: API testing where you need to inject or override headers without touching your code.
Cost: Free tier available; paid plans add profiles and team sharing.
Limitation: Applies to all tabs unless you configure URL filters.
Skip it if: Your backend team provides a dedicated staging environment with test credentials that do not require header manipulation.
Security and privacy concerns are the number one reason developers abandon a tool. That finding is especially relevant for network-related extensions that access your browsing data. Check what data each extension requests before adding it to your setup. See the web application security checklist for a broader framework on evaluating tools before adoption.
Postman Interceptor
What it does: Bridges Chrome and the Postman desktop app, capturing network requests from your browsing session and forwarding them to Postman for detailed testing. Records cookies, headers, and request bodies from specific pages you view.
Best for: API testing teams who already use Postman and want to capture real browser traffic.
Cost: Free (requires Postman desktop app).
Limitation: Requires Postman to be running on your machine.
Skip it if: You do not use Postman, or if you prefer to write API tests from scratch.
Which Extensions Cover Productivity and GitHub?
Octotree, Session Buddy, Vimium, and Grepper manage tabs, navigate code repositories, and surface useful content without you spending hours searching.
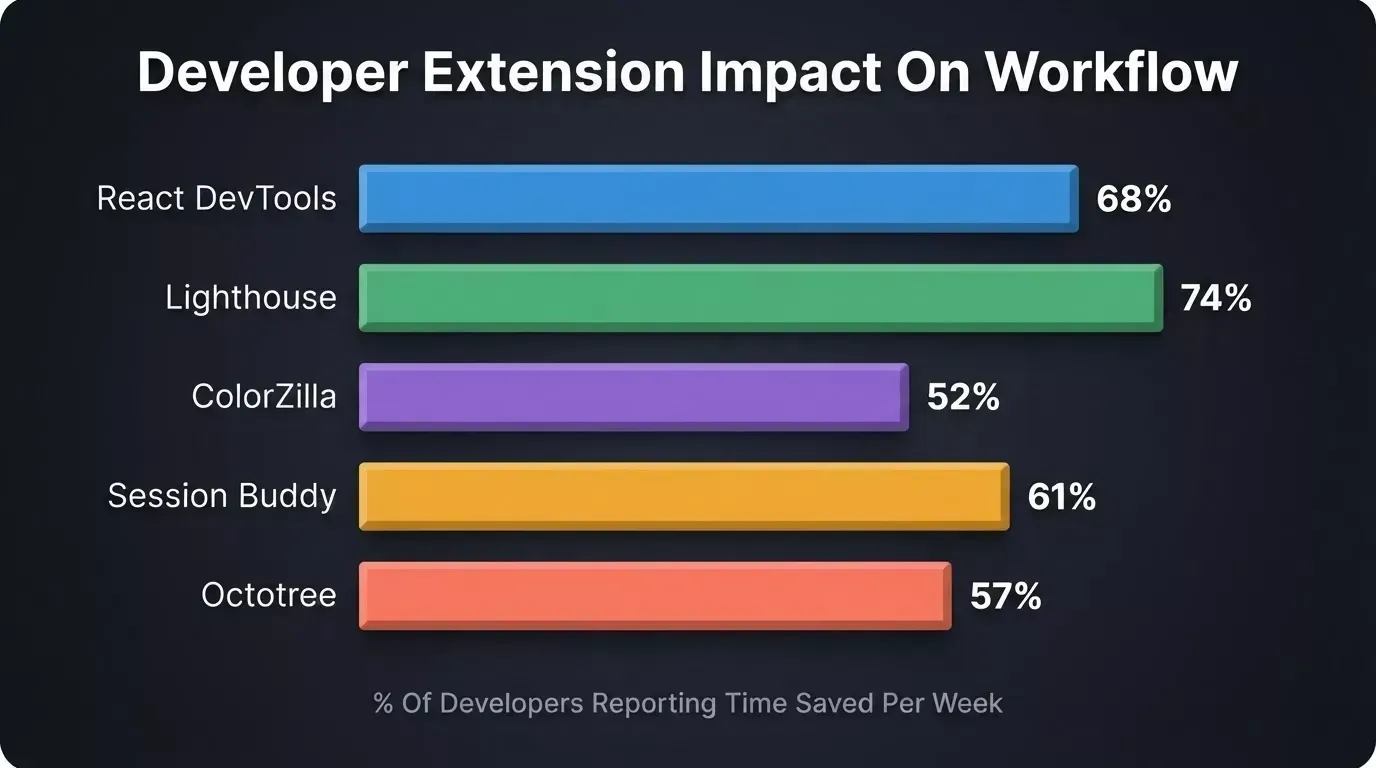
Developer-reported time savings per week across the most-used extensions in this guide.
Octotree
What it does: Adds a file-tree sidebar to GitHub repositories, making it easy to navigate large projects without clicking through folders one at a time.
Best for: Open-source contributors and developers who review large codebases on GitHub. If you are also exploring code collaboration tools for developers, Octotree pairs well with the broader toolset covered there.
Cost: Free tier for public repos; paid version supports private repos with additional features.
Limitation: Free tier does not support private repositories.
Skip it if: You primarily work in a local IDE and rarely browse GitHub in the browser.
Session Buddy
What it does: Saves and restores browser tab sessions in one click. Rated 4.7 stars with over a million users. When you work across multiple projects and need to switch contexts, Session Buddy keeps every window organized and recoverable after a crash.
Best for: Multi-project workflows where you regularly switch between different sets of tabs.
Cost: Free.
Limitation: Saved sessions are stored locally. Clearing browser data can delete them unless you export first.
Skip it if: You keep a minimal number of tabs open.
Vimium
What it does: Keyboard-driven navigation for your Google Chrome browser. Adds Vim-style shortcuts for scrolling, opening links, and switching between tabs without touching your mouse.
Best for: Speed-focused developers who prefer keyboard-only workflows.
Cost: Free.
Limitation: Has a learning curve. Vim-style shortcuts are not intuitive for developers unfamiliar with Vim.
Skip it if: You do not use Vim keybindings in your editor.
Grepper
What it does: Surfaces community-submitted code snippets directly inside Google search results. When you look up a JavaScript function or CSS pattern, Grepper shows the answer inline from the search bar.
Best for: Quick reference lookups where you want the code answer without clicking into a separate page.
Cost: Free tier available; paid plans add more snippet storage.
Limitation: Snippet quality depends on community contributions. Verify code before using it in production.
Skip it if: You prefer to read full documentation rather than copy short snippets from community sources.
Productivity tools are personal choices. Session Buddy might be a lifesaver for someone with thirty open tabs but unnecessary for someone who clears tabs daily. Choosing the right tech stack and toolset is about matching the tool to your workflow, not collecting features you rarely use.
At-a-Glance Extension Comparison
Here is every extension from this article in one table. Use it to compare key features before you install anything from the Chrome Web Store.
| Name | Use Case | Free/Paid | Best For | Skip If |
|---|---|---|---|---|
| React Developer Tools | Component tree and profiler | Free | React and Next.js developers | Not using React |
| Redux DevTools | State time-travel debugging | Free | Redux state management | Not using Redux |
| Wappalyzer | Tech stack detection | Free/Paid | Competitive research | Only working on own codebases |
| Lighthouse | Performance and SEO audit | Free (built-in) | Every web developer | Mobile-only Flutter projects |
| CSS Peeper | CSS property inspection | Free | Frontend developers | Comfortable in DevTools Elements |
| ColorZilla | Color picking and gradients | Free | Design-to-code work | Token-based design systems |
| WhatFont | Font identification | Free | Typography checks | Single design system teams |
| VisBug | Visual CSS editing on live pages | Free | Layout prototyping | Prefer code-only edits |
| JSON Viewer | Readable JSON responses | Free | API developers | Using a dedicated API client |
| ModHeader | HTTP header modification | Free/Paid | API testing | Staging environments with test creds |
| Postman Interceptor | Capture requests for Postman | Free | API testing teams | Not using Postman |
| Octotree | GitHub file tree sidebar | Free/Paid | Open-source contributors | Working primarily in local IDE |
| Session Buddy | Tab session management | Free | Multi-project workflows | Minimal tab users |
| Vimium | Keyboard-only browsing | Free | Speed-focused coders | Unfamiliar with Vim keybindings |
| Grepper | Code snippets in search results | Free | Quick reference lookups | Prefer full documentation |
Three Ready-Made Stacks You Can Install Today
Picking chrome extensions one by one takes time. Here are three curated stacks. Install them from the Chrome Web Store individually using the names above, or save them as a shared Chrome profile for your team.
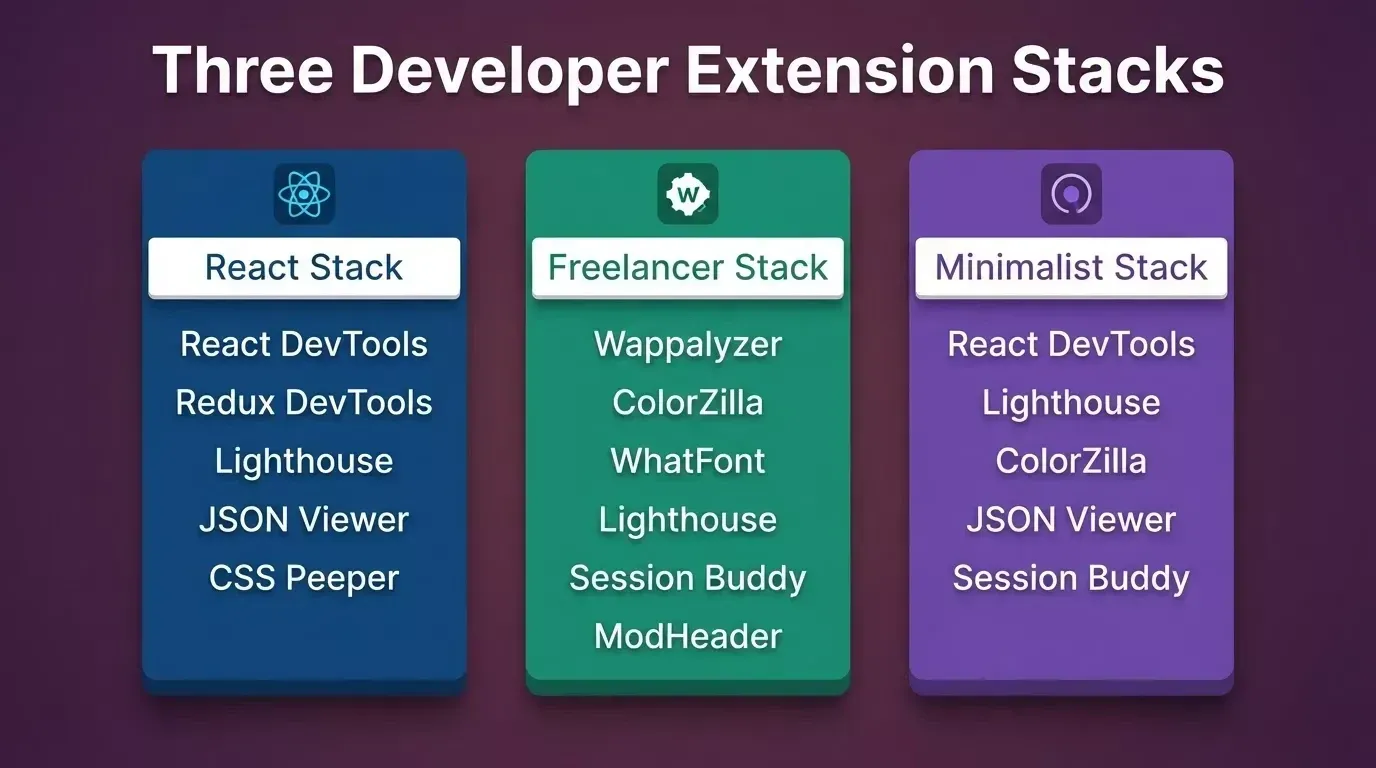
Three pre-built stacks: pick the one that matches your workflow and install in one session.
Next.js and React Dev Stack
React Developer Tools, Redux DevTools, Lighthouse, JSON Viewer, CSS Peeper. Five extensions, zero cost. This covers component debugging, state inspection, performance scoring, API readability, and design matching for any React or Next.js project.
Freelancer Stack
Wappalyzer, ColorZilla, WhatFont, Lighthouse, Session Buddy, ModHeader. Six extensions that cover client-site audits, design matching, tab management across projects, and API header testing. Helpful for anyone working across multiple client websites on different browsers.
Minimalist Stack
React Developer Tools, Lighthouse, ColorZilla, JSON Viewer, Session Buddy. The leanest possible setup that still covers debugging, performance, color, APIs, and session management. Perfect if you want to keep things manageable and accessible from your toolbar.
What Should You Uninstall and How to Audit Permissions
Having too many extensions installed is itself a performance problem. Chrome extensions slow down your browser when they run background scripts, inject content scripts into every page, or request broad permissions they do not need.
Signs you have extension bloat: If your Chrome toolbar shows more than ten pinned icons, you are carrying dead weight. Each extension that loads on every page adds memory use and slows page load on mobile devices and desktop alike.
How to audit your installed extensions:
-
Type chrome://extensions in the address bar and press Enter.
-
Click Details on any extension to see its full permissions list and manifest file. Developer mode is not required for this step.
-
Look for extensions requesting "Read and change all your data on all websites." That is the broadest permission level available, and it is rarely necessary for the extension's core function.
-
For new installs, check the Privacy practices section on the Chrome Web Store listing before clicking Add to Chrome.
-
Remove anything you have not clicked in thirty days. Clear cache and restart to see the difference immediately.
Abandoned extensions: Extensions that have not been updated in over a year are security risks. Check the "Last updated" date on the Chrome Web Store listing for every extension you install.
As one user noted in an r/MacOS discussion about Chrome resource use:
"Try uninstalling any Chrome extensions you don't use frequently. Many of them take up CPU cycles and memory even when you aren't using them."
The web store hosts nearly 125,000 extensions. Being selective is not about having less. It is about having what works for your current needs.
Where Rocket Fits Into Your Developer Workflow
Extensions help you inspect and debug a running app. Rocket is the vibe solutioning platform that builds the app your extension stack will inspect. The two tools cover different stages of the same workflow.
Here is how they connect in practice:
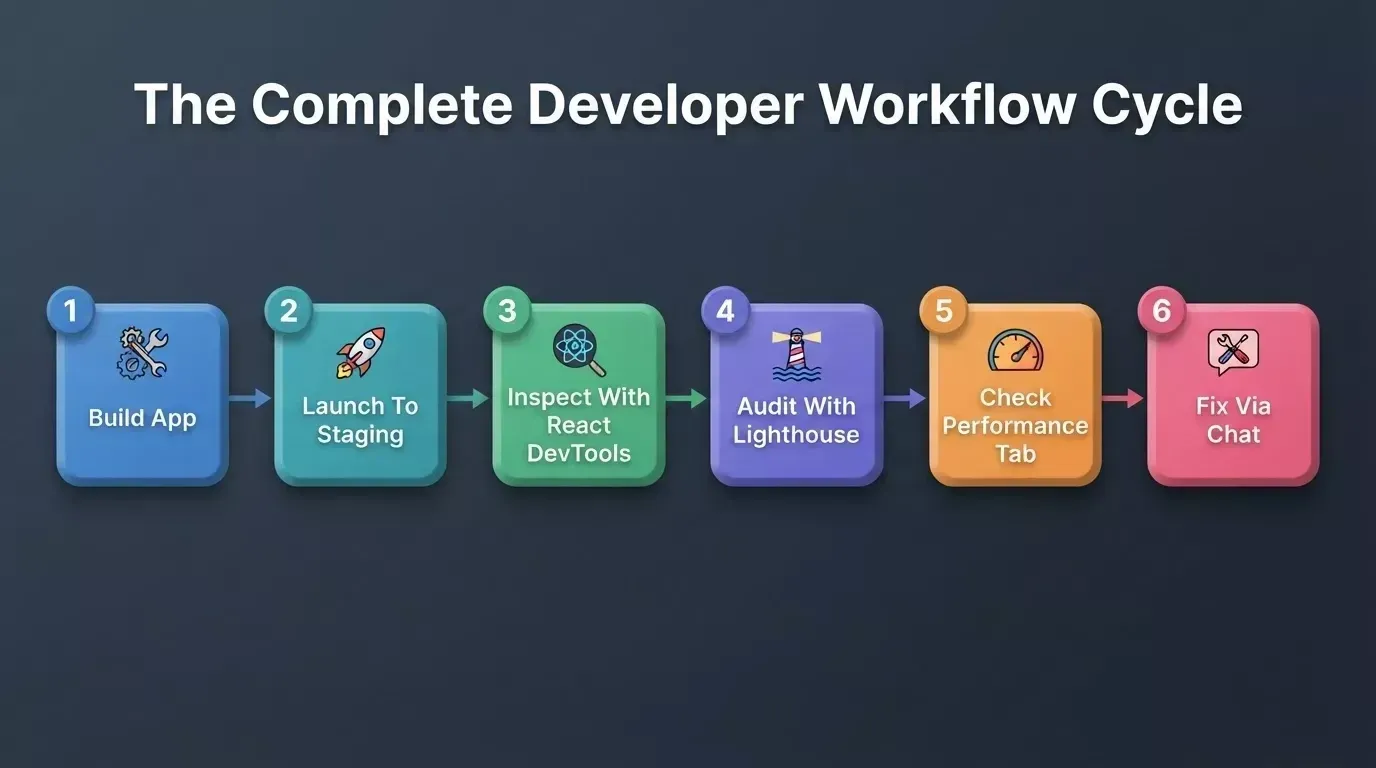
The complete build-and-inspect cycle: six steps from first prompt to final fix.
-
Build your Next.js web app from a prompt, an attachment, a Figma file, or by redesigning an existing URL with Rocket Build. The output is production-ready Next.js code with a reasonable baseline of semantic HTML, basic heading hierarchy, form labels, and responsive layouts.
-
Launch to a staging URL. Rocket publishes your app to a staging environment so you can share it with reviewers and validate everything before going live.
-
Open the staging URL in Chrome, then run React DevTools and Lighthouse. Because Rocket generates standard Next.js, React Developer Tools and Lighthouse work on Rocket-built web apps exactly as they do on any other Next.js project.
-
Check the Rocket Performance tab if your project is a website or landing page. The Performance dashboard grades your site from A to F on five metrics: LCP, INP, and CLS (the three Core Web Vitals Google uses for ranking), plus FCP and TTFB as diagnostics. It flags specific issues such as unoptimized images and missing cache headers. Click Try to fix to apply an automatic fix (this uses credits) or describe the issue in chat. For a deeper look at SaaS performance optimization, the principles there apply directly to Rocket-built apps too.
-
Run accessibility improvements via chat. Ask Rocket to add ARIA labels, fix color contrast, improve keyboard navigation, or generate a WCAG 2.1 AA compliance report using the /Generate Accessibility Report command.
-
Sync to GitHub and continue in your IDE. If your project is a Next.js TypeScript project, two-way GitHub sync keeps edits flowing between Rocket and your repository. Describe issues in plain language in chat, and Rocket applies targeted fixes in context.
Extensions cover what you see in the browser. Rocket covers what you build before the browser opens. Together, they create a complete workflow from creation through inspection to production.
Ready to build the app your extension stack will inspect? Sign up at Rocket.new in about 30 seconds, no credit card required, and ship a production-ready Next.js app your developer tools can put to work today.
Table of contents
- -Quick Picks by Need
- -How Did We Pick These Fifteen Tools?
- -Which Extensions Handle Inspecting and Debugging?
- -React Developer Tools
- -Redux DevTools
- -Wappalyzer
- -Lighthouse
- -Which Extensions Speed Up CSS and Design Handoff?
- -CSS Peeper
- -ColorZilla
- -WhatFont
- -VisBug
- -Which Extensions Help With API and Network Testing?
- -JSON Viewer
- -ModHeader
- -Postman Interceptor
- -Which Extensions Cover Productivity and GitHub?
- -Octotree
- -Session Buddy
- -Vimium
- -Grepper
- -At-a-Glance Extension Comparison
- -Three Ready-Made Stacks You Can Install Today
- -Next.js and React Dev Stack
- -Freelancer Stack
- -Minimalist Stack
- -What Should You Uninstall and How to Audit Permissions
- -Where Rocket Fits Into Your Developer Workflow