
Building an MCP server dashboard gives your AI agents real-time observability. This blog covers architecture, metrics, testing, deployment, and how to ship a production-ready dashboard faster.
Do your AI agents fail silently when MCP servers go down?
The Model Context Protocol (MCP) ecosystem has exploded to over 89,000 GitHub stars since Anthropic open-sourced it in November 2024, according to the MCP servers repository on GitHub. Teams are building MCP servers at a pace that outstrips their ability to monitor them.
Without a proper dashboard, you cannot know if your configured MCP servers are responding. You also cannot tell if token usage is spiking or if latency is creeping toward unacceptable levels.
This blog walks you through planning, building, and deploying an MCP server dashboard that gives your AI tools the observability they deserve.
Understanding the MCP Server Ecosystem
MCP servers connect large language models to external tools, data sources, and business systems through a standardized protocol. Think of each MCP server as a bridge between your AI agents and the services they need to access.
| Component | Role | Example |
|---|---|---|
| MCP Host | Application running AI models | Claude Desktop, custom AI app |
| MCP Client | Manages connections to servers | Built into the host application |
| MCP Server | Exposes tools and data sources | Database connector, API wrapper |
| Transport Layer | Communication channel | stdio, HTTP with SSE |
-
Standardized connections allow any MCP client to interact with any MCP server using the same protocol, regardless of what external systems sit behind it
-
Tool registration means each server exposes one or more tools that AI agents can discover and call without manual configuration
-
Resource access lets language models query structured data from databases, files, and external tools through a consistent interface
-
Context sharing enables AI applications to maintain conversation state across multiple services and data sources
Without a dashboard, you have zero visibility into whether individual MCP servers are healthy, responding within expected latency windows, or throwing errors. As your agent infrastructure grows from one server to dozens, this blind spot becomes a serious operational risk.
How Model Context Protocol Connects AI to Data
The Model Context Protocol (MCP) was announced by Anthropic in November 2024 as an open standard for connecting AI assistants to external systems. It replaces fragmented, one-off integrations with a single protocol that any AI application can use.
When an AI agent needs business data from a CRM, it sends a request through the MCP client. The client routes that request to the appropriate MCP server. The server handles authentication, transforms the data, and returns structured results. This same pattern applies whether you have two servers or two hundred.
For a deeper look at how MCP fits into agent workflows, the MCP for AI agents guide covers the full picture, from protocol basics to production patterns.
Types of MCP Servers Your Dashboard Will Monitor
Understanding the variety of MCP server types helps you design a dashboard that covers every integration your agents rely on:
| MCP Server Type | What It Connects | Key Metrics to Watch |
|---|---|---|
| Database server | PostgreSQL, MySQL, Supabase | Query latency, connection pool, error rate |
| API wrapper server | REST APIs, GraphQL endpoints | Response time, rate limit headroom, auth failures |
| File system server | Local files, cloud storage | Read/write latency, permission errors |
| Memory server | Persistent agent context | Cache hit rate, storage usage |
| Search server | Vector DBs, Elasticsearch | Query time, index freshness |
| Notification server | Email, Slack, webhooks | Delivery rate, queue depth |
Each server type produces different telemetry signals. A well-designed dashboard surfaces the right metrics for each type rather than applying a one-size-fits-all view.
How Do MCP Servers Communicate with AI Clients?
Understanding the communication flow between MCP servers and MCP clients is the foundation for knowing what your dashboard needs to monitor.
-
Request-response pattern: The MCP client sends a JSON-RPC request to a server. The server processes the call and interacts with its connected data source. It then responds with structured data the AI model can use.
-
Tool discovery: When a client first connects, the MCP server exposes its available tools, resources, and capabilities. The client caches this list, including MCP tools exposed by the server, so agents can query available tools without repeated discovery calls.
-
Streaming context: For long-running operations, servers send partial responses using server-sent events. This lets AI agents start working with initial data while the rest loads in.
-
Error handling: Servers return typed error codes when tool execution fails, a resource is unavailable, or authentication tokens expire. Your dashboard should capture each of these failure modes.
Every interaction between client and server generates telemetry data. Request counts, response times, error rates, token usage, and tool execution durations are all signals your dashboard needs to visualize. Understanding context engineering best practices helps you structure how that observability data flows and compounds across sessions.
Planning Your MCP Server Dashboard Architecture
Before writing any code, decide what data your dashboard will display, where that data lives, and how you will access it.
-
Define your data model. At minimum, track request count, error rate, average latency, active connections, and token consumption per server. The dashboard should also expose resources like schemas and documentation for clarity around each dataset.
-
Choose your backend stack. A REST API backend gives you flexibility to connect multiple cloud providers. PostgreSQL handles structured telemetry well, while NoSQL databases like MongoDB work for high-volume event logs. Some MCP server implementations support 55+ native data sources, including SQL and NoSQL, so plan telemetry coverage and connectors accordingly. Supabase is a strong choice for MCP dashboards because it combines PostgreSQL with real-time subscriptions. Your dashboard can push live server status updates without polling.
-
Set up authentication and access control. Role-based access control prevents unauthorized users from viewing sensitive operational data. Consider OAuth with a client ID and client secret for API authentication, or API key-based access for simpler setups.
-
Plan your data pipeline. Structured telemetry from each server flows through a gateway. It gets filtered and stored in your database, then queried by your dashboard frontend.
For teams using Supabase as their backend, the Supabase MCP integration guide explains how to connect MCP servers directly to Supabase for real-time telemetry storage and live dashboard updates.
Choosing Backends and Data Sources
Your choice of backend depends on scale. For small teams with fewer than ten MCP servers, a simple PostgreSQL database with a REST API layer works fine. For larger deployments managing multiple services across multiple cloud providers, you may need a dedicated time-series database. You would also need a gateway that aggregates telemetry from every server before writing to storage.
The key decisions at this stage:
-
Will you use a managed cloud platform or self-host?
-
Do you need real-time streaming or is polling on intervals acceptable?
-
Which cloud platforms will your MCP servers deploy to?
Security and Role-Based Access Control
Security is not optional for a monitoring dashboard that exposes operational data about your AI infrastructure, and in MCP Apps, UI rendering is often handled through sandboxed iframes to keep interactions secure. Implement role-based access control from the start. A well-structured access model has three tiers:
-
Admin users get full access to all servers, configuration, and sensitive metrics like client secret rotation
-
Creator users can view dashboards, add new servers to monitor, and configure alerts, but cannot modify authentication settings
-
Viewer users see dashboards and charts but cannot modify server configuration or access raw telemetry
Audit logging should capture detailed logs of AI-initiated actions for compliance, review, and implementation details tied to each user action.
Step-by-Step: Setting Up Your First MCP Server Dashboard
Here is how to set up your first MCP server with monitoring capabilities, connect it to Claude Desktop, and verify everything works using the MCP Inspector.
Installing SDK and Configuring Dependencies
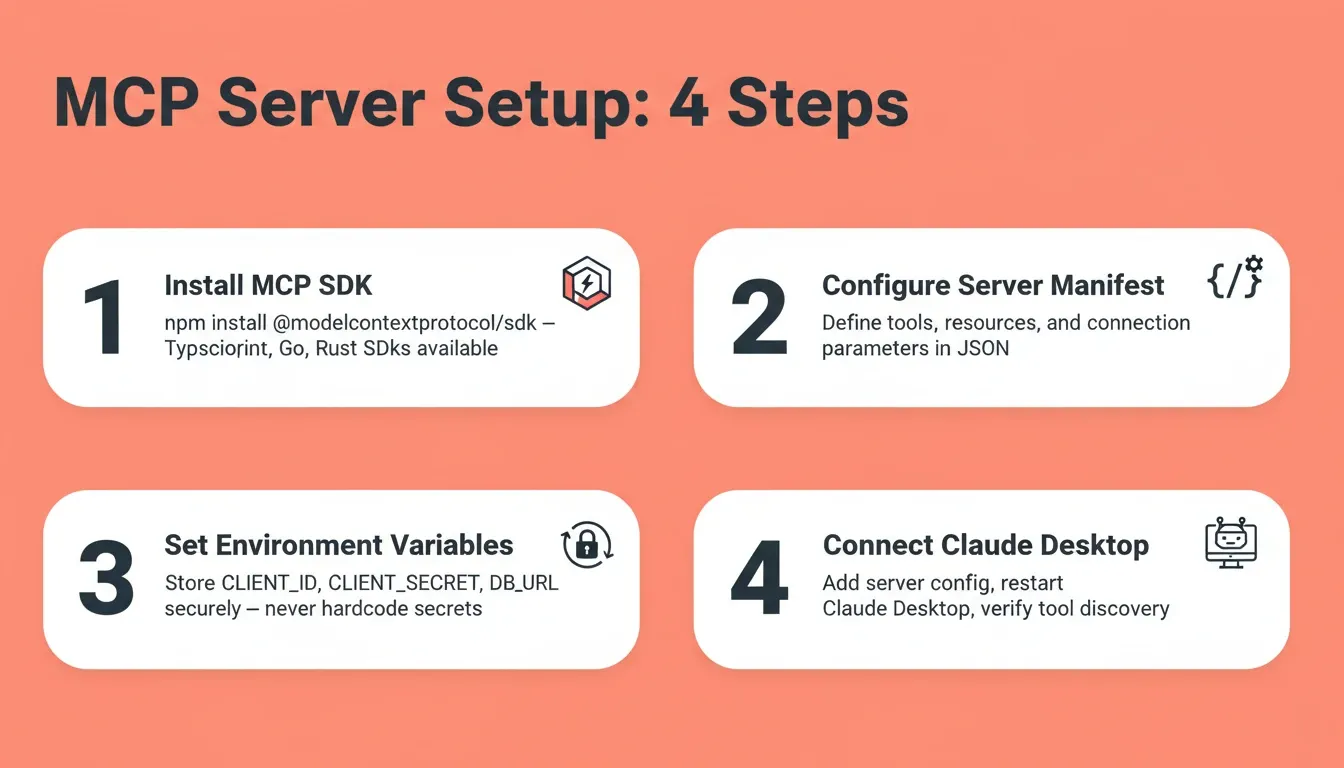
Start by installing the MCP SDK for your language of choice. The TypeScript SDK is the most mature, but Python, Go, Java, and Rust SDKs are all production-ready.
1# Install the TypeScript MCP SDK
2npm install @modelcontextprotocol/sdk
3
4# Create your project structure
5mkdir mcp-dashboard-server && cd mcp-dashboard-server
6npm init -y
Next, create your server configuration file. Every MCP server needs a manifest that describes its tools, resources, and connection parameters.
1{
2 "name": "dashboard-metrics-server",
3 "version": "1.0.0",
4 "tools": [
5 {
6 "name": "get_server_health",
7 "description": "Returns health status for all configured MCP servers",
8 "parameters": {
9 "type": "object",
10 "properties": {
11 "server_id": { "type": "string" }
12 }
13 }
14 }
15 ]
16}
Store your client ID and client secret as environment variables. Never hardcode secrets in your configuration files. Configure the setup to run locally first, then move to remote deployment.
Connecting Remote MCP Servers and Claude Desktop
To test your dashboard server with Claude Desktop, add it to the Claude Desktop configuration file:
1{
2 "mcpServers": {
3 "dashboard-metrics": {
4 "command": "npx",
5 "args": ["-y", "mcp-dashboard-server"],
6 "env": {
7 "CLIENT_ID": "your-client-id",
8 "CLIENT_SECRET": "your-client-secret",
9 "DB_URL": "postgresql://localhost/metrics"
10 }
11 }
12 }
13}
After saving this configuration, restart Claude Desktop to load the new server. Claude will discover the tools your server exposes and display them in the interface. MCP Apps can also be created with AI coding agents in VS Code Insiders for teams building and testing alongside Claude Desktop. You can now ask Claude to query server health, check latency reports, or generate usage charts directly from the conversation. Teams using Claude Code can follow a similar setup because the MCP workflow has broad support across compatible tools.
For remote MCP servers running on cloud infrastructure, you will need to configure HTTPS endpoints and handle authentication tokens at the transport layer. Unlike local MCP servers that use stdio, remote servers connect through HTTP with server-sent events. This means your dashboard also needs to monitor connection state for each remote endpoint.
If you have worked with building dashboards without a developer before, this pattern will feel familiar. The key difference with MCP is that your data source is the MCP protocol itself rather than an external API.
Which Metrics Should Your MCP Server Dashboard Track?
A good dashboard answers questions before you think to ask them. Here are the categories of metrics that matter most for MCP server observability. Some MCP toolsets expose a primary natural-language action such as Knowi’s knowi_do alongside deterministic operations, so the dashboard should make both easy to track.
-
Request volume: How many requests are hitting the server over time
-
Latency: How long responses take, including average and p95/p99 timings
-
Error rate: Failures by endpoint, tool, or request type
-
Tool usage: Which tools are being called most often and by whom
-
Token or compute usage: Especially useful if requests trigger LLM processing
-
Authentication events: Failed auth, token expiry, or suspicious login patterns
-
Session behavior: Frequency, duration, and concurrency of active clients
-
Rate limits / throttling: Whether clients are being delayed or rejected
Some MCP toolsets include 9 deterministic tools for instant data operations, which can also merit monitoring, along with agent calls when they affect execution cost or resource fetching.
A good dashboard should also help you understand relationships between events, with advanced views such as end-to-end request tracing and dependency graphs.
AI Observability, Telemetry, and Health Checks
AI observability goes beyond simple uptime monitoring. You need to understand how each server performs under load, how many tokens your agents consume, and where bottlenecks appear in tool execution chains.
| Metric Category | What to Track | Why It Matters |
|---|---|---|
| Health | Server status, uptime, restart count | Catch failures before agents do |
| Latency | Response time per tool, p50/p95/p99 | Identify slow servers affecting agent performance |
| Token Usage | Tokens per request, daily consumption, cost | Control spend and spot anomalies |
| Error Rates | Failed calls, timeout rates, auth failures | Debug broken integrations quickly |
| Throughput | Requests per second, concurrent connections | Plan capacity before hitting limits |
| Resource Usage | CPU, memory, disk for each server | Prevent crashes from resource exhaustion |
-
Health checks should run every 30 seconds against each configured server. Log both response status and response time to detect degradation before complete failure.
-
Structured telemetry data feeds into charts showing trends over time. This makes it easy to spot when a server starts performing differently than its baseline.
-
Token tracking helps you manage cost across AI workflows, especially when agents query multiple tools in a single conversation.
-
Latency percentiles reveal performance for real users better than averages. A few slow requests hidden in a fast average can still ruin the agent experience.
Setting Up Alerts and Thresholds
Metrics without alerts are just charts. Define thresholds for each category so your dashboard notifies you before users notice problems:
-
Critical alert: Server offline for more than 60 seconds, error rate exceeds 10% over a five-minute window, or authentication failures spike above baseline
-
Warning alert: p95 latency exceeds two times the seven-day average, token consumption exceeds 80% of daily budget, or CPU usage stays above 85% for more than three minutes
-
Info notification: New server connected, configuration change detected, or weekly usage summary
Store alert rules in your database alongside server configuration. This way, they persist across deployments and you can manage them through the dashboard UI itself.
How Rocket Speeds Up MCP Dashboard Development
Building an MCP server dashboard manually means stitching together a frontend framework, a backend API, a database, authentication, chart libraries, and deployment infrastructure. That is a lot of moving parts for something that should be a weekend project.
Rocket is a vibe solutioning platform that handles the entire stack from a single conversation. Describe the dashboard you want, specify which MCP servers to monitor, and Rocket's Build generates a complete, production-ready Next.js application.
Teams that need to validate the right dashboard scope before building can use Solve to research requirements, map out the right metrics, and define the data model. That context carries directly into the build. Once your dashboard is live, Intelligence monitors what matters in your competitive environment so you can keep iterating with full market context.
What Rocket Generates for Your MCP Dashboard
When you describe your MCP server dashboard to Rocket, the generated application includes:
-
Real-time health monitoring panels for each of your configured MCP servers, with auto-refresh and alert states
-
Latency and throughput charts using production-grade charting libraries, pre-connected to your telemetry data sources
-
Token usage dashboards that track consumption across AI agents, break down cost per server, and flag spending anomalies
-
Role-based access control with Admin, Creator, and Viewer tiers baked in from the first generation
-
Supabase integration for real-time data, plus support for custom integrations through an MCP-compatible REST API endpoint such as /api/2.0/mcp/tools/call.
-
Environment variable management. Your client IDs, client secrets, and database URLs are stored securely at the server level and never exposed in client code.
-
Staging and production environments with full version history and one-click rollback
-
A centralized web interface so the generated app can manage and monitor multiple servers from one dashboard
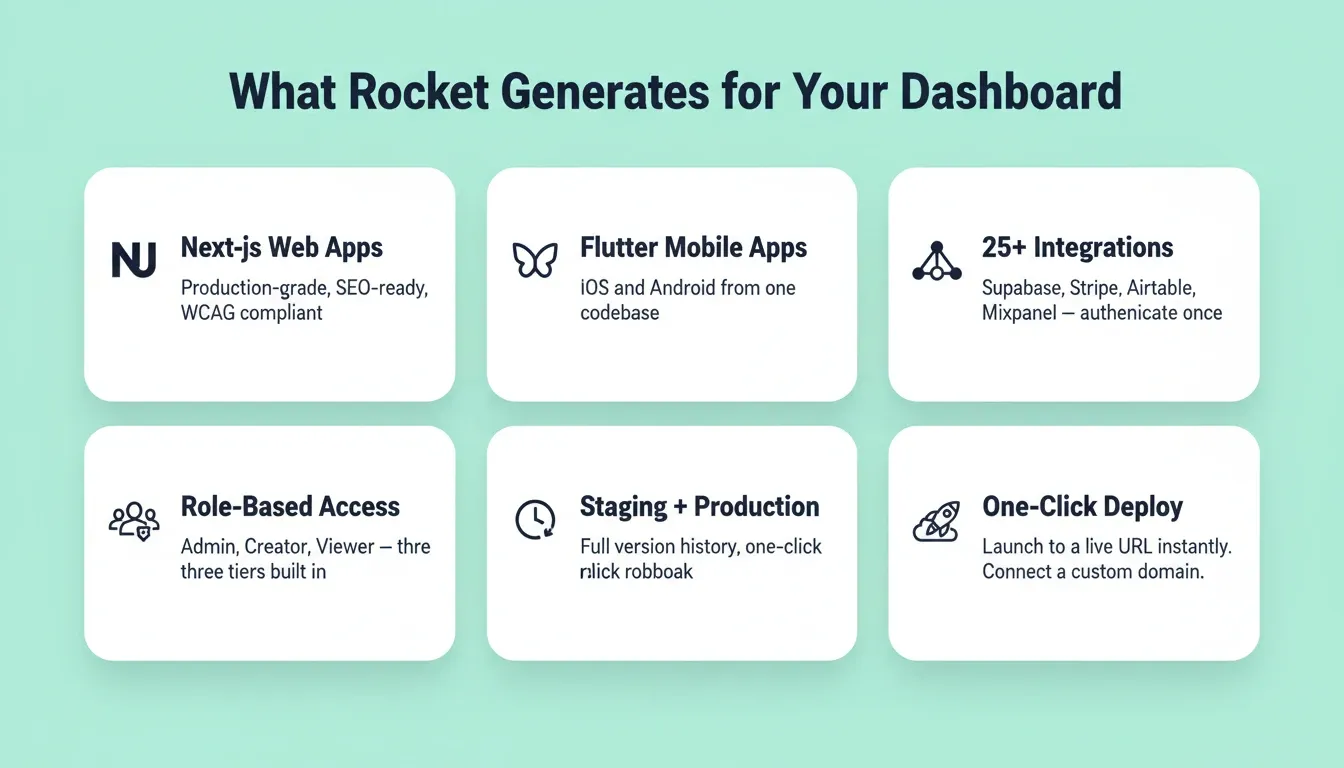
What Rocket Generates for Your Dashboard — a 3x2 grid of 6 feature cards: Next.js Web Apps, Flutter Mobile Apps, 25+ Integrations, Role-Based Access with Admin/Creator/Viewer, Staging + Production with version history, and One-Click Deploy
For teams who want to see what AI-built internal dashboards look like in practice, this guide on AI-built dashboards connecting Airtable, Notion, and Mixpanel shows the same generation pattern applied to different data sources.
The Exact Prompt to Use
When you open Rocket and click Build, use a prompt like this to get the closest first result:
"Build an MCP server monitoring dashboard. It needs a main overview page showing health status, latency (p50/p95/p99), token usage, and error rates for each connected MCP server. Include a server detail page with 24-hour charts. Build dashboards from each relevant dataset and include interactive views where needed. Add role-based access with Admin and Viewer roles. Use Supabase as the backend. Dark theme with a sidebar navigation listing each server."
The more specific you are about screens, data sources, and design preferences, the closer the first generation will be to what you need. You can then iterate through chat with no change limit.
Rocket vs. Building Manually
Manual dashboard projects typically take two to four weeks of engineering time to reach production. Here is where that time actually goes:
| Task | Manual Build | Rocket |
|---|---|---|
| Frontend framework setup | 2–4 hours | Included in generation |
| Database schema and API | 1–2 days | Generated from description |
| Authentication and RBAC | 1–3 days | Generated with three-tier access |
| Charts and real-time updates | 1–2 days | Generated with Supabase integration |
| Staging environment | 4–8 hours | One click |
| Custom domain and HTTPS | 2–4 hours | Automatic |
| Version history and rollback | 1–2 days | Built in |
| Total | 2–4 weeks | Same day |
With Rocket, you describe the dashboard in plain language, iterate through chat, and ship on the same day. The generated code is production-grade Next.js that you own completely. Download the source, connect your GitHub repository, or continue iterating inside Rocket.
Testing and Debugging with MCP Inspector
Before your dashboard goes live, you need to verify that every MCP server connection works correctly. The MCP Inspector is the developer tool built specifically for this purpose.
-
Launch MCP Inspector by running npx @modelcontextprotocol/inspector from your terminal. It opens a browser-based interface where you can connect to any local or remote MCP server and manually test tool calls.
-
Verify tool responses by calling each exposed tool with sample parameters. Check that return values match expected schemas and that error states are handled cleanly.
-
Test under load by sending rapid requests to simulate what happens when multiple AI agents query the same server simultaneously. Watch for timeout errors, dropped connections, or unexpected response codes.
-
Check logging output in your server console. Every request should generate a structured log entry with timestamps, the calling client ID, tool name, execution duration, and result status.
Common Issues and Fixes
When debugging MCP servers, these are the most frequent problems you will encounter:
-
Server not appearing in Claude Desktop: This is usually a configuration path issue. Confirm the command and args in your config point to the correct executable. Restart Claude Desktop after any config change.
-
Authentication failures on remote servers: Verify your client secret has not expired. Check that HTTPS certificates are valid and the token exchange endpoint returns proper responses.
-
Slow tool execution: Profile your server code to find where time is spent. Often the bottleneck is not the MCP protocol itself. The underlying data source query may be taking too long under load.
-
Missing telemetry in dashboard: Confirm your server is writing structured telemetry to the expected endpoint. Run the MCP Inspector to verify data is being generated, then check your dashboard data pipeline for dropped events.
The MCP servers repository on GitHub contains reference implementations with built-in logging you can copy into your own servers. These examples show the correct patterns for emitting telemetry that dashboards can consume.
Deploying and Scaling Your MCP Dashboard for Production
Once your dashboard is tested locally, you need to deploy it where your team can access it reliably.
-
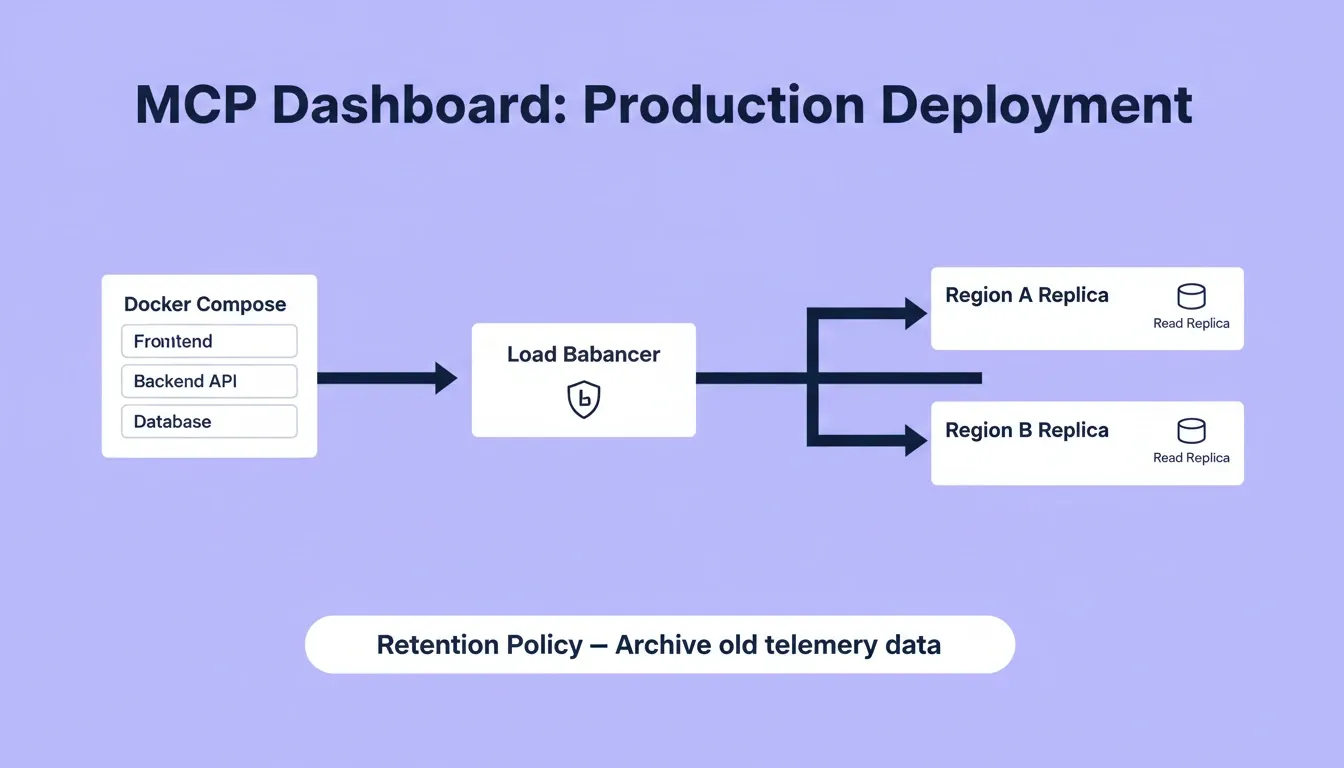
Containerize with Docker Compose to package your dashboard frontend, backend API, and database into a single deployable unit. This ensures consistent behavior across environments and simplifies scaling.
-
Choose your deployment target. For teams using multiple cloud providers, deploy your dashboard to the same region where most of your MCP servers run. This minimizes latency between your monitoring system and the servers it tracks.
-
Set up resource allocation to handle traffic spikes. Monitoring dashboards tend to receive burst traffic during incidents when everyone checks status simultaneously. Allocate enough memory and CPU to handle at least three times your normal load.
-
Configure auto-scaling if your server fleet is large. As you add more remote MCP servers to monitor, your dashboard data ingestion and query load grows proportionally.
Multi-Region and Load Balancing
For production deployments serving distributed teams, consider these scaling patterns:
-
Run dashboard replicas in each region where your team operates
-
Use a load balancer to distribute requests across replicas
-
Replicate your metrics database with read replicas in each region to keep dashboard queries fast
-
Set retention policies to archive old telemetry data and prevent storage costs from growing without limit
Deploy often and deploy early. A dashboard that exists only in staging helps nobody during an outage.
Built-in Analytics After Launch
Once your MCP dashboard is live, you need to monitor the dashboard itself. If you built with Rocket, built-in analytics start collecting data the moment your site goes live. You get visits, unique visitors, pageviews, visit duration, and bounce rate, broken down by source, device, country, and page.
Core Web Vitals performance grades are also available. Rocket identifies specific issues and offers automatic fixes. This gives you a complete picture of how your team actually uses the dashboard and which views they check most. For a broader look at how to build and monitor AI applications from a single workflow, see this guide on monitoring AI applications.
The Future of MCP Server Monitoring
As AI agent infrastructure scales, MCP server dashboards will become as standard as application performance monitoring is today. The teams shipping reliable AI products already treat observability as a first-class requirement, not an afterthought.
Start Building Your MCP Server Dashboard Today
You have the architecture, the metrics, the debugging tools, and the deployment patterns. The only thing left is to build it.
Type your dashboard requirements into Rocket, and a production-ready MCP server dashboard goes live the same day. It includes real-time health monitoring, latency charts, token tracking, and role-based access. Sign up at Rocket.new and describe the monitoring solution your agents need.
Table of contents
- -Understanding the MCP Server Ecosystem
- -How Model Context Protocol Connects AI to Data
- -Types of MCP Servers Your Dashboard Will Monitor
- -How Do MCP Servers Communicate with AI Clients?
- -Planning Your MCP Server Dashboard Architecture
- -Choosing Backends and Data Sources
- -Security and Role-Based Access Control
- -Step-by-Step: Setting Up Your First MCP Server Dashboard
- -Installing SDK and Configuring Dependencies
- -Connecting Remote MCP Servers and Claude Desktop
- -Which Metrics Should Your MCP Server Dashboard Track?
- -AI Observability, Telemetry, and Health Checks
- -Setting Up Alerts and Thresholds
- -How Rocket Speeds Up MCP Dashboard Development
- -What Rocket Generates for Your MCP Dashboard
- -The Exact Prompt to Use
- -Rocket vs. Building Manually
- -Testing and Debugging with MCP Inspector
- -Common Issues and Fixes
- -Deploying and Scaling Your MCP Dashboard for Production
- -Multi-Region and Load Balancing
- -Built-in Analytics After Launch
- -The Future of MCP Server Monitoring
- -Start Building Your MCP Server Dashboard Today