
Track engagement rate, posting frequency, share of voice, and ad spend across three to five rivals. Run a structured audit, start with free tools like Meta Ad Library, and upgrade to real-time cross-channel monitoring when you're ready.
How do some brands always seem to know exactly what to post - while others keep guessing? The answer is systematic competitive analysis. According to Hootsuite, 58% of people say following a brand on social media shapes their purchasing decisions, which means your rivals' content is actively nudging your shared audience toward choices every single day.
Tracking how competitors post, what earns their engagement, and where they invest in paid ads replaces guesswork with evidence. A clear process, auditing rivals' social accounts, comparing engagement rates, and identifying content gaps, turns competitive data into decisions you can act on. This guide covers what to track, which tools work best at each team size, and how to build a content plan from everything you find.
What Your Rivals' Social Presence Actually Tells You
Most marketers scroll competitors' feeds and walk away with a vague impression. Systematic tracking turns that into specific, comparable numbers that reveal patterns over time.
Engagement Rate and Posting Cadence
Engagement rate is one of the most honest metrics for comparing how well competitors connect with their target audience. It cuts through inflated follower counts and lets you measure competitor performance on what actually matters.
-
What does the engagement rate measures? Divide total interactions, likes, comments, shares, and saves by follower count per post. A competitor with 50,000 followers at 2% engagement outperforms one with 200,000 followers at 0.4%.
-
Posting frequency tells the other half of the story. Rival IQ's 2025 benchmark report studied over 4 million social media posts across 14 industries. Instagram posting frequency declined for most industries while TikTok ticked upward, revealing where competitors are shifting budgets.
-
Platform patterns vary by competitor. A brand posting daily on Instagram may post twice a week on LinkedIn. Those choices reflect where their shared audience is most active and where competitors are concentrating their efforts.
-
Pair posting frequency with engagement rate. If competitors post 14 times per week on Instagram and engagement holds steady, they've found something that works. A sharp drop at that volume signals overextension and declining content quality.
-
Compare cadence against your own schedule. If three direct competitors all post five times per week, and that's the industry norm, your twice-weekly schedule deserves honest scrutiny against your current engagement rate.
Engagement rate and posting frequency together form the baseline for any meaningful competitive benchmarking. One number without the other leaves you drawing incomplete conclusions about what competitors are actually doing.
Share of Voice and Ad Spend
Share of voice measures what percentage of total category conversations each brand controls - across social media platforms, news sites, forums, and blogs. It tracks competitive momentum beyond post-by-post performance.
-
Organic share of voice comes from monitoring how often your brand appears versus competitors in natural conversations. Searching competitor names on Google, social platforms, and niche forums gives a working picture. Social media monitoring tools automate this, pulling audience mentions and competitor sentiment into one dashboard view.
-
The Meta Ad Library is free and underused. Every active ad competitor running on Facebook and Instagram is visible without any login, formats, messaging, or active dates included. A competitor running 40 active ad variations is investing heavily in paid reach.
-
Ad spend proxies from creative volume. Exact spend figures aren't publicly available, but volume and variety are reliable proxies. Competitors producing 30 ad variations are testing at scale, signaling both budget and strategic intent.
-
Competitor sentiment in audience mentions reveals how people actually feel about rival brands. A high share of voice paired with rising negative sentiment is a gap worth moving into.
-
Brand voice signals in competitor content reveal positioning choices. Reading brand voice across channels shows how competitors are trying to own part of the conversation, and where their approach may be leaving audience needs unmet.
Share of voice data becomes most useful when tracked over three to six months. A trend line tells you far more than a single snapshot about where competitors are heading.
What Should You Actually Track First?
Starting with everything is the fastest way to track nothing consistently. Pick four signals to start: engagement rate per post, posting frequency, share of voice, and Meta Ad Library activity.
-
Log these monthly in Google Sheets for three to five direct competitors.
-
After 90 days, patterns emerge that no single snapshot reveals.
-
For teams new to this process, engagement rate and posting frequency are the fastest to pull without any specialized tools.
Building a solid understanding of competitor performance on these basics first makes everything else easier to layer on later. Start narrow, then expand as the routine becomes consistent.
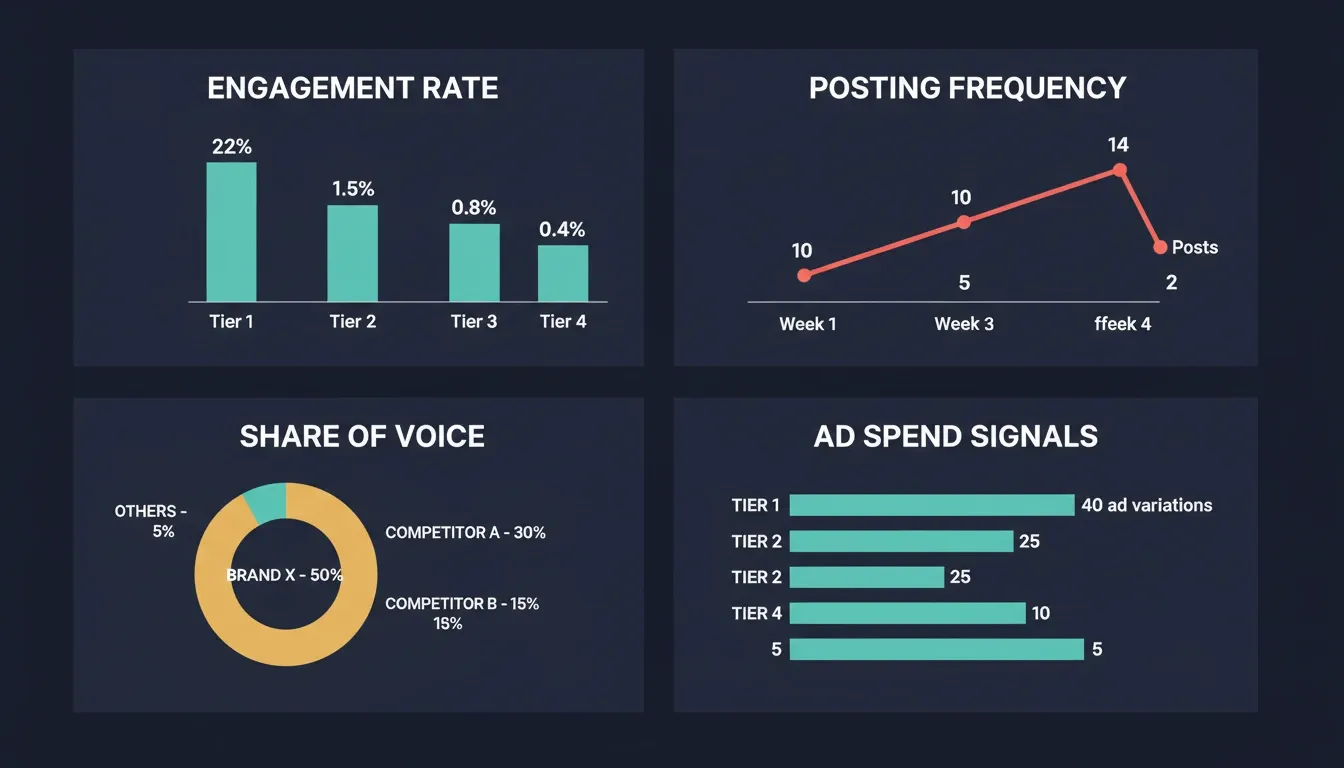
Four core metrics for benchmarking competitors on social media
How to Run a Step-by-Step Competitor Analysis Audit
Rival IQ's 2025 benchmark data found that median engagement rates fell on every major social media platform last year. A competitor that held steady or grew during that period is doing something specific; a structured audit is how you find out what.
Setting Up Your Audit Framework
The first move in any competitive analysis is defining the scope and keeping it manageable. A framework you'll actually complete is worth far more than a comprehensive one that stalls at week two.
-
Start with obvious competitors. Direct competitors sell similar products or services to the same target audience. Three to five is a workable number for a quarterly audit.
-
Add one or two indirect competitors. These brands compete for your audience's attention even when the core product differs. A project management tool and a productivity newsletter might share a large portion of the same target audience.
-
Decide which social media accounts to analyze for each competitor. Prioritize channels where your shared audience is most active rather than treating every platform equally.
-
Choose a competitive analysis template before you begin. A Google Sheets tracker with columns for platform, follower count, engagement rate, posting frequency, content formats, and hashtags saves significant time. A consistent template makes quarterly audits faster to compare over time.
-
Set a review cadence. Monthly data pulls with a deeper quarterly competitive analysis is a reliable rhythm. Monthly keeps you current; quarterly surfaces patterns that shorter windows miss.
A structured template applied consistently over months gives you trend data - and trend data is what separates informed decisions from guesswork.
| Audit Element | What to Track | Frequency |
|---|---|---|
| Engagement rate | Likes, comments, shares, saves per post | Monthly |
| Posting frequency | Posts per week per platform | Monthly |
| Content formats | Reels, carousels, static, Stories | Monthly |
| Share of voice | Brand mentions vs. competitors | Quarterly |
| Ad activity | Active ad count via Meta Ad Library | Monthly |
| Hashtag patterns | Top hashtags on high-engagement posts | Quarterly |
| Audience sentiment | Comment tone, recurring complaints | Quarterly |
1flowchart TD
2 A["Define Rivals\n(3-5 direct)"] --> B["Select Platforms\nper competitor"]
3 B --> C["Pull Core Metrics\nengagement, SOV"]
4 C --> D["Review Top Posts\nand ad activity"]
5 D --> E["Identify Gaps\nand opportunities"]
6 E --> F["Update Content\nStrategy"]
7 classDef input fill:#4F46E5,color:#fff,stroke:#3730a3
8 classDef process fill:#0891b2,color:#fff,stroke:#0e7490
9 classDef output fill:#059669,color:#fff,stroke:#047857
10 class A,B input
11 class C,D process
12 class E,F output
What Does a Solid Audit Actually Look Like?
Once your framework is in place, each competitor goes through the same review sequence. Consistency is what makes quarterly data comparable and useful over time.
-
Content formats first: Which post types earn top engagement for each competitor, Reels, carousels, short-form video, or static images? High engagement on carousels tells you a competitor's audience responds to multi-image storytelling.
-
Messaging and brand voice second: Read a competitor's last 30 posts. Note which topics recur, whether the tone is casual or formal, and whether they lean on behind-the-scenes videos or user-generated content.
-
Hashtag patterns: Which hashtags appear on competitors' high-engagement posts? Repeating patterns reveal whether they're targeting broad discovery or a niche community, useful for both content planning and paid targeting.
-
Response behavior: How do competitors handle comments and complaints? A brand responding consistently to every comment treats customer care as a visible priority.
-
SWOT framing at the end: Note competitor strengths you'd need to match, weaknesses you can capitalize on, and the gaps that open opportunities for your brand.
A thorough audit gives you enough competitive intelligence to make concrete decisions and not just a description of what competitors are currently doing.
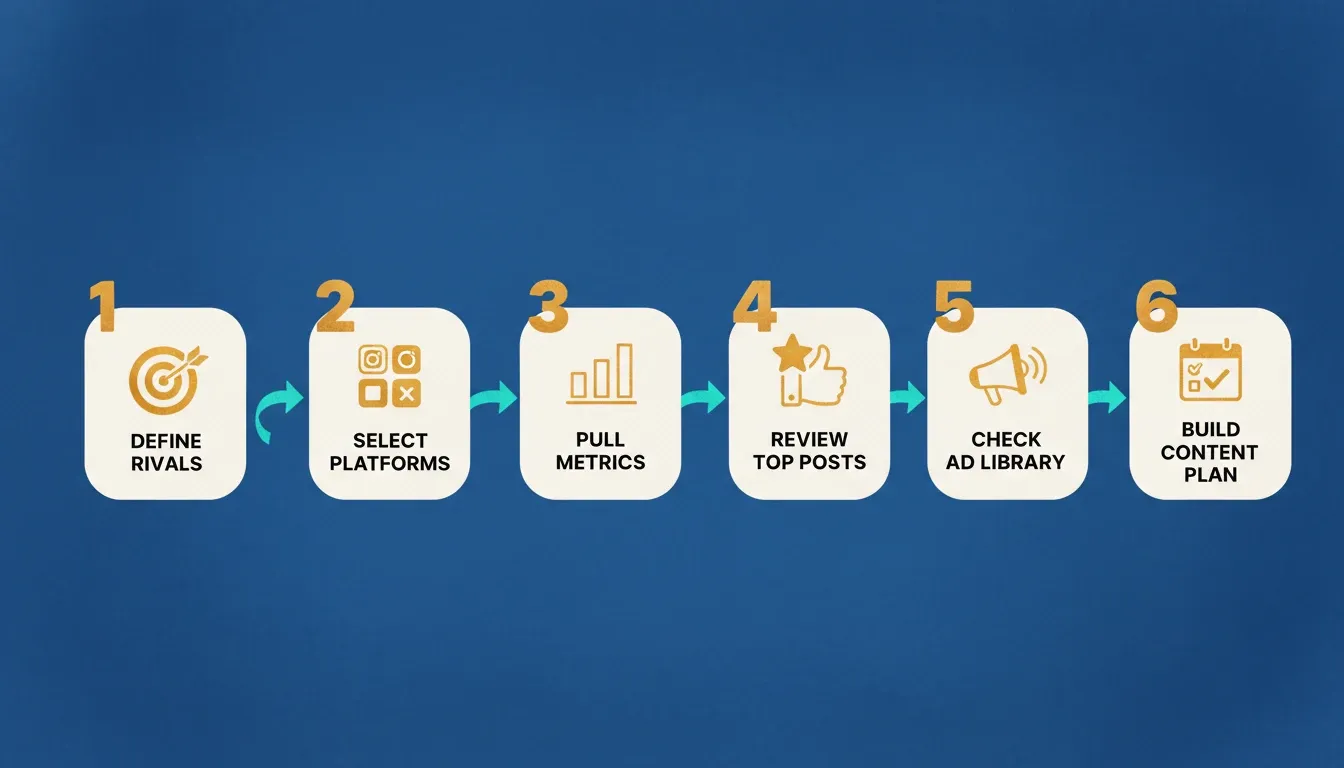
A repeatable audit sequence keeps quarterly competitive reviews consistent and comparable
Free and Paid Competitive Analysis Tools Compared
There is a wide range of social media competitor analysis tools - and a meaningful number cost nothing. The difference between free and paid usually comes down to historical data access, automated competitor reports, real-time monitoring, and how many rivals you can track at once.
Free Tools Worth Bookmarking
Free tools cover the fundamentals well for teams starting out or working with lean budgets. They require more manual effort at scale, but give you a solid working picture at no cost.
-
Meta Ad Library: Free, no login required. Shows every active ad competitors run on Facebook and Instagram, formats, messaging, and campaign duration.
-
Native platform analytics: Instagram, LinkedIn, TikTok, and other platforms provide analytics for your own accounts. They don't surface competitor data directly, but give you baseline performance numbers for benchmarking.
-
Google Search and Google Alerts: Searching competitor brand names surfaces their content across blogs and news sites. Google Alerts notifies you when competitors appear in newly published content.
-
LinkedIn company pages: Shows follower counts, recent posts, and engagement for every company page, useful for monitoring competitors' content themes and brand voice at no cost.
-
Instagram native search: Let's you view follower counts, top posts, and posting patterns for competitor handles without any third-party tool.
Free tools are a genuine starting point, not a fallback. Many teams run solid competitive analysis for months using only Meta Ad Library, Google Alerts, and native analytics.
Paid Platforms Built for Scale
Paid platforms deliver automated tracking, historical data, and cross-channel reporting in one place. They're worth the investment when manual competitor monitoring starts costing more hours than the subscription.
-
Sprout Social: combines social listening tools with competitor analysis and automated competitor reports. Its competitive analytics module tracks engagement metrics, posting frequency, and audience growth alongside your own data. Sprout's listening features track competitor sentiment across brand mentions and social conversations.
-
Hootsuite: includes competitive analysis alongside scheduling and engagement tools. Its competitive module helps teams track competitor social media performance, compare engagement rate and follower growth, and measure share of voice over time. Hootsuite's automated competitor reports and real-time alerts make it widely used among enterprise marketing teams.
-
Rival IQ: is built specifically for competitive benchmarking. It tracks competitor social media posts, engagement rates, hashtags, and ad activity, with automated reports and alerts when competitors post high-engagement content. Its depth on post-level data helps identify content patterns that broader platforms smooth over.
-
Dash Social: focuses heavily on Instagram competitor analysis and visual content performance. It gives brands granular data on Reels performance, engagement metrics, and competitor content mix. Dash Social fits well when Instagram is the primary competitive battleground.
-
Brandwatch: and similar social listening platforms pull competitor mentions from forums, news sites, and blogs into a consolidated view. This helps teams track share of voice and competitor sentiment across more channels than social platforms alone cover.
Paid platforms shift the workflow from manual data collection to interpretation. That's where the real competitive edge lives, in acting on patterns rather than spending hours finding them.
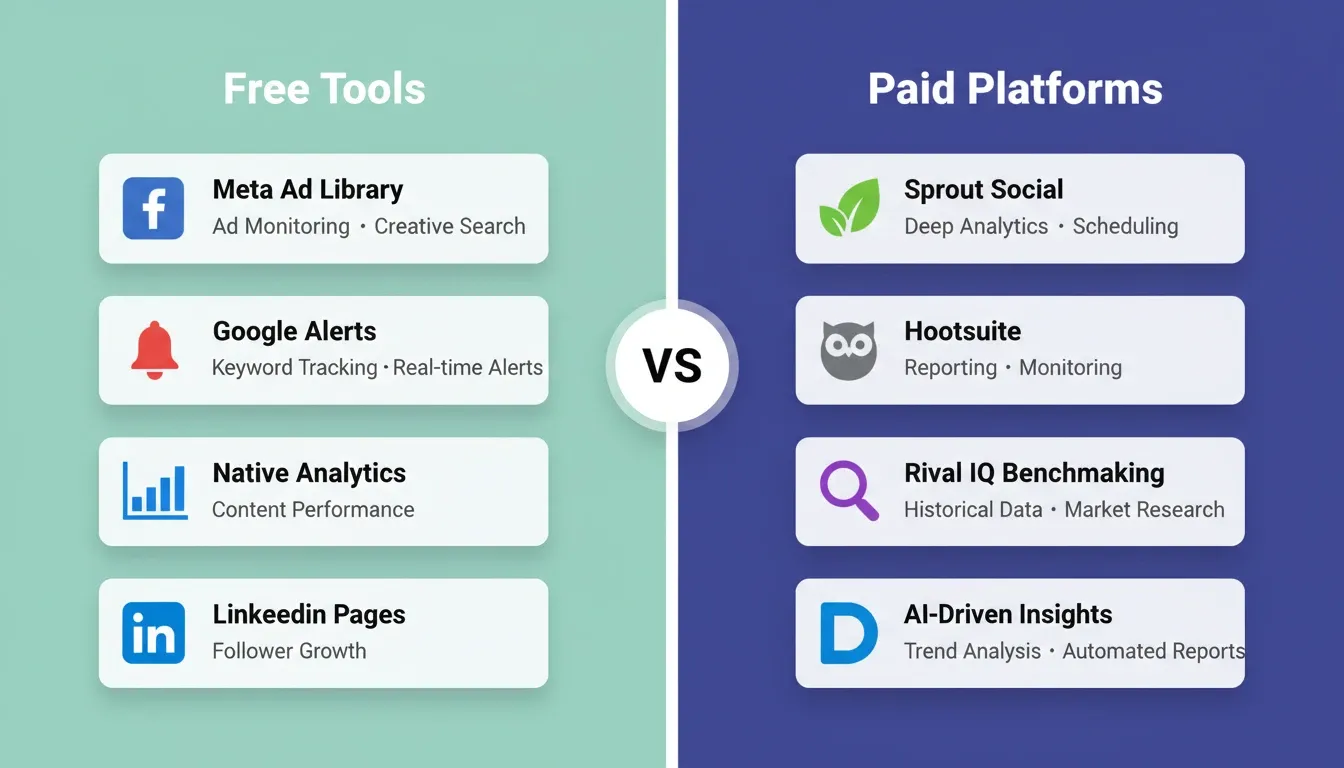
Free tools cover the fundamentals; paid platforms add automation, history, and cross-channel depth
Which Tool Fits Which Team?
Tool selection comes down to three questions: how many competitors to track, how often you need fresh data, and whether social signals alone are enough. This table maps team context to the best-fit option.
| Team size and use case | Best fit | Why |
|---|---|---|
| Solo or small team, tight budget | Meta Ad Library plus Google Alerts | Free coverage of ad monitoring and brand mentions |
| Growth-stage brand, building structure | Rival IQ or Sprout Social starter plan | Organized competitor reports, engagement benchmarks |
| Enterprise team, multiple brands | Hootsuite or Sprout Social enterprise | Cross-platform dashboards, automated reports, team workflows |
| Instagram-first brand | Dash Social | Deep Instagram analytics and competitor comparisons |
| Cross-channel intelligence beyond social | Rocket Intelligence | Connects social signals to pricing, hiring, product, and news |
The right tool is the one your team will actually use consistently. A free tool checked weekly beats an enterprise platform opened once a quarter.
For teams building their own competitive intelligence program, the tool stack matters less than the habit of reviewing it on a fixed cadence.
Turning Competitor Insights Into a Content Plan
Data without a direction is just a spreadsheet. The real value of competitive analysis comes from translating rival patterns into a content strategy that fills the gaps competitors are leaving open.
Spotting Content Gaps in Your Niche
According to Gartner, 63% of CMOs cite budget and resource constraints as their top challenge for 2026. Competitor data is one of the most direct ways to prioritize where to focus that limited budget, rather than guessing what might resonate.
-
Look at competitors' top posts and what's conspicuously absent. If rivals rarely publish educational content but their audience leaves how-to questions in every comment thread, that's an opening. The gap between what audiences want and what competitors deliver shows up clearly in comment sentiment.
-
Map competitor content against search intent. Which topics are competitors publishing consistently - and which related topics are they skipping entirely? Basic keyword research surfaces new content opportunities competitors haven't addressed.
-
Check community conversations on Reddit and forums. Brand mentions in niche communities surface frustrations competitors aren't addressing, content gaps with proven demand already behind them.
-
Analyze top-performing content by format. If rivals dominate on carousels but have never tried short-form video, and your audience research suggests video would resonate, that format gap is actionable.
-
Identify gaps in brand voice and tone. If every competitor takes a formal, data-heavy approach, a more conversational tone can differentiate your brand simply by feeling different to the same audience.
The gaps worth acting on overlap with what your target audience is already searching for or actively discussing. Gaps with no audience demand behind them aren't opportunities; they're empty space.
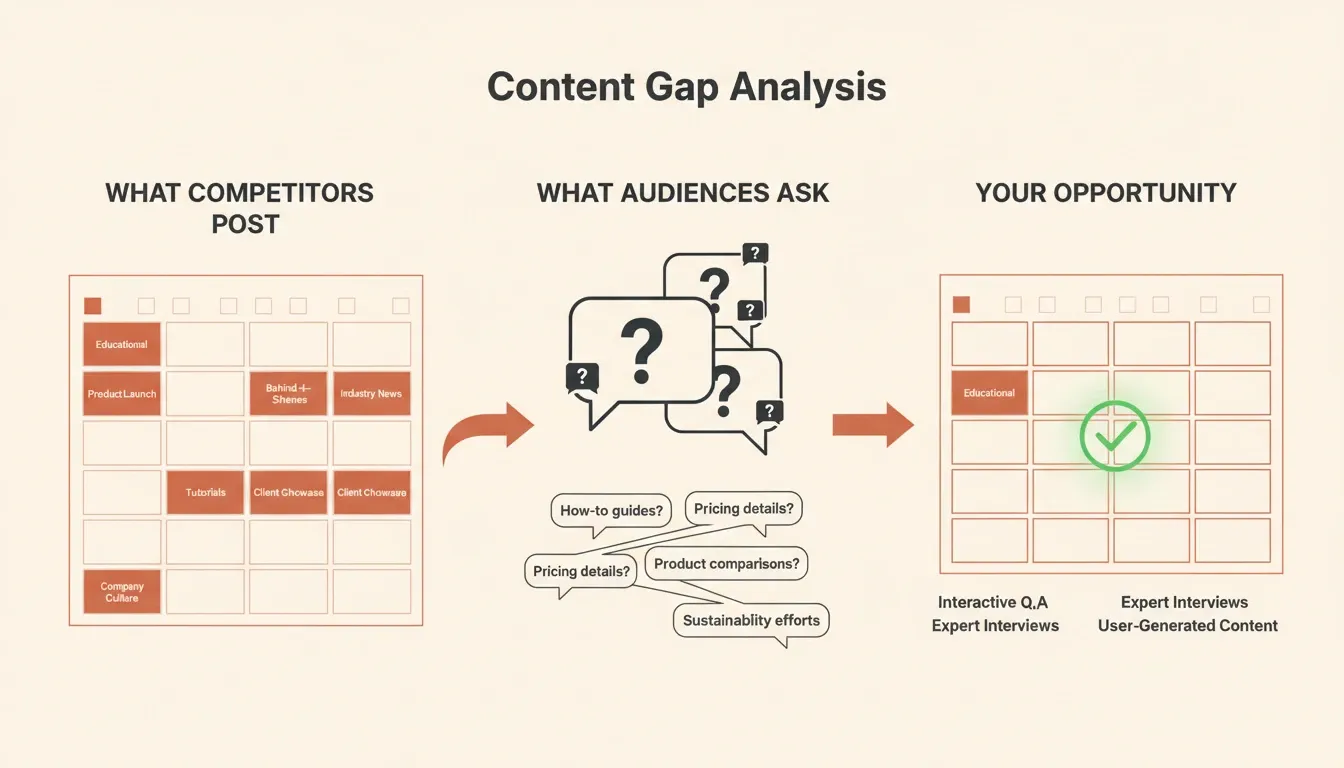
The most actionable content gaps sit at the intersection of competitor blind spots and audience demand
Using Competitors' Strategies to Shape Your Calendar
Once you've identified the gaps, the next move is building them into a publishing plan with clear priorities. A practical monthly process: review competitors' top posts, log what earned high engagement, and define your own angle on each topic.
-
Build a content matrix that maps your upcoming calendar against gaps identified in competitor coverage. Note whether each piece fills a gap, matches a proven competitor format, or tests something entirely new.
-
Balance content types intentionally. If rivals earn stronger engagement on carousels despite posting Reels more often, weight your calendar toward carousels and test whether your audience responds the same way.
-
Use competitor posting frequency as a benchmark, not a fixed target. If three competitors all post five times per week, and that's the industry standard, your twice-weekly cadence deserves honest evaluation against your current engagement metrics.
-
Treat competitors' failures as free data. When a competitor's post on a topic you were also considering earns unusually low engagement, that's a valuable signal before you commit budget to a similar piece.
-
Review audience sentiment in competitor comment sections regularly. Competitor sentiment often reveals content angles that resonate strongly and frustrations that haven't been addressed yet.
As Bit Quirky Consulting founder Tom Edwards noted, "Daily, we track the basic metrics so we can spot any sudden spikes or drops." That discipline, applied to competitor data, is what makes a content plan deliberate rather than reactive.
Understanding brand monitoring and share of voice signals helps you move from reactive posting to proactive positioning.
How Rocket Intelligence Connects Social Signals to the Bigger Picture
Social data is only one layer of the competitive picture. Pricing changes, new hires, product updates, and press coverage each tell a different story, and when these signals move together, they reveal a strategic direction that social posts alone can never surface.
Cross-Channel Monitoring Without the Noise
Most standalone competitor reports are point-in-time snapshots. They show what rivals posted last week, not what their broader pattern of moves reveals about where they're heading.
-
Rocket Intelligence monitors nine categories of competitive signals in parallelpricing, hiring, product changes, news coverage, and more, for every company you follow. When two signals converge at the same time, the platform surfaces an insight framed through your role.
-
Real-time alerts replace manual dashboard checks. Instead of logging into Hootsuite or Sprout Social weekly to review competitor activity, Rocket delivers relevant intelligence when it's actually useful to act on.
-
Every company has a free public profile. Browse competitor dashboards without signing in. Personalized AI-powered intelligence activates when you follow companies and create an account.
-
The signal-to-noise problem is real in competitive monitoring. Most social analytics tools surface high volumes of raw data and leave interpretation to you. Rocket Intelligence surfaces the competitor moves that actually matter to your role.
Real-time alerts and personalized framing mean the competitive picture stays current without your team burning hours on manual monitoring routines.
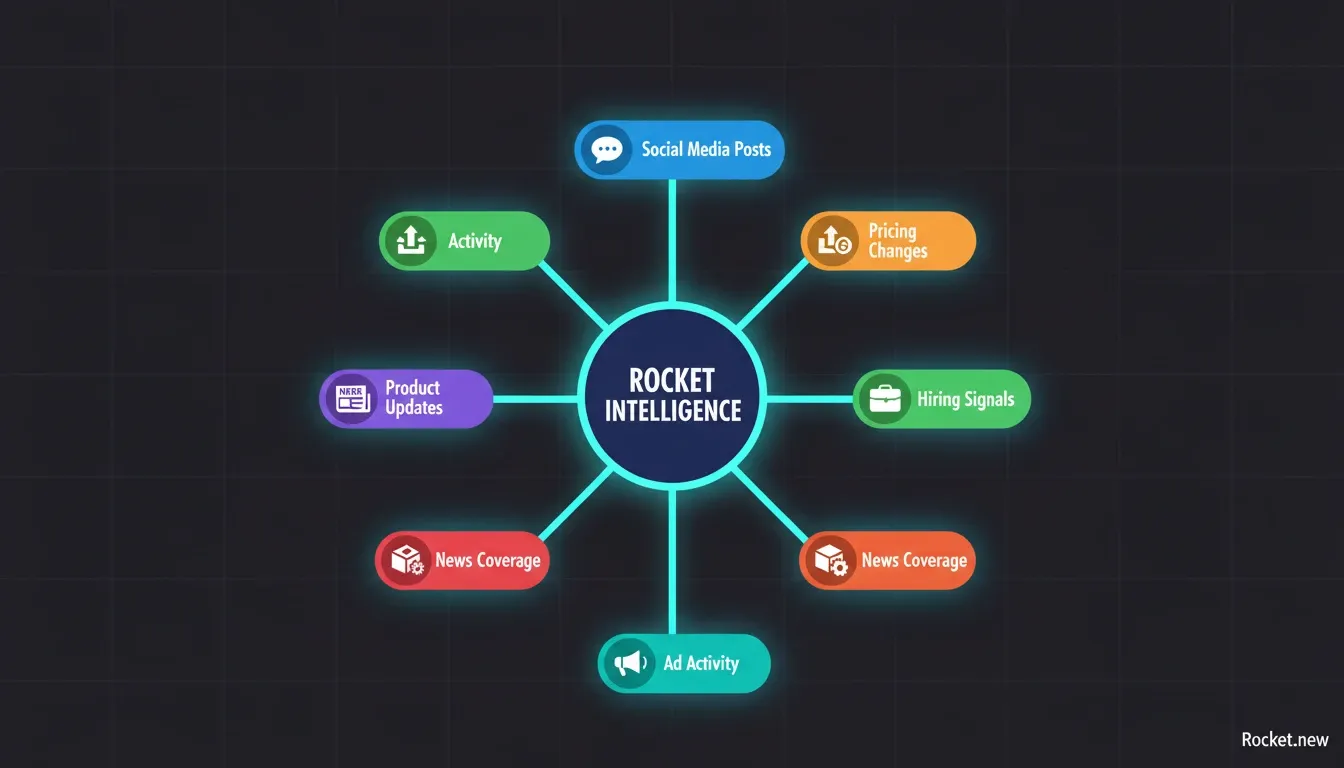
Rocket Intelligence connects social signals to pricing, hiring, and product moves for a complete competitive picture
Where Standalone Competitor Reports Fall Short
Tools like Sprout Social, Hootsuite, and Rival IQ handle the social layer well. But they have meaningful limits when bigger strategic decisions are on the table.
-
Social tools don't connect social activity to business signals. A competitor doubling their LinkedIn posting frequency while actively hiring salespeople is signaling a go-to-market direction. A social analytics platform alone won't surface that connection.
-
Historical data stays siloed inside each platform. Sprout Social and Hootsuite track engagement history on social channels but don't correlate that data with pricing changes or product launches happening at the same time.
-
Manual interpretation takes significant time. Most competitive analysis tools give you raw data and leave you to identify the patterns. Rocket Intelligence reads patterns across signal categories and delivers the summary.
-
Keeping competitive intelligence current requires cross-channel tracking. A social-only snapshot runs stale quickly for teams watching multiple competitors in a fast-moving market.
The full story of where a competitor is heading is almost always in the combination of signals - not in any single channel's data.
Understanding competitive strategy frameworks helps you act on these combined signals rather than just observe them.
Start Watching Your Rivals in 30 Seconds
The gap for most teams isn't knowledge - it's the infrastructure to watch competitors consistently without it becoming a second full-time job. Rocket Intelligence lets you follow your first competitor in 30 seconds, no credit card needed.
-
Select the companies you track most closely and start receiving cross-channel intelligence that connects social signals to the broader competitive picture.
-
It's free to start and built for continuous monitoring rather than periodic manual audits.
-
Personalized intelligence activates immediately, framed through your role and the companies you choose to follow.
The competitive advantage in social isn't found in one quarterly audit; it's built through consistent, connected intelligence over time.
Turn Competitor Data Into Your Strongest Social Strategy
Knowing what rivals are doing on social gives you something concrete: decisions based on evidence, not instinct. The process covered here - tracking the right signals, running structured audits, and filling the content gaps competitors leave open - gets sharper with every cycle.
Start with engagement rate, posting frequency, and share of voice across three to five direct competitors. Pick one or two social media competitor analysis tools that fit your team's scale, then turn what you find into a calendar where every piece has a clear reason behind it.
For a deeper look at how competitive signals translate into product and GTM decisions, explore how teams use competitive intelligence for roadmap planning.
Ready to go beyond social signals?
Track competitors across pricing, hiring, and product updates, sign up for free at Rocket.new.
Frequently Asked Questions
How often should I run a competitive analysis on social media?
A monthly review of core metrics - engagement rate, posting frequency, and competitors' top posts, is a realistic cadence for most teams. Quarterly, add a deeper pass covering share of voice and Meta Ad Library activity. The goal is consistent monitoring rather than a single large analysis each year that goes stale between cycles.
Can I track competitor ad spend on social media for free?
Exact spend figures are not publicly available, but the Meta Ad Library shows every active ad competitors run on Facebook and Instagram, formats, messaging, and campaign duration, with no login needed. Volume and variety of active ads are reliable proxies for relative investment levels. For Google and YouTube campaigns, the Google Ads Transparency Center offers similar free visibility.
What is the best approach for Instagram competitor analysis?
Start with engagement rate per post rather than follower count. Review which content types, Reels, carousels, Stories, or single images earn the most likes, comments, and saves for each competitor, and note posting frequency alongside the hashtags on their top-performing posts. For deeper historical data and automated competitor reports, tools like Dash Social and Rival IQ offer dedicated Instagram analytics beyond what the native platform shows.
How does social listening differ from tracking competitors directly?
Tracking competitors directly means monitoring their owned social media content, what they post, how often, and how their audience responds with likes, comments, and shares. Social listening is broader: it monitors brand mentions, conversations, and sentiment across the full web - including regular users, news sites, forums, and blogs. Tracking tells you what competitors are publishing; social listening tells you what people actually think about it.
Table of contents
- -What Your Rivals' Social Presence Actually Tells You
- -Engagement Rate and Posting Cadence
- -Share of Voice and Ad Spend
- -What Should You Actually Track First?
- -How to Run a Step-by-Step Competitor Analysis Audit
- -Setting Up Your Audit Framework
- -What Does a Solid Audit Actually Look Like?
- -Free and Paid Competitive Analysis Tools Compared
- -Free Tools Worth Bookmarking
- -Paid Platforms Built for Scale
- -Which Tool Fits Which Team?
- -Turning Competitor Insights Into a Content Plan
- -Spotting Content Gaps in Your Niche
- -Using Competitors' Strategies to Shape Your Calendar
- -How Rocket Intelligence Connects Social Signals to the Bigger Picture
- -Cross-Channel Monitoring Without the Noise
- -Where Standalone Competitor Reports Fall Short
- -Start Watching Your Rivals in 30 Seconds
- -Turn Competitor Data Into Your Strongest Social Strategy