
Use this 20-prompt phased library to build a production-ready sales dashboard with Rocket.new, covering auth, pipeline, metrics, forecasting, and polish. No coding needed. Each prompt builds on the last.
Use this phased library of AI prompts to build sales dashboard 2026 apps covering auth, pipeline, metrics, forecasting, and polish. Rocket.new turns each prompt into a deployed, production-ready Next.js app without writing a line of code.
What Is an AI Sales Dashboard Prompt Library?
An AI sales dashboard prompt library is a sequenced set of natural-language instructions that guide an AI app builder through generating a complete, production-ready sales dashboard. Instead of writing a single vague request, you follow a phased build order, with each prompt using the RIGS Method, Role, Instruction, Guardrails, and Specifics: foundation first, then pipeline views, then metrics, then forecasting, then polish.
Each prompt feeds context into the next, so the final app is coherent rather than cobbled together. Using specific details improves prompt quality and produces more immediately usable drafts with less editing. This is what separates a working dashboard from a generic prototype.
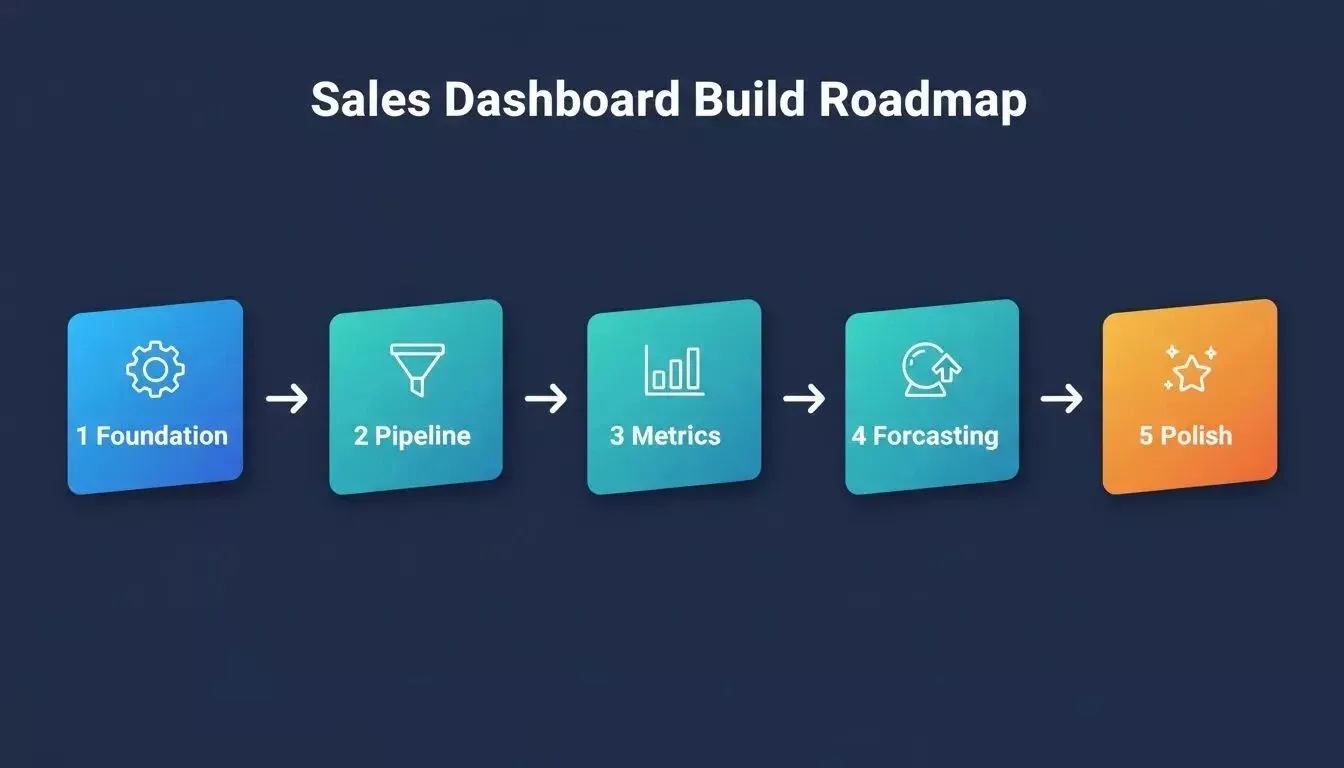
The complete five-phase roadmap for building a production-ready sales dashboard with AI prompts.
Why Does Prompt Sequence Matter for Dashboard Projects?
Prompt sequence matters because each dashboard component depends on data structures defined in an earlier step. Skipping the foundation means every subsequent prompt generates disconnected, unreliable output.
**The fastest path to a working dashboard is not a single prompt. It is a sequence that respects dependencies. **According to HubSpot, 82% of sales professionals say AI helps them gain actionable insights from data, yet most teams still rely on manual work to get pipeline visibility.
If you want to apply prompt engineering best practices to this workflow, each prompt below is structured to paste directly into Rocket.new's Build chat window.
-
Sequence creates context. Each prompt feeds the next, giving the AI enough context to generate accurate outputs
-
Dependencies matter. You cannot generate a deal leaderboard before defining the deal schema
-
Compound quality. A structured library produces a dashboard where every component references the same data fields
Before you build: Consider running a Solve research task first. Rocket.new's Solve pillar lets you validate your dashboard requirements before writing a single Build prompt.
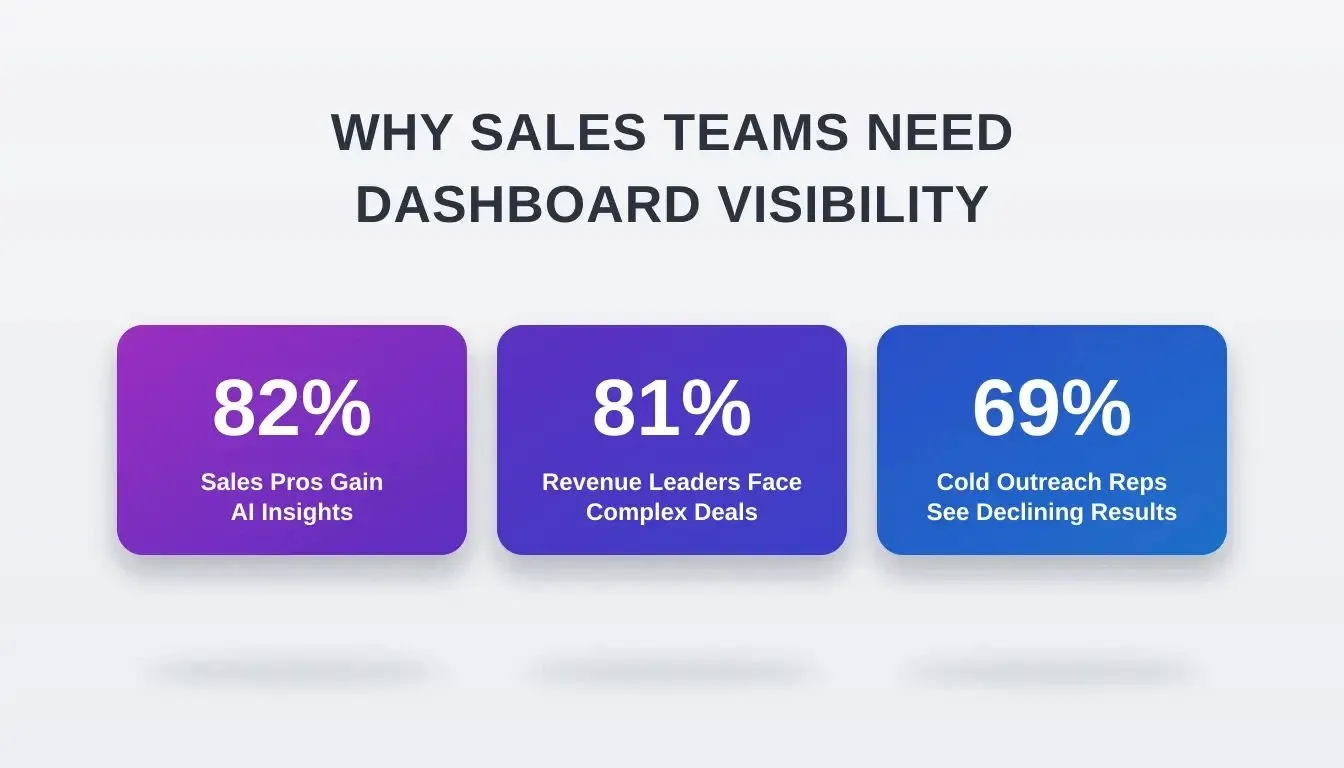
Key statistics behind the case for AI-powered sales dashboards.
Phase One: Foundation and Access Control
Before any visual component, you need authentication, team structure, and a data schema. This phase establishes the backbone every subsequent prompt depends on. Do not skip it.
Prompt 1: Multi-Role Authentication
Create a sales dashboard app with three user roles: Rep, Manager, and Admin. Use email/password auth with role assignment on signup.
Pro tip: Add social login via Google OAuth using Supabase's built-in social auth. Rocket.new can wire this up with a single follow-up prompt. Learn more about how to generate an authentication system using AI.
Prompt 2: Team and Territory Setup
Add a Teams page where Admins create sales teams with a name, region, and assigned manager.
Pro tip: Include a bulk CSV import for team members.
Prompt 3: CRM Deal Schema
Generate a Deals table with fields including deal name, company, value, stage, owner, dates, loss reason, and source, and structure the schema so it works cleanly with crm software and customer data for later automation.
Pro tip: Add a custom field builder so Admins can extend the schema, since agentic data orchestration connects AI directly to CRM systems to automate dashboard updates.
Prompt 4: Sample Data Seeding
Seed the database with forty realistic deals across four reps and two teams.
Pro tip: Add a Reset Demo Data button visible only to Admins.
Try Prompt 1 now. Open Rocket.new's Build tool, paste Prompt 1, and watch your authentication layer generate in minutes. Start building for free
Phase Two: Pipeline Management and Deal Flow
With the foundation set, prompts for sales can now generate visual pipeline management. This phase gives reps and managers the daily deal-tracking tools they need most.
Prompt 5: Kanban Deal Board
Create a drag-and-drop Kanban board for the Deals table with columns matching each pipeline stage.
Prompt 6: Deal Detail with Activity Log
When a user clicks a deal card, open a detail panel with an activity timeline that auto-logs stage changes.
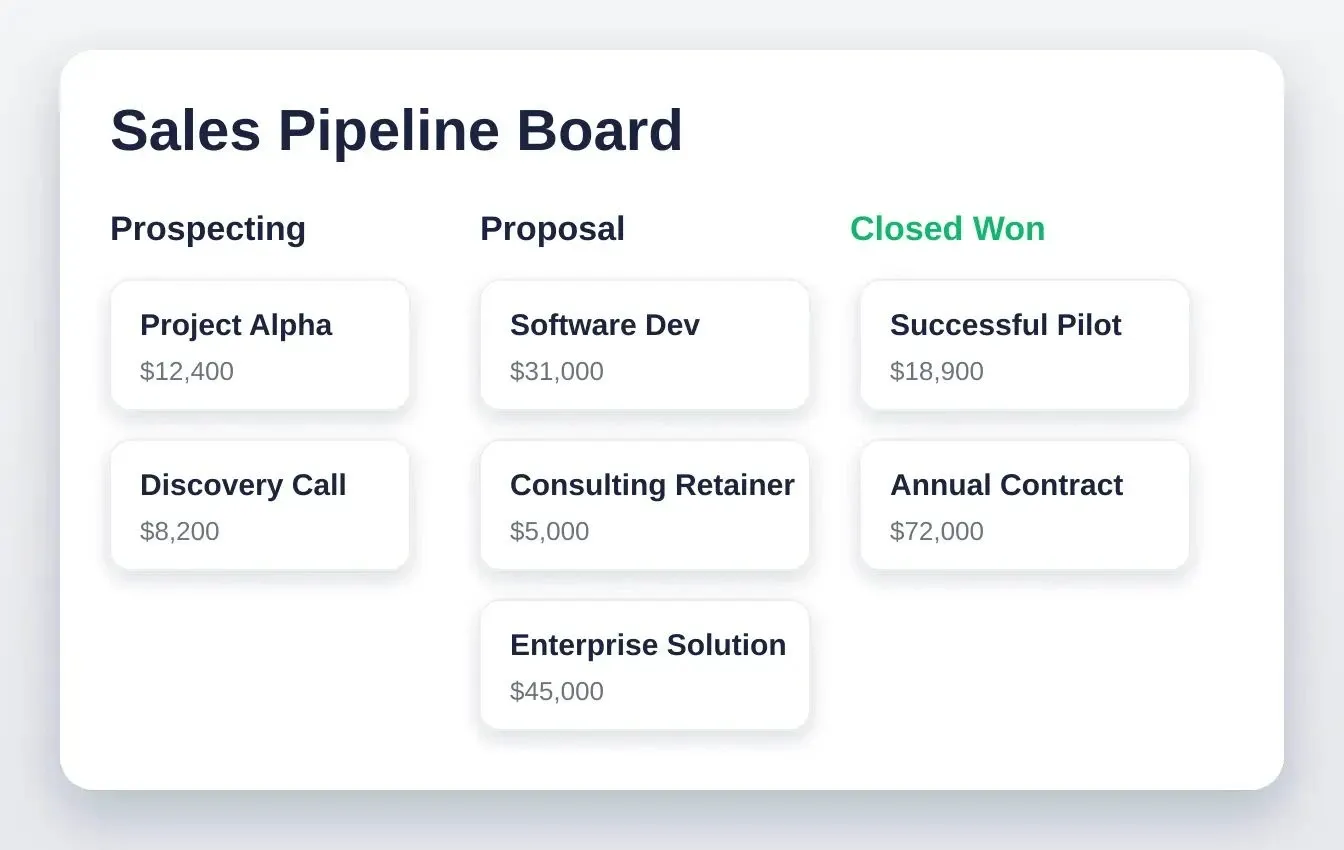
A Kanban pipeline board generated from Prompts 5 and 6, with drag-and-drop deal management and activity logging.
Prompt 7: Lost Deal Tracker
Create a dedicated Lost Deals view with a pie chart breaking down loss reasons.
Prompt 8: Stale Deal Alerts
Add an automated alert system that flags deals sitting in the same stage for more than ten business days.
According to Gong's research, 81% of revenue leaders say deals are more complex than before, making pipeline visibility tools like this phase essential, not optional. You can also explore how to build an internal dashboard that connects to your data sources for a broader integration approach.
Phase Three: Performance Metrics and Leaderboards
Sales leaders need a single view of team performance to run effective pipeline reviews and coaching sessions. These four prompts generate the core metrics layer that surfaces key metrics such as Total Revenue, Win Rate, and Pipeline Velocity in KPI cards before users drill into charts, turning raw deal data into actionable performance insights.
Prompt 9: Rep Leaderboard
Build a leaderboard page showing all reps ranked by closed-won revenue this quarter.
Prompt 10: Quota Attainment Dashboard
Create a quota attainment view with horizontal bar charts showing target vs actual.
Prompt 11: Win Rate by Deal Source
Add a chart showing win rate broken down by deal source.
Prompt 12: Average Sales Cycle Chart
Generate a line chart showing average days-to-close for won deals plotted monthly.
How Does Rocket.new Turn These Prompts into Live Apps?
Rocket.new is the vibe solutioning platform that combines three pillars: Solve, Build, and Intelligence. It also supports AI-powered workflows and AI agents, which matters as 40% of enterprises will embed task-specific AI agents by 2026. For sales dashboard projects, Build is the execution layer. Describe what you want in plain language, and Rocket.new generates production-ready Next.js (web) or Flutter (mobile) code and deploys it to a live URL.
Rocket.new handles hosting, HTTPS, and deployment for you with no infrastructure configuration required. The platform supports AI app builder with database integration out of the box, so your deal schema from Prompt 3 connects directly to a live Supabase backend.
-
Paste a prompt, get a deployed app. The platform generates full-stack Next.js code and deploys to a live URL
-
No manual data entry. Describe your deal fields in plain language; Rocket.new generates the schema
-
Built-in auth. Role-based access is shipped as part of the generated app
-
Advisor Agent handles refinement. Rocket.new's built-in senior architect sub-agent diagnoses root causes and resolves error loops automatically
-
26+ connectors available. Wire in payments, databases, AI models, email, CRM, and analytics from a single prompt to support custom agents and connected marketing workflows. See the full connectors list
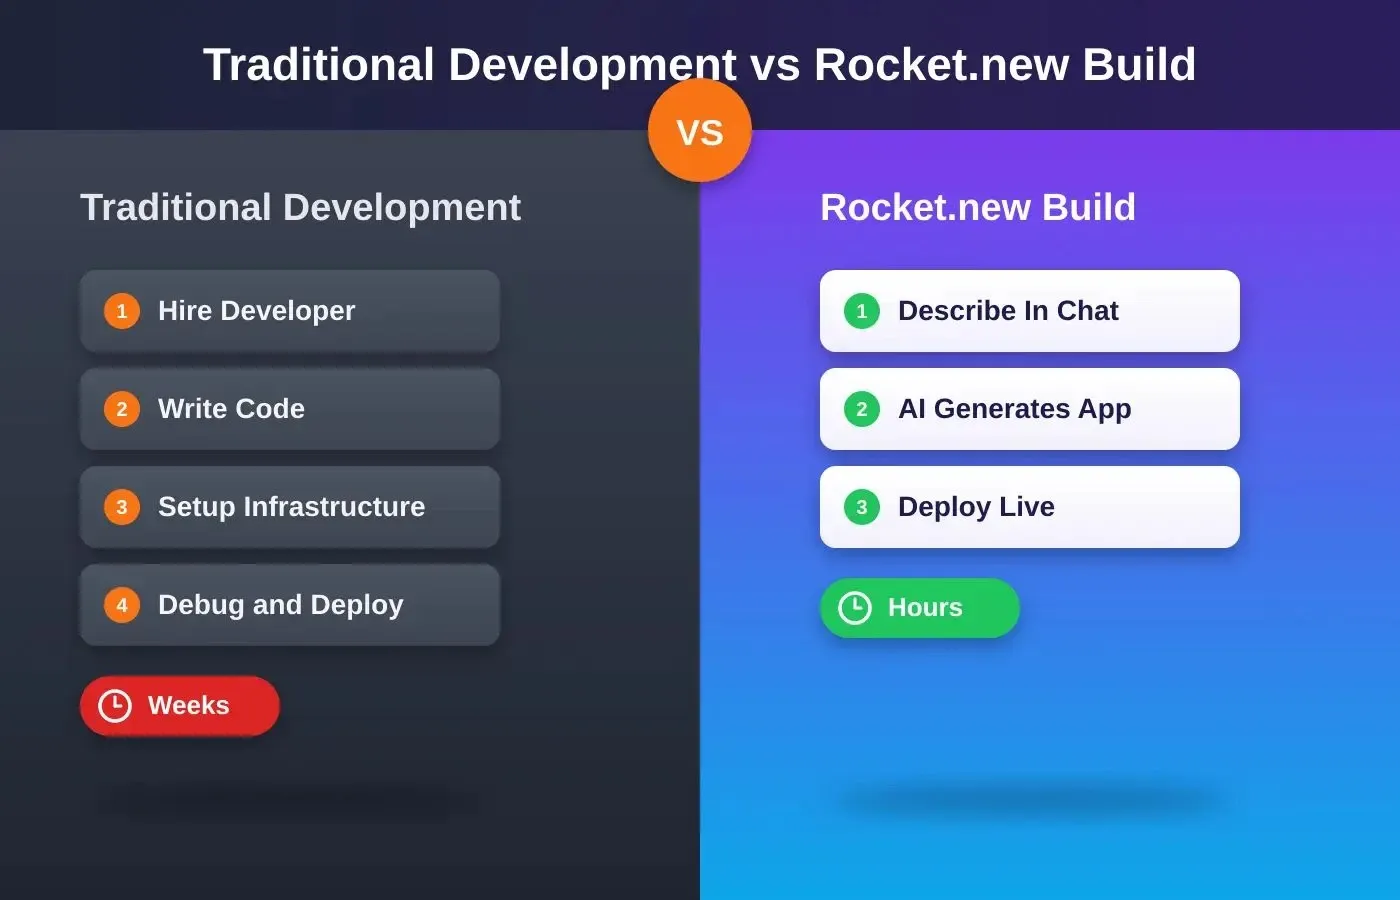
Traditional dashboard development takes weeks. Rocket.new's prompt-to-app workflow ships the same result in hours.
Phase Four: Forecasting and Revenue Reporting
Sales leaders need forward-looking data for pipeline reviews and quarterly planning. This phase adds the revenue intelligence layer that turns pipeline data into decisions.
Prompt 13: Weighted Pipeline Forecast
Create a forecast page that calculates expected revenue by multiplying deal values by stage-based probability weights.
Prompt 14: Deal Velocity Trend
Add a deal velocity chart showing how fast deals move through stages month-over-month.
Prompt 15: Cohort Revenue Analysis
Build a cohort analysis table grouping deals by the month they entered the pipeline.
Prompt 16: CSV Export for Finance
Add a Generate Report button that exports a CSV file with deal data and filters.
For additional inspiration on building financial reporting dashboards with similar prompt patterns, the same phased approach applies.
Phase Five: Polish for Production Readiness
The difference between a dashboard your team uses and one they abandon is production polish. This final phase addresses the specific pain points that cause adoption failure after launch: empty states, mobile access, real-time updates, performance, and reliable dashboard data flow. It also accounts for agentic data orchestration, which connects AI directly to CRM systems so updates can flow into the dashboard automatically.
Prompt 17: Empty States with Guidance
Add contextual empty states to every page with helpful calls to action.
Prompt 18: Mobile-Responsive Layout
Make the entire dashboard mobile-responsive with adaptive layouts.
Prompt 19: Real-Time Refresh on Deal Update
Implement real-time data refresh so all dashboards update automatically when a deal changes.
Prompt 20: Core Web Vitals Audit
Run a performance audit optimizing for LCP, FID, and CLS thresholds.
Rocket.new's built-in performance dashboard scores your app against Core Web Vitals and surfaces one-click fixes.
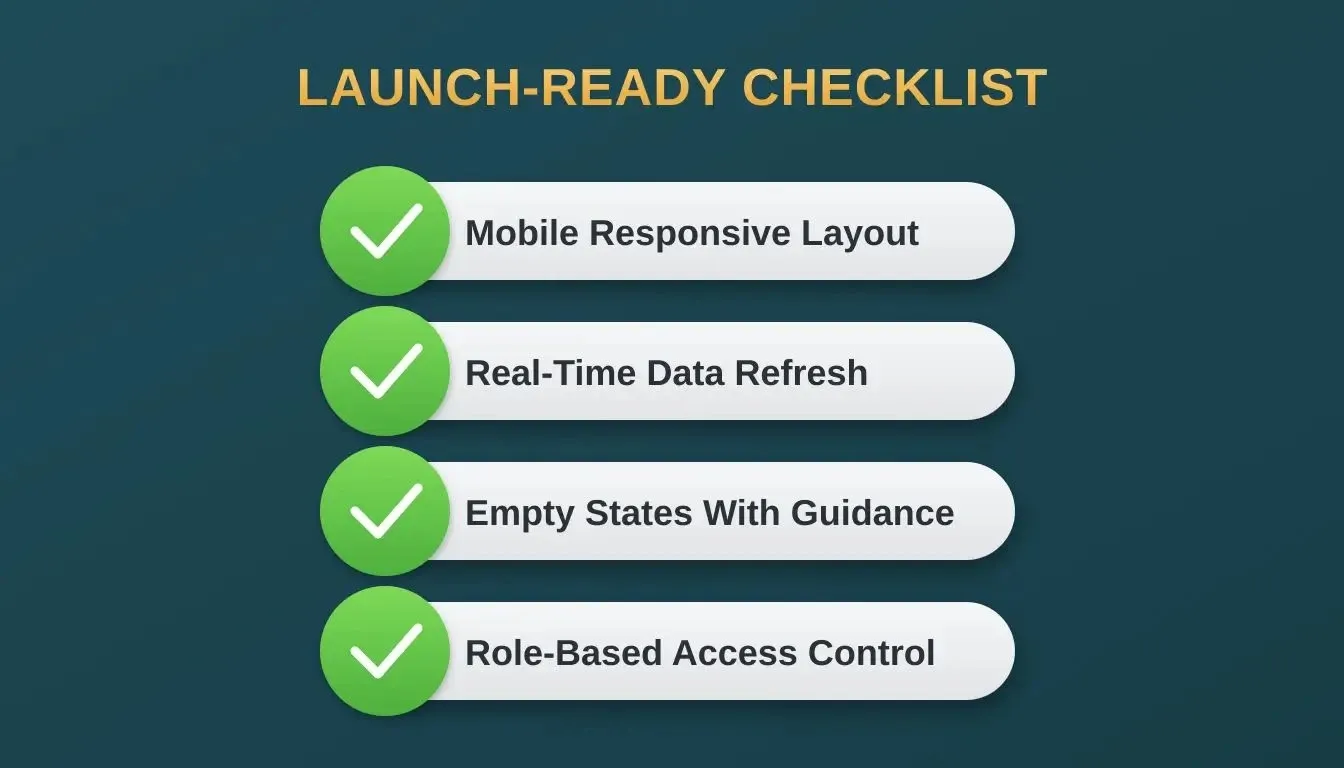
The five production readiness checks your sales dashboard must pass before going live.
Which Phase Delivers the Fastest Wins?
| Phase | Prompts | Time to Ship | Immediate Value | Who Benefits Most |
|---|---|---|---|---|
| Foundation | 1-4 | 30 minutes | Access control, data structure | Admin, Ops |
| Pipeline | 5-8 | 45 minutes | Daily deal management | Sales reps, Managers |
| Metrics | 9-12 | 30 minutes | Performance tracking | Sales leaders |
| Forecasting | 13-16 | 40 minutes | Revenue predictions | VP Sales, Finance |
| Polish | 17-20 | 35 minutes | Adoption, mobile access | Whole team |
Pro tip: start with Phase 1 and Phase 2 on the same day. The Kanban board from Phase 2 is the single highest-impact deliverable for daily rep adoption.
Prompt-to-Output Reference
| Prompt | What It Generates | Depends On |
|---|---|---|
| 1 | Auth system with three roles | Nothing, start here |
| 2 | Teams and territory management | Prompt 1 (roles) |
| 3 | Deals table schema | Prompt 1 (users) |
| 4 | Seeded demo data | Prompt 3 (schema) |
| 5 | Kanban pipeline board | Prompts 3-4 |
| 6 | Deal detail panel and activity log | Prompt 5 |
| 7 | Lost deals view and pie chart | Prompts 3, 5 |
| 8 | Stale deal alert system | Prompts 3, 5 |
| 9 | Rep leaderboard | Prompts 1, 3 |
| 10 | Quota attainment view | Prompts 1, 3 |
| 11 | Win rate by source chart | Prompt 3 |
| 12 | Average sales cycle chart | Prompt 3 |
| 13 | Weighted pipeline forecast | Prompts 3, 5 |
| 14 | Deal velocity trend chart | Prompts 3, 5 |
| 15 | Cohort revenue analysis table | Prompt 3 |
| 16 | CSV export for finance | Prompts 3, 13 |
| 17 | Empty states with CTAs | All prior prompts |
| 18 | Mobile-responsive layout | All prior prompts |
| 19 | Real-time data refresh | Prompts 5-8 |
| 20 | Core Web Vitals audit | All prior prompts |
Rocket.new vs. Building a Sales Dashboard Manually
| Dimension | Manual Development | Rocket.new Build |
|---|---|---|
| Time to first prototype | Days to weeks | Under 2 hours |
| Tech stack | Developer-chosen | Next.js (web) / Flutter (mobile) |
| Auth setup | Custom build required | Generated with role-based access in Prompt 1 |
| CRM integration | Custom API work | HubSpot connector via Connectors; an ai tool can also generate analytical code blocks for Power BI or Tableau when reporting needs to extend outside the app |
| Deployment | DevOps setup required | Rocket.new handles hosting and HTTPS |
| Iteration speed | Code, PR, deploy cycle | Chat prompt to live update |
| Research before build | Separate tool or skipped | Solve pillar built in |
| Competitor monitoring | Separate tool or skipped | Intelligence pillar built in for competitor analysis and competitive analysis in the research workflow |
If you want to see how quickly this translates to a working product, read how to build an app with AI in minutes or explore a project tracking web app built with the same approach.
Go From Prompt 1 to Deployed App Faster
Rocket.new is the only platform that combines research (Solve), app generation (Build), and competitor monitoring (Intelligence) in one product. You can validate your dashboard requirements before building, ship a production-ready Next.js app from prompts, and track how competitor sales tools evolve after you launch, while its research and monitoring also help refine messaging for lead generation and stronger positioning.
Start building your sales dashboard for free on Rocket.new and go from Prompt 1 to a deployed app in under two hours.
Your Sales Team Deserves a Dashboard That Ships This Week
Every prompt in this library was designed to work as a sequence. The difference between teams that hit quota and teams that miss it often comes down to pipeline visibility and speed of decision making.
The same prompts can also support sales conversations by identifying prospect pain points from job postings and preparing objection handling before cold outreach.
Table of contents
- -What Is an AI Sales Dashboard Prompt Library?
- -Why Does Prompt Sequence Matter for Dashboard Projects?
- -Phase One: Foundation and Access Control
- -Prompt 1: Multi-Role Authentication
- -Prompt 2: Team and Territory Setup
- -Prompt 3: CRM Deal Schema
- -Prompt 4: Sample Data Seeding
- -Phase Two: Pipeline Management and Deal Flow
- -Prompt 5: Kanban Deal Board
- -Prompt 6: Deal Detail with Activity Log
- -Prompt 7: Lost Deal Tracker
- -Prompt 8: Stale Deal Alerts
- -Phase Three: Performance Metrics and Leaderboards
- -Prompt 9: Rep Leaderboard
- -Prompt 10: Quota Attainment Dashboard
- -Prompt 11: Win Rate by Deal Source
- -Prompt 12: Average Sales Cycle Chart
- -How Does Rocket.new Turn These Prompts into Live Apps?
- -Phase Four: Forecasting and Revenue Reporting
- -Prompt 13: Weighted Pipeline Forecast
- -Prompt 14: Deal Velocity Trend
- -Prompt 15: Cohort Revenue Analysis
- -Prompt 16: CSV Export for Finance
- -Phase Five: Polish for Production Readiness
- -Prompt 17: Empty States with Guidance
- -Prompt 18: Mobile-Responsive Layout
- -Prompt 19: Real-Time Refresh on Deal Update
- -Prompt 20: Core Web Vitals Audit
- -Which Phase Delivers the Fastest Wins?
- -Prompt-to-Output Reference
- -Rocket.new vs. Building a Sales Dashboard Manually
- -Go From Prompt 1 to Deployed App Faster
- -Your Sales Team Deserves a Dashboard That Ships This Week